HAL Id: hal-01480885
https://hal.archives-ouvertes.fr/hal-01480885
Submitted on 1 Mar 2017
HAL is a multi-disciplinary open access
archive for the deposit and dissemination of
sci-entific research documents, whether they are
pub-lished or not. The documents may come from
teaching and research institutions in France or
abroad, or from public or private research centers.
L’archive ouverte pluridisciplinaire HAL, est
destinée au dépôt et à la diffusion de documents
scientifiques de niveau recherche, publiés ou non,
émanant des établissements d’enseignement et de
recherche français ou étrangers, des laboratoires
publics ou privés.
Hierarchical Region-Network Sparsity for
High-Dimensional Inference in Brain Imaging
Danilo Bzdok, Michael Eickenberg, Gaël Varoquaux, Bertrand Thirion
To cite this version:
Danilo Bzdok, Michael Eickenberg, Gaël Varoquaux, Bertrand Thirion. Hierarchical Region-Network
Sparsity for High-Dimensional Inference in Brain Imaging. International conference on Information
Processing in Medical Imaging (IPMI) 2017, Jun 2017, Boone, North Carolina, United States.
�hal-01480885�
High-Dimensional Inference in Brain Imaging
Danilo Bzdok, Michael Eickenberg, Ga¨el Varoquaux, Bertrand ThirionINRIA, Parietal team, Saclay, France
Abstract. Structured sparsity penalization has recently improved sta-tistical models applied to high-dimensional data in various domains. As an extension to medical imaging, the present work incorporates priors on network hierarchies of brain regions into logistic-regression to distinguish neural activity effects. These priors bridge two separately studied levels of brain architecture: functional segregation into regions and functional integration by networks. Hierarchical region-network priors are shown to better classify and recover 18 psychological tasks than other sparse esti-mators. Varying the relative importance of region and network structure within the hierarchical tree penalty captured complementary aspects of the neural activity patterns. Local and global priors of neurobiological knowledge are thus demonstrated to offer advantages in generalization performance, sample complexity, and domain interpretability.
1
Introduction
Many quantitative scientific domains underwent a recent shift from the clas-sical “long data” regime to the high-dimensional “wide data” regime. In the brain imaging domain, many contemporary technologies for acquiring brain sig-nals yield many more variables per observation than total observations per data sample. This n p scenario challenges various statistical methods from classical statistics. For instance, estimating generalized linear models without additional assumptions yields an underdetermined system of equations. Many such ill-posed estimation problems have benefited from sparsity assumptions [3]. Those act as regularizer by encouraging zero coefficients in model selection. Sparse super-vised and unsupersuper-vised learning algorithms have proven to yield statistical rela-tionships that can be readily estimated, reproduced, and interpreted. Moreover, structured sparsity can impose domain knowledge on the statistical estimation, thus shrinking and selecting variables guided by expected data distributions [3]. These restrictions to model complexity are an attractive plan of attack for the >100,000 variables per brain map. Yet, what neurobiological structure best lends itself to exploitation using structured sparsity priors?
Neuroscientific concepts on brain organization were long torn between the two extremes functional specialization and functional integration. Functional special-ization emphasizes that microscopically distinguishable brain regions are solving distinct computational problems [14]. Conversely, functional integration empha-sizes that neural computation is enabled by a complex interplay between these
distinct brain regions [19]. However, local neuronal populations and global con-nectivity profiles are thought to go hand-in-hand to realize neural processes. Yet, probably no existing brain analysis method acknowledges that both functional design principles are inextricably involved in realizing mental operations.
Functional specialization has long been explored and interpreted. Single-cell recordings and microscopic tissue examination revealed the segregation of the occipital visual cortex into V1, V2, V3, V3A/B, and V4 regions [22]. Tissue lesion of the mid-fusiform gyrus of the visual system was frequently reported to impair recognition of others’ identity from faces [11]. As a crucial common point, these and other methods yield neuroscientific findings naturally interpreted according to non-overlapping, discrete region compartments as the basic architecture of brain organization. More recently, the interpretational focus has shifted from circumscribed regions to network stratifications in neuroscience. Besides analyses of electrophysiological oscillations and graph-theoretical properties, studies of functional connectivity correlation and independent component analysis (ICA) became the workhorses of network discovery in neuroimaging [6]. As a common point of these other methods, neuroscientific findings are naturally interpreted as cross-regional integration by overlapping network compartments as the basic architecture of brain organization, in contrast to methods examining regional specialization.
Building on these two interpretational traditions in neuroscience, the present study incorporates neurobiological structure underlying functional segregation and integration into supervised estimators by hierarchical structured sparsity. Every variable carrying brain signals will be a-priori assigned to both region and network compartments to improve high-dimensional model fitting based on existing neurobiological knowledge. Learning algorithms exploiting structured sparsity have recently made much progress in various domains from processing auditory signals, natural images and videos to astrophysics, genetics, and confor-mational dynamics of protein complexes. The hierarchical tree penalties recently suggested for imaging neuroscience [12] will be extended to introduce neurobio-logically plausible region and network priors to design neuroscience-specific clas-sifiers. Based on the currently largest public neuroimaging repository (Human Connectome Project [HCP]) and widely used region [8] and network [18] atlases, we demonstrate that domain-informed supervised models gracefully tackle the curse of dimensionality, yield more human-interpretable results, and generalize better to new samples than domain-naive black-box estimators.
2
Methods
This paper contributes a neuroscience adaptation of hierarchical structured tree penalties to jointly incorporate region specialization and network integration pri-ors into high-dimensional prediction. We capitalize on hierarchical group lasso to create a new class of convex sparse penalty terms. These conjointly acknowledge local specialization and global integration when discriminating defined psycho-logical tasks from neural activity maps. Rather than inferring brain activity from
psychological tasks by independent comparisons of task pairs, this approach si-multaneously infers a set of psychological tasks from brain activity maps in a multivariate setting and allows for prediction in unseen neuroimaging data.
2.1 Rationale
3D brain maps acquired by neuroimaging scanners are high-dimensional but, luckily, the measured signal is also highly structured. Its explicit dimensional-ity, the number of brain voxels, typically exceeds 100,000 variables, while the number of samples rarely exceeds few hundreds. This n p scenario directly implies underdetermination of any linear model based on dot products with the voxel values. However, the effective dimensionality of functional brain scans has been shown to be much lower [7]. Two types of low-dimensional neighbor-hoods will be exploited by injecting accepted knowledge of regional specializa-tion (i.e., region priors) and spatiotemporal interacspecializa-tions (i.e., network priors)
Combined region-network prior Region prior Network prior Vi su al A ud ito ry
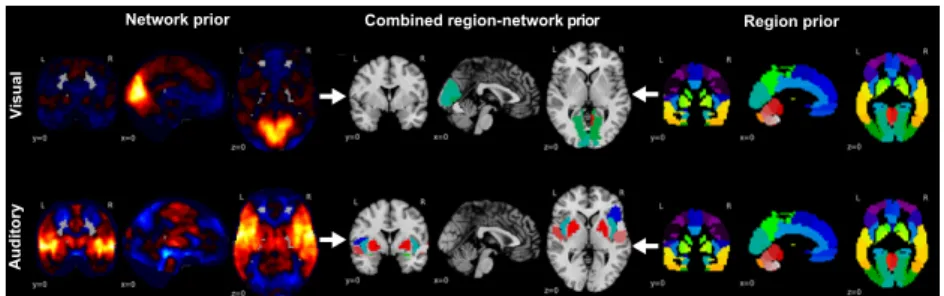
Fig. 1. Building blocks of the hierarchical region-network tree. Displays the a-priori neurobiological knowledge introduced into the classification problem by hierar-chical structured sparsity. Left: Continuous, partially overlapping brain network priors (hot-colored, network atlas taken from [18]) accommodate the functional integration perspective of brain organization. Right: Discrete, non-overlapping brain region priors (single-colored, region atlas taken from [8]) accommodate the functional segregation perspective. Middle: These two types of predefined voxel groups are incorporated into a joint hierarchical prior of parent networks with their descending region child nodes. Top to bottom: Two exemplary region-network priors are shown, including the early cortices that process visual and sound information from the environment.
Fig. 2. Hierarchical Tree Prior.
into statistical estimation.
Major brain networks emerge in hu-man individuals before birth [9]. Their nodes have more similar functional pro-files than nodes from different networks [2]. As a popular method for network ex-traction, ICA [6] yields continuous brain maps with voxel-level resolution. The re-gion nodes of ICA network are spatially disjoint sets of voxel groups that agree with boundaries of brain atlases. Hence, each region from a brain atlas can be
uniquely associated with one of the extracted ICA networks. Here, previously published network definitions obtained using ICA [18] and region definitions ob-tained from spatially constrained clustering [8] allowed constructing a hierarchy of global ICA networks with their assigned local cluster regions (Figure 1). The ensuing network-region tree was used as a frequentist prior of expected weight distributions to advantageously bias supervised model fitting.
Specifically, this tree structure was plugged into hierarchical sparsity penalty terms [12]. It extends the group lasso [21] by permitting variable groups that contain each other in a nested tree structure. The first hierarchical level are the network groups with all the voxels of the brain regions associated with them. Each network node in turn descends into a second hierarchical level with brain regions of neighboring voxels (Figure 2). Induced by the region-network sparsity tree, a child node enters the set of relevant voxel variables only if its parent node has been selected [3]. Conversely, if a parent node is deselected, also the voxel variables of all child nodes are deselected. Moreover, the coefficients of all region or all network groups can be weighed individually. Trading off the voxel penalties of the network level against the voxel penalties of the region level we can design distinct estimation regimes.
2.2 Problem formulation
We formulate our estimation problem in the framework of regularized empirical risk minimization applied to linear models. The goal is to estimate a good pre-dictor of psychological tasks given a single brain image. Let the set X ∈ Rn×p represent brain images of p > 0 voxels. We then minimize the risk L(ˆy, y) with ˆ
y = f (X ˆw + ˆb), where f is a link function (e.g., sigmoid for logistic regression, identity for linear regression), and L usually represents an appropriate negative loglikelihood. We incorporate an informative prior through regularization:
ˆ
w, ˆb = argminw,bL(f (Xw + b), y) + λΩ(w),
where λ > 0 and Ω is the regularizer. Brain regions are defined as disjoint groups of voxels. Let G be a partition of {1, . . . , p}, i.e.
[
i
gi= {1, . . . , p} and gi∩ gj = ∅ ∀i 6= j
Brain networks consist of one or several brain regions. The set of brain networks H also forms a partition of {1, . . . , p} that is consistent with G in the sense that
∀g ∈ G, h ∈ H, either g ⊂ h or g ∩ h = ∅.
This allows for an unambiguous assignment of each region g ∈ G to one network h ∈ H and thus generates a tree structure. A root node is added to contain all voxels. For a brain image w ∈ Rp and a group g, the vector wg ∈ R|g| is
defined as the restriction of w to the coordinates in g. The penalty structured by network and region information can then be written as
Ω(w) = αX h∈H ηhkwhk2+ β X g∈G ηgkwgk2.
As originally recommended [21], we set ηg = 1/p|g| to account for discrepancy
in group sizes. The hierarchy-level-specific factors α > 0 and β > 0 can tradeoff region-weighted and network-weighted models against each other. Decreasing α leads to less penalization of brain networks and thus the tendency for fully active groups and dense brain maps. If at the same time β is increased to induce group sparsity, then only the structure of brain regions encoded by G is acknowledged. Conversely, if β is chosen sufficiently small and α increased, the detected struc-ture will derive from H, leading to the selection of brain networks rather than regions.
Please note that the above tradeoff enables predominance attributed to either brain regions or networks, although the penalty structure remains hierarchical. If the network penalty layer sets a network group to zero, then all the contained region groups are forced to have activity zero. Conversely, if a brain region has non-zero coefficients, then necessarily the network containing it must be active. This relation is asymmetric, the roles of G and H cannot be swapped: A brain region can set all its coefficients to zero without forcing the corresponding net-work to zero. A brain netnet-work can be active without its subregions being active. When evaluating the tradeoff in (α, β), this needs to be taken into account.
The prediction problem at hand is a multiclass classification. We choose to attack this using versus-rest scheme on a binary logistic regression. The one-versus-rest classification strategy is chosen to obtain one weight map per class for display and model diagnostics. Its loss can be written as
n
X
i=1
log(1 + exp(−yihxi, wi)) + λΩ(w),
if y ∈ {−1, 1} and with xi ∈ Rp the training sample brain images. We
opti-mize parameters w using an iterative forward-backward scheme analogous to the FISTA solver for the lasso [5].
2.3 Hyperparameter optimization
Stratified and shuffled training sets were repeatedly and randomly drawn from the whole dataset with preserved class balance and submitted to a nested cross-validation (CV) scheme for model selection and model assessment. In the inner CV layer, the logistic regression estimators have been trained in a one-versus-rest design that distinguishes each class from the respective 17 other classes (number of maximal iterations=100, tolerance=0.001). In the outer CV layer, grid search selected among candidates for the respective λ parameter by searching between 10−2 and 101 in 9 steps on a logarithmic scale. Importantly, the thus selected
sparse logistic regression classifier was evaluated on an identical test set in all analysis settings.
2.4 Implementation
All experiments were performed in Python. We used nilearn to process and resphape the extensive neuroimaging data [1], scikit-learn to design
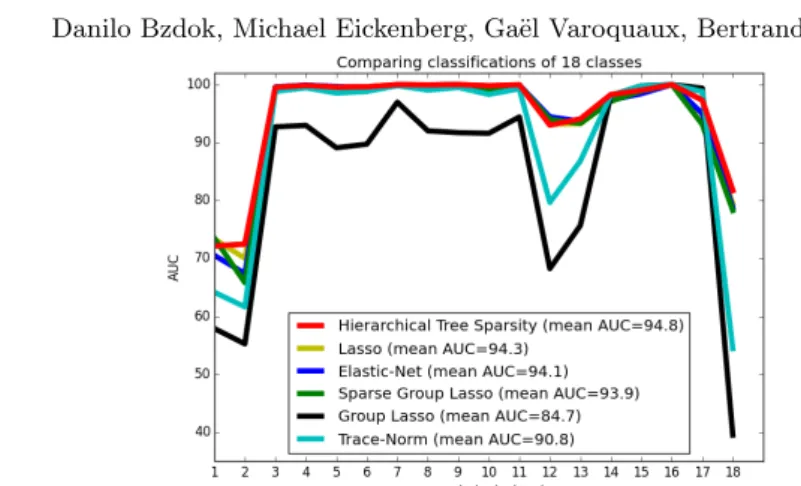
machine-Fig. 3. Prediction performance across sparsity priors. Comparing the perfor-mance of logistic regression estimators with 6 different structured and unstructered sparse regularization penalties (colors) in classifying neural activity from 18 psycho-logical tasks (cf. 7, Table 1). The area under the curve (AUC) is provided on an identical test set as class-wise measure (y-axis) and across-class mean (legend ). Simultaneous knowledge of both region and network neighborhoods was hence most beneficial for predicting tasks from neural activity.
learning data processing pipelines [16], and SPAMs for numerically optimized implementations of the sparse learners (http://spams-devel.gforge.inria. fr/). All Python scripts that generated the results are accessible online for reproducibility and reuse (http://github.com/banilo/ipmi2017).
2.5 Data
As the currently biggest open-access dataset in brain imaging, we chose brain data from the HCP [4]. Neuroimaging data with labels of ongoing psychological processes were drawn from 500 healthy HCP participants. 18 HCP tasks (cf. 7, Table 1) were selected that are known to elicit reliable neural activity across participants. The HCP data incorporated n = 8650 first-level activity maps from 18 diverse paradigms in a common 60 × 72 × 60 space of 3mm isotropic gray-matter voxels. Hence, the present analyses were based on task-labeled HCP maps of neural activity with p = 79,941 z-scored voxels.
3
Experimental Results
3.1 Benchmarking hierarchical tree sparsity against common sparse estimators
Hierarchical region-network priors have been systematically evaluated against other popular choices of sparse classification algorithms in an 18-class scenario (Figure 2.3). Logistic regression with `1/`2-block-norm penalization incorporated
a hierarchy of previously known region and network neighborhoods for a neu-robiological bias of the statistical estimation (α = 1, β = 1). Vanilla logistic regression with `1-penalization and `1-`2-elastic-net penalization do not assume
any previously known special structure. These classification estimators embrace a vision of neural activity structure that expects a minimum of topographically and functionally independent brain voxels to be relevant. Logistic regression with
corr = 0.32 corr = 0.27
corr = 0.17 corr = 0.20 corr = 0.23
corr = 0.18 corr = 0.17
corr = 0.11 corr = 0.13 corr = 0.16
St ru ct ur ed S pa rs ity N ai ve S pa rs ity 5/5 4/5 1/5 Data
Ratio 2/5 3/5 Class mean
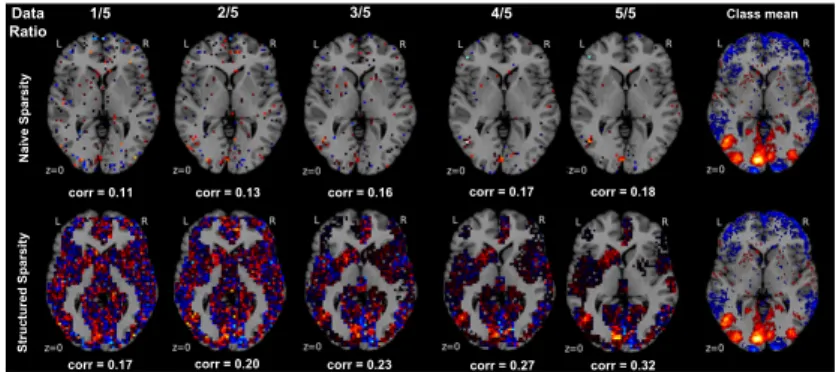
Fig. 4. Sample complexity in naive versus informed sparse model selection. Ordinary `1-penalized logistic regression (upper row ) is compared to
hierarchical-tree-penalized logistic regression (α = 1, β = 1, lower row ) with increasing fraction of the available training data to be fitted (left to right columns). For one example (i.e., “View tools”) from 18 psychological tasks (cf. 7, Table 1), unthresholded axial maps of recovered model weights are quantitatively compared against the sample average of that class (rightmost column, thresholded at the 75thpercentile). This notion of weight recovery was computed by Pearson correlation (corr). In the data-scarce scenario, ubiquitous in neuroimaging, hierarchical tree sparsity achieves much better support recovery. In the data-rich scenario, biologically informed logistic regression profits more from the available information quantities than biologically naive logistic regression.
(sparse) group sparsity imposes a structured `1/`2-block norm (with additional
`1term) with a known region atlas of voxel groups onto the statistical estimation
process. These supervised estimators shrink and select the coefficients of topo-graphically compact voxel groups expected to be relevant in unison. Logistic regression with trace-norm penalization imposed low-rank structure [10]. This supervised classification algorithm expected a minimum of unknown “network” patterns to be relevant.
Across experiments with stratified and shuffled cross-validation (90%/10% train/test set) across pooled participant data, hierarchial tree sparsity was most successful in distinguishing unseen neural activity maps from 18 psychological tasks (89.7% multi-class accuracy, mean AUC 0.948 [+/- 0.091 standard devia-tion] mean precision 0.87, mean recall 0.92). It was closely followed by logistic regression structured by trace-norm regularization (89.4%, mean AUC 0.908 [+/- 0.148], precision 0.86, recall 0.91). Lasso featured an average performance comparing to the other sparse estimators (88.6%, mean AUC 0.943 [+/- 0.093], precision 0.86, recall 0.90). Elastic-Net, in turn, featured an average performance comparing to the other sparse estimators (88.1%, mean AUC 0.941 [+/- 0.102], precision 0.85, recall 0.84). Introducing a-priori knowledge of brain region com-partments by sparse group sparsity (87.9%, mean AUC 0.939 [+/- 0.101], pre-cision 0.85, recall 0.90) and by group sparsity (87.9%, mean AUC 0.847 [+/-0.173], precision 0.85, recall 0.90) performed worst.
In an important subanalysis, the advantage of the combined region-network prior was confirmed by selectively zeroing either the ηg coefficients of all
re-gion groups or the ηhcoefficients of all network groups in the hierarchical prior.
Removing region structure from the sparsity penalty achieved 88.8% accuracy, while removing network structure from the sparsity penalty achieved 87.1% ac-curacy. These results from priors with impoverished a-priori structure were in-deed outperformed by the full region-network tree prior at 89.7% out-of-sample accuracy.
In sum, driving sparse model selection by domain knowledge of region-network hierarchies outcompeted all other frequently used sparse penalization techniques for high-dimensional data.
3.2 Sample complexity of naive versus informed sparse model selection
Subsequently, the sample complexity of `1-penalized and hierarchical-tree-penalized
logistic regression (α = 1, β = 1) was empirically evaluated and quantitatively compared (Figure 4). Region-network priors should constrain model selection towards more neurobiologically plausible classification estimators. This should yield better out-of-sample generalization and support recovery than neurobiology-naive `1-constrained logistic regression in the data-scarce and data-rich scenarios.
The HCP data with examples from 18 psychological tasks were first divided into 90% of training set (i.e., 7584 neural activity maps) and 10% of test set (i.e., 842 maps). Both learning algorithms were fitted based on the training set at different subsampling fractions: 20% (1516 neural activity maps), 40% (3033 maps), 60% (4550 maps), 80% (6067 maps), and 100% (7584 maps).
Regarding classification performance on the identical test set, `1-penalized
versus hierarchical-tree-penalized logistic regression achieved 83.6% versus 88.7% (20% of training data), 85.0% versus 89.2% (40%), 86.8% versus 89.8% (60%), 88.9% versus 90.3% (80%), 88.6% versus 89.7% (100%) accuracy. Regarding model sparsity, the measure s = ||w||1
||w||F was computed from the model weights w
of both penalized estimators for each of the 18 classes. The `1-penalized logistic
regression yielded the mean sparsities 50.0, 45.4, 40.0, 30.9, and 24.0 after model fitting with 20% to 100% training data. The hierarchical-tree-penalized logistic regression yield the sparsities 163.2, 160.2, 132.1, 116.2, and 88.4 after fitting 20% to 100% of the training data. To quantitative a measure of support recov-ery, we computed Pearson correlation r between vectors of the z-scored model coefficients and the z-scored across-participant average maps for each class. `1
-penalized versus hierarchical-tree--penalized logistic regression achieved a mean correlation r of 0.10 versus 0.13, 0.11 versus 0.13, 0.13 versus 0.17, 0.16 ver-sus 0.22, and 0.19 verver-sus 0.29 across classes based on 20% to 100% training data. Finally, regarding model variance, we quantified the agreement between `1-penalized versus hierarchical-tree-penalized model weights after fitting on 5
different 20%-subsamples of the training data. For each classifier, the absolute model weights were concatenated for all 18 classes, thresholded at 0.0001 to bi-narize variable selection, and mutual information was computed on all pairs of
the 5 trained models. This agreement metric of model selection across fold pairs yielded the means 0.001 (`1) versus 0.506 (hierarchical tree).
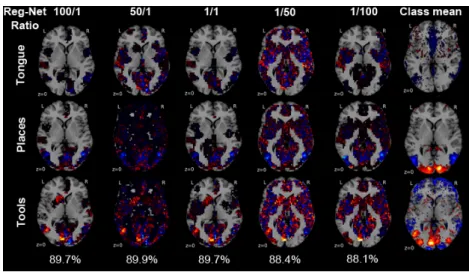
Fig. 5. Support recovery as a function of region and network emphasis. The relative strength of the region and network priors on the regularization is systemat-ically varied against each other (i.e., α and β are changed reciprocally). Horizontal brain slices are shown with the voxel-wise weights for each class from the fitted pre-dictive model. The region-network ratio (columns) weighted voxel groups to priviledge sparse models in function space that acknowledge known brain region neighborhoods (left columns) or known brain networks neighborhoods (right columns). Among the 18 classes (cf. 7, Table 1), the model weights are shown for 3 exemplary psychological tasks followed by participants lying in a brain imaging scanner (from top to bottom): tongue movement, viewing locations and tools. The 18-class out-of-sample accuracy bottom and the class-wise mean neural activity (rightmost column, thresholded at the 75th
percentile) are indicated. Different emphasis on regions versus networks in hierarchical structured sparsity can yield very similar out-of-sample generalization. Favoring region versus network structure during model selection recovers complementary, non-identical aspects of the neural activity pattern underlying the psychological tasks.
Three observations have been made. First, in the data-scarce scenario (i.e., 1/5 of available training data), hierarchical tree sparsity achieved the biggest ad-vantage in out-of-sample performance by 5.1% as well as better support recovery with weight maps already much closer to the respective class averages [20]. In the case of scarce training data, which is typical for the brain imaging domain, regularization by region-network priors thus allowed for more effective extraction of classification-relevant structure from the neural activity maps. Second, across
Table 1. Out-of-sample performance by region-network emphasis Reg-Net Ratio 100 50 10 5 2 1 1 2 1 5 1 10 1 50 1 100 Accuracy [%] 89.7 89.9 90.1 90.5 88.0 89.7 87.8 88.0 87.7 88.4 88.1
training data fractions, the weight maps from ordinary logistic regression ex-hibited higher variance and more zero coefficients than hierarchical tree logistic regression. Given the usually high multicollinearity in neuroimaging data, this
observation is likely to reflect instable selection of representative voxels among class-responsive groups due to the `1-norm penalization. Third, in the data-rich
scenario (i.e., entire training data used for model fitting), neurobiologically in-formed logistic regression profited much more from the increased information quantities than neurobiologically naive logistic regression. That is, the region-network priors actually further enhanced the support recovery in abundant input data. This was the case although the maximal classification performance of ≈90% has already been reached with small training data fractions by the structured es-timator. In contrast, the unstructured estimator approached this generalization performance only with bigger input data quantities.
3.3 Support recovery as a function of region-network emphasis Finally, the relative importance of the region and network group penalties within the hierarchical tree prior was quantified (Figure 5). The group weight ηg of
region priors was multiplied with a region-network ratio, while the group weight ηh of network priors was divided by that region-network ratio. For instance,
a region-network ratio of 3 increased the relative importance of known region structure by multiplying β = 3
1to ηgof all region group penalties and multiplying
α = 1
3 to ηh of all network group penalties (Table 1).
As the most important observation, a range between region-dominant and network-dominant structured penalties yielded quantitatively similar general-ization to new data but qualitatively different decision functions manifested in the weight maps (Figure 5, second and forth column). Classification models with many zero coefficients but high absolute coefficients in either region com-partments or network comcom-partments can similarly extrapolate to unseen neural activity maps. Second, these achieve classification performance comparable to equilibrated region-network priors that set less voxel coefficients to zero and spread the probability mass across the whole brain with lower absolute coeffi-cients (Figure 5, third column in the middle). Third, overly strong emphasis on either level of the hierarchical prior provides the neurobiologically informative results with maps of the most necessary region or network structure for sta-tistically significant generalization (Figure 5, leftmost and rightmost columns). In sum, stratifying the hierarchical tree penalty between region and network emphasis suggests that class-specific region-network tradeoffs enable more per-formant and more interpretable classification models for neuroimaging analyses [17].
4
Conclusion
Relevant structure in brain recordings has long been investigated according to two separate organizational principles: functional segregation into discrete brain regions [15] and functional integration by interregional brain networks [19]. Both organizational principles are however inextricable because a specialized brain region communicates input and output with other regions and a brain network
subserves complex function by orchestrating its region nodes. Hierarchical sta-tistical models hence suggest themselves as an underexploited opportunity for neuroimaging analysis. The present proof-of-concept study demonstrates the si-multaneous exploitation of both neurobiological compartments for sparse vari-able selection and high-dimensional prediction in an extensive reference dataset. Introducing existing domain knowledge into model selection allowed privileging members of the function space that are most neurobiologically plausible. This statistically and neurobiologically desirable simplification is shown to enhance model interpretability and generalization performance.
Our approach has important advantages over previous analysis strategies that rely on dimensionality reduction of the neuroimaging data to tackle the curse of dimensionality. They often resort to preliminary pooling functions based on region atlases or regression against network templates for subsequent supervised learning on the ensuing aggregated features. Such lossy approaches of feature engineering and subsequent inference i) can only satisfy either the specializa-tion or the integraspecializa-tion account of brain organizaspecializa-tion, ii) depend on the ground truth being either a region or network effect, and iii) cannot issue individual coefficients for every voxel of the brain. Hierarchical region-network sparsity ad-dresses these shortcomings by estimating individual voxel contributions while benefitting from their biological multi-level stratification to restrict statistical complexity. Viewed from the bias-variance tradeoff, our modification to logistic regression entailed a large decrease in model variance but only a modest increase in model bias.
In the future, region-network sparsity priors could be incorporated into var-ious pattern-learning methods applied in systems neuroscience. This includes supervised methods for whole-brain classification and regression in single- and multi-task learning settings. The principled regularization scheme could also in-form unsupervised structure-discovery by matrix factorization and clustering algorithms [13]. Additionally, hierarchical regularization could be extended from the spatial activity domain to priors of coherent spatiotemporal activity struc-ture. The deterministic choice of a region and network atlas could further be avoided by sparse selection of overcomplete region-network dictionaries. Ulti-mately, successful high-dimensional inference on brain scans is a prerequisite for predicting diagnosis, disease trajectories, and treatment response in personalized psychiatry and neurology.
References
1. Abraham, A., Pedregosa, F., Eickenberg, M., Gervais, P., Mueller, A., Kossaifi, J., Gramfort, A., Thirion, B., Varoquaux, G.: Machine learning for neuroimaging with scikit-learn. Front Neuroinform 8, 14 (2014)
2. Anderson, M.L., Kinnison, J., Pessoa, L.: Describing functional diversity of brain regions and brain networks. Neuroimage 73, 5058 (2013)
3. Bach, F., Jenatton, R., Mairal, J., Obozinski, G.: Optimization with sparsity-inducing penalties. Foundations and Trends in Machine Learning 4(1), 1–106 (2012)
4. Barch, D.M., Burgess, G.C., Harms, M.P., Petersen, S.E., Schlaggar, Feldt, C.: Function in the human connectome: task-fmri and individual differences in behav-ior. Neuroimage 80, 169–189 (2013)
5. Beck, A., Teboulle, M.: A fast iterative shrinkage-thresholding algorithm for linear inverse problems. SIAM journal on imaging sciences 2(1), 183–202 (2009) 6. Beckmann, C.F., DeLuca, M., Devlin, J.T., Smith, S.M.: Investigations into
resting-state connectivity using independent component analysis. Philos Trans R Soc Lond B Biol Sci 360(1457), 1001–13 (2005)
7. Bzdok, D., Eickenberg, M., Grisel, O., Thirion, B., Varoquaux, G.: Semi-supervised factored logistic regression for high-dimensional neuroimaging data. In: Advances in Neural Information Processing Systems. pp. 3330–3338 (2015)
8. Craddock, R.C., James, G.A., Holtzheimer, P. E., r., Hu, X.P., Mayberg, H.S.: A whole brain fmri atlas generated via spatially constrained spectral clustering. Hum Brain Mapp 33(8), 1914–28 (2012)
9. Doria, V., Beckmann, C.F., Arichia, T., Merchanta, N., Groppoa, M., Turkheimerb, F.E., Counsella, S.J., Murgasovad, M., Aljabard, P., Nunesa, R.G., Larkmana, D.J., Reese, G., Edwards, A.D.: Emergence of resting state networks in the preterm human brain. Proc Natl Acad Sci U S A 107(46), 20015–20020 (2010)
10. Harchaoui, Z., Douze, M., Paulin, M., Dudik, M., Malick, J.: Large-scale image classification with trace-norm regularization. In: Computer Vision and Pattern Recognition (CVPR), 2012 IEEE Conference on. pp. 3386–3393. IEEE (2012) 11. Iaria, G., Fox, C.J., Waite, C.T., Aharon, I., Barton, J.J.: The contribution of
the fusiform gyrus and superior temporal sulcus in processing facial attractiveness: neuropsychological and neuroimaging evidence. Neuroscience 155(2), 409–22 (2008) 12. Jenatton, R., Gramfort, A., Michel, V., Obozinski, G., Bach, F., Thirion, B.: Multi-scale mining of fmri data with hierarchical structured sparsity. SIAM Journal on Imaging Sciences 5(3), 835–856 (2012)
13. Jenatton, R., Obozinski, G., Bach, F.: Structured sparse principal component anal-ysis. arXiv preprint arXiv:0909.1440 (2009)
14. Kanwisher, N.: Functional specificity in the human brain: a window into the func-tional architecture of the mind. Proc Natl Acad Sci U S A 107(25), 11163–11170 (2010)
15. Passingham, R.E., Stephan, K.E., Kotter, R.: The anatomical basis of functional localization in the cortex. Nat Rev Neurosci 3(8), 606–16 (2002)
16. Pedregosa, F., Varoquaux, G., Gramfort, A., et al.: Scikit-learn: Machine learning in python. J Mach Learn Res 12, 2825–2830 (2011)
17. Sepulcre, J., Liu, H., Talukdar, T., Martincorena, I., Yeo, B.T.T., Buckner, R.L.: The organization of local and distant functional connectivity in the human brain. PLoS Comput Biol 6(6), e1000808 (2010)
18. Smith, S.M., Fox, P.T., Miller, K.L., Glahn, D.C., Fox, P.M., Mackay, C.E., Fil-ippini, N., Beckmann, C.F.: Correspondence of the brain’s functional architecture during activation and rest. Proc Natl Acad Sci U S A 106(31), 13040–5 (2009) 19. Sporns, O.: Contributions and challenges for network models in cognitive
neuro-science. Nat Neurosci 17(5), 652–60 (2014)
20. Varoquaux, G., Gramfort, A., Thirion, B.: Small-sample brain mapping: sparse recovery on spatially correlated designs with randomization and clustering. arXiv preprint arXiv:1206.6447 (2012)
21. Yuan, M., Lin, Y.: Model selection and estimation in regression with grouped variables. Philos Trans R Soc Lond B Biol Sci 68(1), 49–67 (2006)
22. Zeki, S.M.: Functional specialisation in the visual cortex of the rhesus monkey. Nature 274(5670), 423–428 (1978)