HAL Id: hal-03123411
https://hal.archives-ouvertes.fr/hal-03123411
Submitted on 28 Jan 2021
HAL is a multi-disciplinary open access
archive for the deposit and dissemination of
sci-entific research documents, whether they are
pub-lished or not. The documents may come from
teaching and research institutions in France or
abroad, or from public or private research centers.
L’archive ouverte pluridisciplinaire HAL, est
destinée au dépôt et à la diffusion de documents
scientifiques de niveau recherche, publiés ou non,
émanant des établissements d’enseignement et de
recherche français ou étrangers, des laboratoires
publics ou privés.
Possible changes of δ 18 O in precipitation caused by a
meltwater event in the North Atlantic
Martin Werner, Uwe Mikolajewicz, Georg Hoffmann, Martin Heimann
To cite this version:
Martin Werner, Uwe Mikolajewicz, Georg Hoffmann, Martin Heimann. Possible changes of δ 18 O in
precipitation caused by a meltwater event in the North Atlantic. Journal of Geophysical Research:
At-mospheres, American Geophysical Union, 2000, 105 (D8), pp.10161-10167. �10.1029/1999JD901196�.
�hal-03123411�
JOURNAL OF GEOPHYSICAL RESEARCH, VOL. 105, NO. D8, PAGES 10,161-10,167, APRIL 27, 2000
Possible
changes
of •180 in precipitation
caused
by a meltwater event in the North Atlantic
Martin Werner and Uwe Mikolajewicz
Max-Planck-Institute for Meteorology, Hamburg, Germany
Georg Hoffmann
Laboratoire des Sciences du Climat et de l'Environnement, Gif sur Yvette, France
Martin Heimann
Max-Planck-Institute for Biogeochemistry, Jena, Germany
Abstract. The Hamburg atmosphere
general
circulation
model ECHAM-4 is used to investigate
how
a meltwater
event
in the
North
Atlantic
might
alter
the signal
of stable
water
isotopes
(H2•80,
HDO) in precipitation.
Our results
show that such a meltwater event will cause
significant
changes
in the isotopic
composition
of the precipitation
over many parts of the Northern Hemi-
sphere,
but also in the tropical Atlantic region. Model simulations
suggest
that for such
a scenario
isotope
anomalies
are not only related
to temperature
changes,
but also to changes
in the season-
ality of precipitation
or the precipitation
amount.
A changed
isotopic
composition
of evaporating
ocean surface
waters (caused
by a massive
meltwater input into the North Atlantic) causes
tem-
perature-independent
isotope
anomalies,
too. Changes
of the deuterium
excess
are even more af-
fected by the imposed
oceanic
isotope
anomaly due to the nonlinearity
of the evaporation
process.
1. Introduction
One of the most puzzling problems of climate research is the question of the cause of the strong and rapid climate changes dur- ing the last 70,000 years known as Heinrich events, Dansgaard- Oeschger events, and the Younger Dryas. These events can be traced in paleorecords almost from the entire world, including the tropics [e.g., Brook et al., 1996; Curry and Oppo, 1997; dohnsen et al., 1992]. Two main hypotheses for their origin are currently discussed: One is a reduction of northward Atlantic heat transport due to a shutdown/reduction of North Atlantic Deep Water (NADW) formation triggered by strong meltwater/iceberg dis- charge from the European and/or North American ice shields [Stocker, 1998]. The other explanation claims that the cause for this variability lies in the tropics [Cane, 1998].
Most of our knowledge about these past climate changes is
based on proxy records like, for example, ice cores, pollen re-
cords, and marine sediment cores. From these proxy records, changes in, for example, temperature and precipitation are esti- mated. The required transfer functions are in general derived from present-day spatial variations of proxy (e.g., isotopes in ice cores) and physical quantities (e.g., temperature and precipita- tion). These transfer functions are often nonunique, and there is no guarantee that they are also appropriate for temporal varia- tions. However, this approach is widely used to compare esti- mates of past climate changes with the results of model sensitivity studies. In this paper we will use a different approach. Here we will show a simulation study that explicitly models the
cycling
of two stable
water
isotopes
(H2180,
HDO) in the hydro-
Copyright 2000 by the American Geophysical Union.
Paper number 1999JD901196.
0148-0227/00/1999JD901196509.00
logical
cycle. Modeling
of both H2180 and HDO enables
addi-
tional analyses
of the deuterium
excess
d (defined
as d = $D
-8(3•80),
a parameter
which
is related
to temperature
and/or
hu-
midity at the evaporation
site [dohnsen
et al., 1989;
Merlivat and
douzel, 1979]. Focusing on the simulation of a meltwater event
into
the Labrador
Sea,
we investigate
the following
questions:
(1)
In which
regions
can we detect
isotope
anomalies
in a colder
cli-
mate
forced
by a rapid
shutdown
of the NADW formation?
(2) Is
a changed
isotopic
composition
in precipitation
(usually
given
as
$•80
or $D)
always
coupled
to changed
surface
temperatures?
(3)
A massive
freshwater
input
with a strong
depletion
in heavy
iso-
topes
will alter the isotopic
ocean
surface
water composition
$•aOocea•
How
much
does
this
affect
the
$•80
signal
in precipita-
tion? (4) Will changes of the deuterium excess d reveal additionalinformation?
2. Model Experiments
Our results
are based
on three model experiments
using the
Hamburg atmosphere
general circulation model (AGCM)
ECHAM-4 in T30 mode
(spatial
resolution:
3.75 x 3.75 degrees).
Each experiment was run for 10 years in equilibrium state after a spinup time of 1 year. In the first experiment (hereinafter referred to as control run) both sea surface temperatures (SSTs) and
$•aOocean
were
set
to present-day
values.
For the other
two ex-
periments we prescribed colder SSTs. However, while the$•aOo•n
values
were still set to modem
values
in the second
ex-
periment,
we assumed
a changed
isotopic
composition
$•8Oo•n
in the third one. A comparison between the second and third ex- periment will enable us to clearly distinguish between the effects
of changed
SSTs
and additionally
changed
$•Oo• The pre-
scribed
monthly SST fields for all three experiments
were de-
rived from simulations
with the coupled ocean-atmosphere
general
circulation
model (OAGCM) ECHAM-3/LSG [Voss et
10,162
WERNER
ET AL.: CHANGES
OF $]80 BY MELTWATER
EVENT
(a)
90N 60N 30N EQ 30S 60S 90S 180 120W 60Wlift
0 60E 120E 180 b) 90N 60N 30N EQ30S
t
1806•)E
12;:)E 180
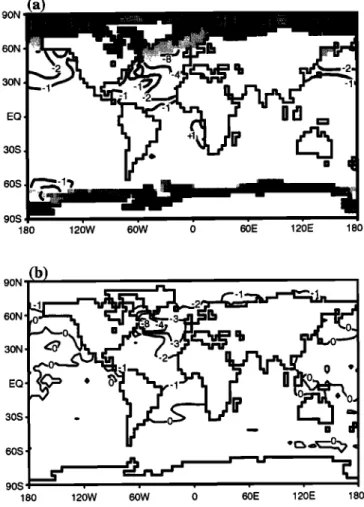
Figure 1. Differences
of the boundary
conditions
between
the
control and cold climate experiments: (a) mean anomalies of sea surface temperatures (SSTs) and sea ice (temperature contour lines at -1 ø C, -2 ø C, -4 ø C, -8 ø C, and - 16 ø C; heavily shaded area:
sea
ice prescribed
in both
climates
at least
half of the year,
lightly
shaded area: additional sea ice prescribed at least half of the year
for the cold climate),
(b) anomalies
of isotope
composition
of the
ocean
surface
water
$•8Ooc½an
(contour
lines at 0%0,
-1%o,
-29/oo,
-3%o,-4%o, and-89/oo).
al., 1998]. The ECHAM-3/LSG OAGCM was forced into a
colder
state
by a meltwater
spike
input into the Labrador
Sea with
a 500 year long triangle-shaped
time history
(maximum:
0.625
Sv) [Schiller
et al., 1997]. The meltwater
input led to a freshen-
ing of the North Atlantic
surface
waters,
thus
suppressing
deep
convection and the formation of NADW. As a consequence, the
thermohaline circulation of the Atlantic was weakened until the
end of the freshwater input. Poleward heat transport in the North
Atlantic was strongly
reduced,
leading
to a simulated
cooling
of
almost the entire Northern Hemisphere. We calculated monthly
mean SSTs of years
300 to 400 of an OAGCM control
run and
the OAGCM meltwater experiment to use as boundary conditions
for the isotope
control
and cold climate
experiments,
respectively
(Figure l a). For the cold climate scenario
with an additional
changed
$•8Ooc½an
field we used
results
of a GCM experiment
with an OGCM coupled
to an atmospheric
energy
balance
model
[Mikolajewicz,
1996]
which
included
the H2180
composition
of
ocean water. This model was forced with a meltwater spike, iden-
tical to the one in the OAGCM experiment mentioned above. Al-
though
not identical,
mean
SST changes
between
the control
and
cold climate
state
of this OGCM experiment
were similar
to the
coupled
OAGCM
simulations.
In this
experiment
a highly
ideal-
ized $]•O of seawater was included. We used the mean of the
$]aOo•ea•
changes
of years
300 to 400 of the OGCM experiment
as a prescribed
boundary
condition
for our third
isotope
experi-
ment
(Figure
lb). The pattern
that
is shown
is a combination
of
the $]•O of meltwater
and $•80 changes
of seawater
caused
by
changes
of the ocean
circulation.
The deuterium
excess
of ocean
surface water was set to zero in all our experiments. Such a d ex- cess value is valid for recent climate conditions but might be
slightly
higher
after a meltwater
event.
Meltwater
from the
Laurentian
ice shield
was probably
enriched
in the deuterium
ex-
cess.
Measurements
on the Dye3 core,
Greenland,
show d excess
values between 49/oo and 89/oo for different climate stages [Johnsen
et al., 1989].
Except
for SSTs
and
$]aOo•ea•We
did not change
any
other
boundary
condition
such
as topography,
ice shield
dis-
tribution,
or insolation,
which were all set to present-day
values
in the experiments.
We are fully aware
that
this
setup
does
not
represent
a realistic
simulation of the conditions occurring during a rapid climate
change
event.
Nevertheless,
the experiments
allow
an assessment
of the first-order
effects
in the isotopic
composition
of precipita-
tion after a meltwater-induced
rapid
Northern
Hemisphere
cool-
ing
event,
such
as
the
Younger
Dryas.
Since
most
other
boundary
conditions
will probably
have
remained
fairly constant
during
a
rapid
climate
change,
we believe
that
analyzing
the
anomalies
be-
tween
the different
model experiments
can reveal important
in-
formation.
3. Results
The mean
changes
of $280
in precipitation
between
the control
climate and the cold climate are shown in Figures 2a-2c. For fur-
ther
analyses
we have
split
the $]•O anomalies
into
two parts:
(1)
the $•O changes
caused
by colder
SSTs
alone
(Figure
2a), and
(2) additional
$]•O changes
in precipitation
for the colder
climate
caused
by the assumed
change
in $]8Oo•ean
(Figure
2b). Colder
SSTs
alone
affect
the $•aO
signal
over
the Atlantic
region,
Scan-
dinavia, and the western part of Europe (Figure 2a). The strongest isotope depletion (-8%o) can be observed over the northern Atlan- tic in the area of the Norwegian Sea, slightly east of the area of maximum cooling. Another minimum of isotope values is located over the northern Pacific region centered at the Bering Strait area associated with the prescribed cooling and the increased sea ice cover. This Pacific signal is much weaker than the Atlantic one but still shows a decrease of-4%o. A dipole-like pattern of isotope changes is found in the tropical Atlantic region between 30øN and 30øS. The positive branch (+2%o) is found north of the equator. It is mainly located over the ocean but extends into the northern part of South America. The negative branch (-4%o) is seen over
the Atlantic Ocean south of the equator. The additional anomalies
of $]80 in precipitation
induced
by changed
•18Oocean
values
of
the Atlantic
(Figure
2b) are very similar
to the •18Oocean
input
field (Figure lb). Although the extreme ocean water depletion of
-8%0 at the coast of Labrador is not reflected in the precipitation signal, the -29/oo and -1%o contour lines between forcing
(•18Oocean)
and
response
($]80 in precipitation)
are almost
identi-
cal, indicating a strong local control of the response signal. Over land surfaces, strongest depletion of-29/0o is found over western Europe and the Mediterranean region. Weaker anomalies of-1%0 to -2%o are also found above eastern Europe and Siberia, southern Greenland, the east coast of North America, west Africa, and al- most half of the South American continent. Combining both ef-
WERNER
ET AL.' CHANGES
OF •.i•So
BY MELTWATER EVENT
10,163
(a) 60N 30N EQ' 30S' 60S 180(b)
lift
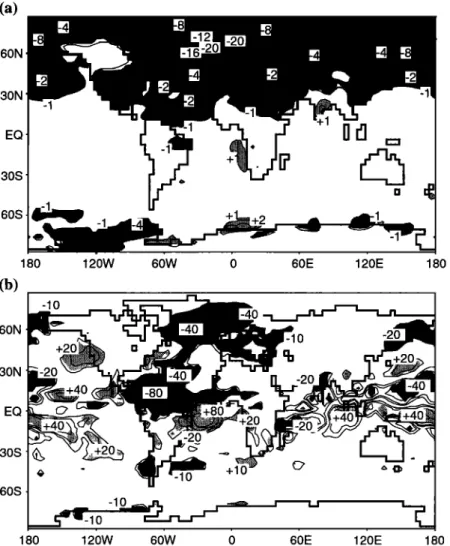
120W 60W 0 60E 120E 180Figures 3a-3c show the same sequence of anomalies for the deuterium excess. Three clear signals appear in the excess: (1) a local negative signal over the North Atlantic of the order of-1%0,
mainly due to the local temperature changes (see Figures 3a and
3c); (2) a quite strong positive signal over central and south Asia
with a maximum of +49/oo over Tibet due to the long-range cli-
mate changes caused by the meltwater induced lowering of the
North Atlantic SSTs (Figure 3a); and (3) a widespread positive
anomaly between + 19/oo and +29/oo over the high northern latitudes which is produced by the isotopic composition of the meltwater (see Figure 3b). The scattered excess signal over northern Africa is probably related to model deficits for areas with only a few rainfall events over a period of several years [Hoffmann et al., 1998]. 60N 30N EQ 30S 60S
lift ,=
180(c)
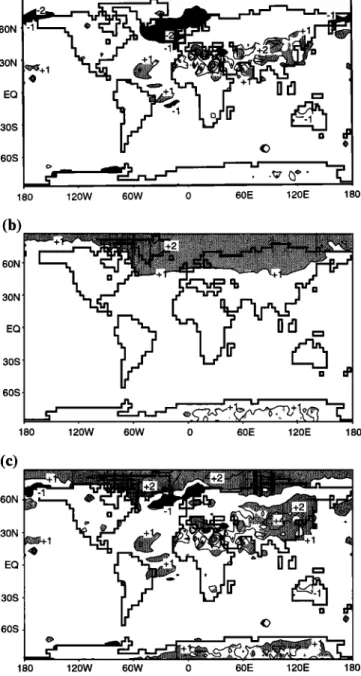
60N, 30N EQ 30S 60S 120W 60W 0 60E 120E 180 180 120W 60W 0 60E 120E 180Figure
2. (a) Changes
of the
$•80 values
in precipitation
of the
cold climate minus the control climate, if only SSTs are changedfor the cold
climate.
(b) Changes
of the $]80 values
in precipita-
tion for the cold climate
simulation
with both SST and •18Oocean
changed,
minus the cold climate simulation
with only SST
changed.
(c) Changes
of the $•80 values
in precipitation
of the
cold
climate
minus
the control
climate,
if both
SSTs
and
•18Oocean
are changed
for the cold climate.
Contour
lines in all three
plots
are at +19/oo,
+2%0,
+4%0,
and +8%0.
Significant
$•80 changes
(two-sided
u test, 95% level) are denoted
by light shading
(posi-
tive anomalies) and heavy shading (negative anomalies), respec-
tively.
feets
of changed
SSTs
and
changed
818Oocean
(Figure
2c) results
in an increased
change
in $]SO
over
central
Europe
and Siberia.
The
modeled
$•SO
changes
over
the Summit
region
of the Green-
land ice sheet are also slightly larger. The most striking differ-ence
is seen
in the tropical
Atlantic:
While the negative
$]80
anomaly south of the equator increased in size, the positive anomaly of +29/oo north of the equator almost completely van-
ishes. (a) 60N 30N EQ 30S 60S 180 120W 60W
(b)
60N 30N EQ 30S 60S +2lift ,=
0 60E 120E 180lift ,=
180 120W 60W 0 60E 120E 180 (c)60N
30N •'•+ 1
EQ 30S 60S 180Figure 3. The same as Figure 2, but for the changes of the deute- rium excess d (contour lines in all three plots at +19/oo, +2%0, and +49/oo; shading of significant anomalies as in Figures 2a-2c).
10,164 WERNER ET AL.: CHANGES OF 8180 BY MELTWATER EVENT (a) 60N 30N EQ 30S 60S
!]r'l
180(b)
-10 60N 30N -20120W
6•W
•)
&E
1;•OE
-20 180 EQ 30S 60S 180•i' •_10
•
12bW
60W
0
60E
12'0E
180
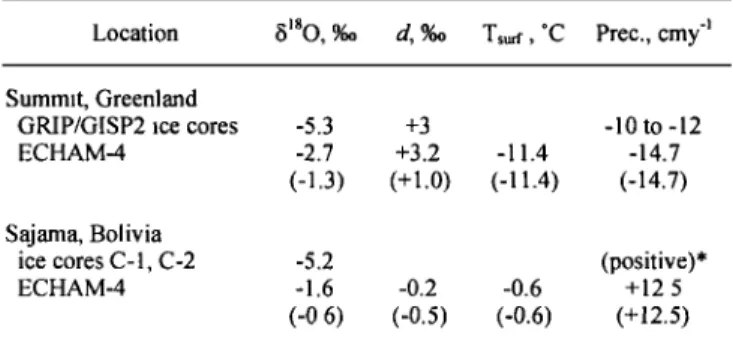
Figure 4. (a) Changes of surface temperature between the control and cold climate experiments. Contour lines are at ñIøC, +2øC,-4øC,-8øC,-12øC,-16øC, and-20øC. Significant temperature changes (two-sided u test, 95% level) are denoted by light shading (positive anomalies) and heavy shading (negative anomalies), respectively. (b) Same as
Figure
4a, but for the changed
amount
of precipitation.
Contour
lines
are
at + 10, +20, -40, -80 mm month-];
shading
of significant anomalies as in Figure 4a.
4. Discussion
To understand the modeled isotope anomalies, one has to con-
sider
the main influences
of the 81*O signal
in precipitation.
In
the extratropics,
under
a present-day
climate,
81*O
strongly
corre-
lates with surface temperatures ("temperature effect", observed
.mean
spatial
slope:
0.61%o
øC
'1 [International
Atomic
Energy
Agency (IAEA), 1992]). However, in tropical regions,
surface
temperatures are fairly constant over an annual cycle. There, the
8]*O signal
shows
in observations
a weak
negative
correlation
to
the amount of precipitation ("amount effect", observed mean
slope:
-1.3%o
(100cm)
-1 yr -1 [IAEA,
1992]).
In the cold climate experiments, surface temperatures are re-
duced in many land regions north of 30øN, except parts of Asia and Alaska (Figure 4a). Similar to the cold SST boundary condi- tions we find the strongest temperature drop (-20øC) in the area of the Greenland and Norwegian Sea over sea ice. Strong cooling
is also seen over the Greenland ice sheet (-8øC to -12øC) and the
Bering Strait (-8øC). The latter is directly correlated
to a mini-
mum in SSTs, too. The cooling in the northern Pacific is caused
by an intensified
wintertime
outflow of cold air from Siberia
[Mikolajewicz et al., 1997]. Cooling in the range of-2øC to-4øC
is observed over most parts of Europe, Siberia, and the east coast
of North America. Such colder temperatures above the North At-
lantic and Europe will reduce the amount of precipitation in
southern Greenland and over the Norwegian Sea and some parts
of the European continent (Figure 4b). However, an additional feature is that the Intertropical Convergence Zone (ITCZ) over
the Atlantic is strongly shifted to the southeast. We observe a di- pole-like change of the precipitation amount in the tropical Atlan-
tic region: North of the equator, precipitation is strongly reduced
(down
to -80 mm month
-1) in a band
from middle
America
to the
Sahel zone, while south of the equator precipitation amount in-
creases
(up to + 140 mm month-]).
A similar,
but weaker
shift
of
the ITCZ is observed in the Pacific, too. The dipole-like precipi-
tation anomaly in the tropical Atlantic is the reason for the very
similar
dipole-like
8]SO
anomaly
seen
in Figure
2a. In low lati-
tudes the amount effect dominates the isotope signal. Therefore lower precipitation amounts north of South America cause a rela- tive enrichment of heavy isotopes in precipitation. Conversely, more precipitation south of the equator is responsible for the
stronger
depletion
in H2180.
However,
the positive
branch
of this
pattern vanishes if we combine cooler SSTs and a changed
WERNER ET AL.: CHANGES OF $•aO BY MELTWATER EVENT 10,165
the changed
•18Oocea
n field counterbalances
the enrichment
in-
duced by the amount effect. As a result we see in Figure 2c a
strong
$•aO anomaly
only between
0 ø and 30øS,
but almost
no
counterpart north of the equator.
The relatively strong and spatially coherent reaction of the deuterium excess is an astonishing result of our simulation, in particular since the isotopic composition of the meltwater itself was prescribed with an excess of 0%o. As mentioned above, the
excess does not depend on the temperature gradient between the
evaporation
and condensation
site such
as $•aO and $D, but is
strongly affected by the isotopic disequilibrium during the evapo-
ration at the sea surface. A slow (rapid) evaporation process, that means low (high) evaporation temperatures and a high (low) rela- tive humidity, produces a small (large) deuterium excess [John- sen et al., 1989; Merlivat and douzel, 1979]. The direct impact of
lower SSTs, therefore, is a lower excess of about -2%o in the
North Atlantic and North Pacific where the imposed temperature anomalies are strongest. The interpretation of the positive signal
of up to +4%o over central and south Asia, however, is less straightforward. In our control simulation the highest excess val- ues (d > 14%o) were calculated in the very same region. This fea- ture was already reported in a former version of the model [Hoffmann et al., 1998] and is in good agreement with observa-
tions. Slight changes in the intensity of the monsoon or local pre- cipitation conditions might have played a role in this very sensitive region, but are not understood yet. The most widespread signal, however, is caused by the isotopic anomaly of the meltwa-
ter itself (Figure 3b). In fact, the evaporation process reacts non- linearly on the imposed changes of the water isotopes at the sea surface. Using the global evaporation model of Merlivat and Jouzel [1979], we estimated the change of deuterium excess of the vapor formed in the region of the meltwater Ad:
1 (1-- •D)
Ad=
8
•1 (1-
&80)
AS18Oocea
n
ASDocea
n
U,
180 ( 1 -- •'180
h)
U,
D ( l -- •'D
h)
with ct•8o and CtD as equilibrium fractionation factors [Majoube,
1971], k•8o and kD as the kinetic fractionation factors during
evaporation from the ocean [Merlivat andJouzel, 1979], h as the
relative
humidity
(estimated
80%) and AbDocean=8Ab18Oocean
as
the imposed change of the isotopic composition of seawater. In this simple calculation we estimate the average change in the
North
Atlantic
(north
of 30øN)
as A•18Oocean---3%
o. The resulting
change of the deuterium excess yields about +1.9%o, fairly close to the change of more than +1%o simulated by the ECHAM in northern high latitudes. These changes are of the same order of magnitude as present-day deuterium excess anomalies caused by a more realistic assumption of the deuterium excess values of seawater docean. It is well known that the present docea, value is not zero (as assumed for all our simulations) but can vary and is mostly negative in evaporative zones. If we assume docean values for the northern Atlantic in the range of-3%o to 1%o, we calculate by the given formula an excess value d of the vapor formed in that region of-2.7%o to 0.9%o. A possible change of Adocean be- tween the control and cold climate simulations (caused by the freshwater input) would result in an additional Ad anomaly in precipitation. However, to calculate these effects more quantita- tively, an isotope ocean-atmosphere coupled GCM with more re- alistic surface fluxes of $180 and d should be used.
As mentioned above, these model experiments represent a sen- sitivity study, and we do not expect an exact match with any ob- served isotopic composition changes during rapid cooling events in the past. However, given that our simulation captures some of
Table 1. Ice Core Data from Summit, Greenland, and Sajama, Bolivia, and Corresponding Model Results of the ECHAM-4 Simulations
Location •180, %0 d, %0 Tsurf, øC Prec., cmy q
Summit, Greenland
GRIP/GISP2 ice cores
ECHAM-4 Sajama, Bolivia ice cores C-1, C-2 ECHAM-4 -5.3 +3 -10 to -12 -2.7 +3.2 -11.4 -14.7 (-1.3) (+1.0) (-11.4) (-14.7) -5.2 (positive)* -1.6 -0.2 -0.6 +12.5 (-0.6) (-0.5) (-0.6) (+12.5)
Changes
in $•80 values,
deuterium
excess
d, surface
temperature
Tsu•f
and precipitation amount from the Younger Dryas stadial YD (or the de- glaciation climate reversal (DCR) in the Sajama record) minus early Holocene values are compared to model anomalies caused by changed
SSTs
and •180
.... boundary
conditions.
Model anomalies
caused
by
changed SSTs alone are given in parentheses. Ice core data were com- piled from Alley et al. [1993], Taylor et al. [1997], and Thompson et al. [1998]. GRIP denotes Greenland Ice Core Project, and GISP denotes Greenland Ice Sheet Project.
*Relative higher net accumulation during the cold climate of the DCR
was observed.
the atmospheric responses to a sudden cooling in the North Atlan- tic, the modeled isotope anomalies should at least be in the same direction and order of magnitude as available observations. A typical example of a rapid cooling event possibly caused by a meltwater spike in the North Atlantic might be the Younger Dryas climate reversal (about 12 kyr B.P.). It has been shown that several aspects of the OAGCM simulation, from which our SSTs were taken, agree well with observations of the Younger Dryas (YD) cooling [Mikolajewicz et al., 1997; Schiller et al., 1997]. The timing of this cold reversal has been studied in detail on sev- eral Greenland ice cores [e.g., Blurtlet et al., 1997; Severinghaus et al., 1998; Taylor et al., 1997]. Observed or estimated changes
of $•80, d excess,
surface
temperature,
and
precipitation
amount
at Summit, central Greenland, are listed in Table 1. The decreasein H2•80 in our model simulation is about half of the observed
value. However, modeled temperature anomalies are 3 times
greater
than
expected
from
$•80 anomalies
if the modem
(spatial)
isotope-temperature
gradient
of 0.67%o
øC
'• [Johnsen
et al., 1989]
is applied. Apparently, a lower (temporal) gradient has to be as- sumed for a cooling by a meltwater event. Such a lower gradient
has been reported by gas diffusion thermometry for the Younger
Dryas [Severinghaus et al., 1998] and also by borehole ther- mometry for the Last Glacial Maximum (LGM) [Cuffey et al., 1995; Dahl-Jensen et al., 1998; Johnsen et al., 1995]. The latest ECHAM-4 simulations under full glacial boundary conditions are able to reproduce the changed isotope-temperature relation. The deviation from the modem spatial gradient is explained by an in- creased seasonality of precipitation over Greenland during the LGM [Werner et al., 2000]. Less snowfall during winter season causes a bias of the mean $•80 values measured in ice cores to- ward the higher summer signal. Here, we do find a similar change in seasonality for the cold climate simulations (not shown). This confirms previous findings that decreased winter
precipitation
over
Greenland
is mainly
influenced
by cooler
SSTs
but not by other
glacial
boundary
conditions.
A rapid
decrease
of about
3%o
in the deuterium
excess
during
the transition
from
the YD to the Preboreal
has
been
reported
in
10,166
WERNER
ET AL.: CHANGES
OF 8180
BY MELTWATER
EVENT
the Dye3 core, southern Greenland [Dansgaard et al., 1989] and a similar value is measured on the GISP2 core [Taylor et al., 1997]. Dansgaard et al. interpreted this change as a redistribution
of source areas of Greenland's precipitation toward cold, high-
latitudinal regions. In their interpretation this redistribution was mainly caused by a dramatic retreat of the sea ice border at the end of the YD. Our results, however, imply that for the interpreta- tion of isotope records (and in particular of the deuterium excess) which stem from a region close to the meltwater input the iso- topic composition of the meltwater might play a very important
role, too.
The YD transition is also archived in different paleorecords in Europe. For example, isotope measurements in the calcite shells of freshwater ostracods from Lake Ammersee, Germany, allow
the quantitative
reconstruction
of the local
8•aOprec
signal.
They
show
a decrease
in 81SOptee
of 3-4%0
between
the
Preboreal
and
the YD [von Grafenstein
et al., 1999].
Using
the classical•80/T
interpretation
with a gradient
of 0.6%0
øC
'1 for Europe
results
in a
temperature difference of 5øC to 6.7øC for the YD. Our model
simulations, however, show only a minor cooling over Europe
the following
list of possible
effects
seen
in our sensitivity
study
should
be taken with some
caution.
Nevertheless,
it might help
lead to a better interpretation of paleorecords of fast climatic
changes:
A rapid cooling of the atmosphere by a meltwater spike in the
Labrador
Sea
causes
a clear
depletion
of H2180
in precipitation
in
most regions of the Northern Hemisphere poleward of 45øN. In general, the depletion of isotopes is related to a cooling of surface temperatures but is enhanced due to the lower surface ocean
isotopic composition.
Surface temperatures on the Greenland ice sheet are much
colder
than
expected
from
8180
values.
A change
in seasonality
of precipitation over Greenland results in a changed temperature- isotope relation. The use of the present-day spatial relation to convert isotope data into past temperatures seems questionable for fast climate changes recorded in Greenland ice core records (since temperature changes are underestimated).In the tropical Atlantic we also observe significant changes in the isotopic composition of precipitation. These changes are not
directly
related
to surface
temperature
but are related
to changes
(-2øC to -4øC). An additional anomaly of-2%0 over central of precipitation
amounts
induced
by a southeastward
shift of the
Europe
can
be related
to the changed
818Oocean
input.
A rapid cooling after the beginning of the last deglaciation pe- riod is also observed in two ice cores retrieved from the Andes [Thompson et al., 1995, 1998]. The well-dated Sajama record shows a deglaciation cold reversal (DCR) comparable to the YD signal observed in Greenland ice cores. However, the beginning of this reversal may have started about 1000 years before the on-
ITCZ.
A depletion of the isotopic composition of ocean surface wa-
ters
by a massive
meltwater
input
affects
the 8180
signal
in pre-
cipitation over most parts of Europe and the Mediterranean Sea, eastern parts of North America, and northern parts of South
America. This additional decrease will lead to an overestimation
of temperature shifts if these are calculated from present spatial
set
of the YD [Thompson
et al., 1998].
The possible
relevance
of 81SO-temperature
relations.
temperature shifts in the tropics for a global climate change is therefore one of the most interesting, but still unanswered, ques- tions. Although our model simulations agree qualitatively well with the Samaja record (Table 1), our findings in the Andes re- gion are highly uncertain. The orography of the Andes is poorly resolved in the spatial T30 resolution; for example, the grid box of the Sajama ice cap is only 2300 m above sea level (asl) (the ice cores were drilled at 6542 m asl). The main water vapor trans- ported to the Andes does originate from the tropical Atlantic and
the Amazon region [Grootes et al., 1989]. Therefore the dipole-
Changes
of the deuterium
excess
are even more affected
by
the imposed
oceanic
isotope
anomaly
due to the nonlinearity
of
the evaporation
process.
Similar
to H2180,
an interpretation
of
deuterium excess anomalies as changes in the surface tempera- tures and/or humidity at the evaporation site, solely, might yield
erroneous results. However, more realistic estimates of the deute-
rium excess anomalies of ocean surface water caused by a melt- water input are needed to evaluate the importance of the reported
nonlinearity effect.
like changes
in the 8180 signal
seen
in Figure
2 will definitely Acknowledgments.
We cordially
thank
Jean
Jouzel
and
Reinhard
Voss
have an imprint
on the isotope
composition
of precipitation
over for their
help
and
stimulating
discussions.
This
study
was
conducted
with
the
Andes.
However,
since
positive
and
negative
anomalies
are support
by the
European
Community
(ENV4-CT95-0130).
Computing
facilities were provided by the German Climate Computing Center
located
so
close
together,
it is
difficult
to
determine
how
the
8•SO
(DKRZ)
in
Hamburg.
signal on Sajama would be altered. it seems very likely, though,
that
changes
of the 81SO
signal
will be induced
by the amount
ef-
fect, and might not be strongly related to changes of the surface temperature.
The observed deuterium excess anomalies in india and Asia (Figure 3a) might be related to changes in the monsoon intensity during the deglaciation period [e.g., Zonneveld et al., 1997].
However, so far there exist no measurements of the deuterium
excess from any water isotope archive in this region for the
Younger Dryas or a similar cold climate period. Therefore a vali-
References
Alley, R.B., D.A. Meese, C.A. Shuman, A.J. Gow, K.C. Taylor, P.M. Grootes, J.W.C. White, M. Ram, E.D. Waddington, P.A. Mayewski,
and G.A. Zielinski, Abrupt increase in Greenland snow accumulation
at the end of the Younger Dryas event, Nature, 362, 527-529, 1993. Blunier, T., J. Schwander, B. Stauffer, T. Stocker, A. Dallenbach, A.
Indermuhle, J. Tschumi, J. Chappellaz, D. Raynaud, and J.M. Barnola, Timing of the Antarctic cold reversal and the atmospheric CO2 in- crease with respect to the Younger Dryas event, Geophys. Res. Lett.,
24(21), 2683-2686, 1997.
dation of the simulated d anomalies in the Asian region by obser- Brook, E.J., T.A. Sowers, and J. Orchardo, Rapid variations in atmos-
vations remains an open question.
5. Conclusions
Clearly,
the modeled
effects
of a meltwater
event
on the 8180
signal in precipitation strongly depend on the applied boundary
conditions.
Especially,
the effect
of a changed
818Oocean
field
might be reduced if the isotope depletion of the freshwater input
is weaker than assumed in the presented simulations. Therefore
pheric methane concentration during the past 110,000 years, Science,
273, 1087-1091, 1996.
Cane, M.A., Climate change - a role for the tropical Pacific, Science, 282,
59-61, 1998.
Cuffey, K.M., G.D. Clow, R.B. Alley, M. Stuiver, E.D. Waddington, and
R.W. Saltus, Large Arctic temperature change at the Wisconsin- Holocene glacial transition, Science, 270, 455-458, 1995.
Curry, W.B., and D.W. Oppo, Synchronous, high-frequency oscillations in tropical sea surface temperatures and North Atlantic Deep Water production during the last glacial cycle, Paleoceanography, 12, 1-14,
WERNER ET AL.: CHANGES OF $•80 BY MELTWATER EVENT 10,167
Dahl-Jensen, D., K. Mosegaard, N.S. Gundestrup, G.D. Clow, S.J. John- sen, A.W. Hansen, and N. Bailing, Past temperatures directly t¾om the
Greenland Ice Sheet, Science, 282, 268-27i, i998.
Dansgaard, W., J.W.C. White, and S.J. Johnsen, The abrupt termination of the Younger Dryas climate event, Nature, 339, 532-534, i989. Grootes, P.M., M. Stuiver, L.G. Thompson, and E. Mosley-Thompson,
Oxygen isotope changes in tropical ice, Quelccaya, Peru, d. Geophys.
Res.,94, 1i87-1i94, i989.
Hoffmann, G., M. Werner, and M. Helmann, The water isotope module of the ECHAM atmospheric general circulation model: A study on timescales from days to several years, d. Geophys. Res., 103, i6,87i-
i 6,896, 1998.
International Atomic Energy Agency (IAEA), Statistical treatment of data on environmental isotopes in precipitation, report, Vienna, i992. Johnsen, S.J., W. Dansgaard, and J.W.C. White, The origin of Arctic pre-
cipitation under present and glacial conditions, Tellus, 4lB, 452-468,
i989.
Johnsen, S.J., H.B. Clausen, W. Dansgaard, K. Fuhrer, N.S. Gundestrup,
C.U. Hammer, P. Iversen, J. Jouzel, B. Stauffer, and J.P. Steffensen,
Irregular glacial interstadials recorded in a new Greenland ice core,
Nature, 359, 3 i 1-3 i3, i992.
Johnsen, S.J., D. Dahl-Jensen, W. Dansgaard, and N.S. Gundestrup, Greenland paleotemperatures derived from GRIP bore hole tempera- ture and ice core isotope profiles, Tellus, 47B, 624-629, i995. Majoube, M., Fractionnement en oxygen i 8 et en deuterium entre l'eau et
sa vapeur, d. Chem. Phys., 10, i423-i436, i97i.
Merlivat, L., and J. Jouzel, Global climatic interpretation of the deute- rium-oxygen i 8 relationship for precipitation, d. Geophys. Res., 84,
5029-5033, i 979.
Mikolajewicz, U., A meltwater induced collapse of the "conveyor belt"
thermohaline circulation and its influence on the distribution of delta-
14C and delta-laO in the oceans, report, Max-Planck-Inst. for Mete-
orol., Hamburg, Germany, i996.
Mikolajewicz, U., T.J. Crowley, A. Schiller, and R. Voss, Modelling tele- connections between the North Atlantic and North Pacific during the Younger Dryas, Nature, 387, 384-387, 1997.
Schiller, A., U. Mikolajewicz, and R. Voss, The stability of the North At- lantic thermohaline circulation in a coupled ocean-atmosphere general circulation model, Clim. Dyn., 13(5), 325-347, 1997.
Severinghaus, J.P., T.A. Sowers, E.J. Brook, R.B. Alley, and M.L. Bender, Timing of abrupt climate change at the end of the Younger
Dryas interval from thermally fractionated gases in polar ice, Nature,
39i, i4i-i46, i998.
Stocker, T.F., Climate change - the seesaw effect, Science, 282, 61-62,
i998.
Taylor, K.C., et al., The Holocene Younger Dryas transition recorded at
Summit, Greenland, Science, 278, 825-827, 1997.
Thompson, L.G., E. Mosley-Thompson, M.E. Davis, P.N. Lin, K.A. Henderson, J. Coledai, J.F. Bolzan, and K.B. Liu, Late glacial stage and Holocene tropical ice core records from Huascaran, Peru, Science,
269, 46-50, 1995.
Thompson, L.G., et al., A 25,000-year tropical climate history from Bo-
livian ice cores, Science, 282, 1858-i864, i998.
yon Grafenstein, U., H. Erlenkeuser, A. Brauer, J. Jouzel, and S.J. John-
sen, A mid-European decadal isotope-climate record from i5,500 to 5000 years B.P., Science, 284, i654-1657, i999.
Voss, R., R. Sausen, and U. Cubasch, Periodically synchronously coupled integrations with the atmosphere-ocean general circulation model ECHAM-3/LSG, Clint. Dyn., 14(4), 249-266, i998.
Werner, M., U. Mikolajewicz, M. Heimann, and G. Hoffmann, Borehole versus isotope temperatures on Greenland: Seasonality does matter, Geophys. Res. Lett., 27, 723-726, 2000.
Zonneveld, K.A.F., G. Ganssen, S. Troelstra, G.J.M. Versteegh, and H. Visscher, Mechanisms forcing abrupt fluctuations of the Indian Ocean summer monsoon during the last deglaciation, Quat. Sci. Rev., 16(2),
i 87-20 i, i 997.
M. Heimann, Max-Planck-Institute for Biogeochemistry, P.O. Box 100164, D-07701 Jena, Germany.
G. Hoffmann, Laboratorie des Sciences du Ciimat et de l'Environnements, Centre d'Etudes Orme des Merisiers, F-91191 Gif sur Yvette, France.
U. Mikolajewicz and M. Werner, Max-Planck-Institute for Meteorology, Bundesstrasse 55, D-20146 Hamburg, Germany. (werner@ dkrz.de)
(Received July 20, 1999; revised December 2, 1999; accepted December 13, 1999.)