HAL Id: inria-00312039
https://hal.inria.fr/inria-00312039
Submitted on 25 Aug 2008
HAL is a multi-disciplinary open access
archive for the deposit and dissemination of
sci-entific research documents, whether they are
pub-lished or not. The documents may come from
teaching and research institutions in France or
abroad, or from public or private research centers.
L’archive ouverte pluridisciplinaire HAL, est
destinée au dépôt et à la diffusion de documents
scientifiques de niveau recherche, publiés ou non,
émanant des établissements d’enseignement et de
recherche français ou étrangers, des laboratoires
publics ou privés.
Brian Amedro, Vladimir Bodnartchouk, Denis Caromel, Christian Delbe,
Fabrice Huet, Guillermo Taboada
To cite this version:
Brian Amedro, Vladimir Bodnartchouk, Denis Caromel, Christian Delbe, Fabrice Huet, et al.. Current
State of Java for HPC. [Technical Report] RT-0353, INRIA. 2008, pp.26. �inria-00312039�
a p p o r t
t e c h n i q u e
0249-0803 ISRN INRIA/R T--0353--FR+ENG Thème COMCurrent State of Java for HPC
Brian Amedro — Vladimir Bodnartchouk — Denis Caromel
Christian Delbé — Fabrice Huet — Guillermo L. Taboada
N° 0353
Centre de recherche INRIA Sophia Antipolis – Méditerranée
Brian Amedro
∗, Vladimir Bodnartchouk
†, Denis Caromel
∗Christian Delb´e
†, Fabrice Huet
∗, Guillermo L. Taboada
‡ Th`eme COM — Syst`emes communicants´Equipes-Projets Oasis
Rapport technique n° 0353 — August 2008 — 23 pages
Abstract: About ten years after the Java Grande effort, this paper aims at providing a snapshot of the current status of Java for High Performance Computing. Multi-core chips are becoming mainstream, offering many ways for a Java Virtual Machine (JVM) to take advantage of such systems for critical tasks such as Just-In-Time compilation or Garbage Collection. We first perform some micro benchmarks for various JVMs, showing the overall good performance for basic arithmetic operations. Then we study a Java implementation of the Nas Parallel Benchmarks, using the ProActive middleware for distribution. Comparing this implementation with a Fortran/MPI one, we show that they have similar performance on computation intensive benchmarks, but still have scalability issues when performing intensive communications. Using experiments on clusters and multi-core machines, we show that the performance varies greatly, depend-ing on the Java Virtual Machine used (version and vendor) and the kind of computation performed.
Key-words: Benchmark, Java, Fortran, HPC, ProActive, MPI
These Research & Developments were conducted in partnership between INRIA and the Open Source company ActiveEon
∗INRIA Sophia Antipolis – CNRS – I3S – UNSA, [email protected] †ActiveEon, [email protected]
R´esum´e : Cet article se propose de faire un ´etat de l’art de Java pour le calcul haute performance. Pour une machine virtuelle Java, les nouveaux processeurs multi-coeurs sont une opportunit´e pour g´erer des tˆaches critiques comme la compilation `a la vol´ee ou les op´erations du ramasse-miettes. Nous effectuons dans un premier temps des micro-benchmarks pour diff´erentes versions et impl´ementations d’une JVM. Ceci nous permettant de mettre en evidence les bonnes performances de Java pour les op´erations arithm´etiques simples. Nous ´etudions ensuite une impl´ementation Java des Nas Parallel Benchmarks avec l’intergiciel ProActive pour la distribution. En effectuant des compa-raisons avec la version Fortran/MPI, nous verrons que les performances sont similaires pour les applications de calcul intensif, mais qu’il y a toujours quelques probl`emes de passage `a l’´echelle pour les applications fortement communicantes.
1
INTRODUCTION
In the world of high performance computing, MPI holds a place of leader. This li-brary proposes many low-level primitives and the message-passing model on which it is based has proved its value in terms of performance. But for several years, the ten-dency has been to look for productivity, and to propose efficient higher level primitives like collective operations [GOR 04].
Following this trend, the ProActive library is a high level Java middleware based on the concept of active objects. They are remote objects accessible through asynchronous procedure calls. The library also provides large scale deployment facilities, abstracted away from the source code. Different programming paradigms are provided, such as OO-SPMD1, allowing the rapid building and deployment of distributed computational
applications. The underlying benefit of Java frees the developer from the architectural heterogeneities of Grids. The drawbacks of Java are also well known, in particular its notorious low performance. However, little attention has been dedicated to the current state of Java, especially when considering new architectures, like multi-core machines, and new Java Virtual Machines.
In order to perform an evaluation of Java for HPC, we have implemented the NAS2
Parallel Benchmarks(NPB) which are a standard in distributed scientific computation.
Many middleware comparatives are usually based on them. They have the advantages to test a large set of aspects of a system, from pure computation performance to com-munication speed.
By using a Java-based middleware, instead of Fortran+MPI, we want to demon-strate the performance which can be obtained, and compare it to an equivalent native version. Our aim is to identify the areas where Java still lacks some performance, in particular the network layer.
The rest of this paper is organized as follows. Section 2 gives some background: a short description about the benchmarks used in our experiments, the ProActive library (in particular the active object model), and the Java Fast Sockets[TAB 06] we used for some experiments on an SCI3cluster. Section 3 presents some related work. Section 4
presents the result of arithmetic benchmarks on multiple JVMs. In section 5, we present the results obtained with the NAS Parallel Benchmarks on two network architectures. Finally, we discuss, in section 6, the impact of garbage collection and then conclude the paper.
2
BACKGROUND
This section presents the context and tools used in our study.
2.1
The NAS Parallel Benchmarks
NAS Parallel Benchmarks (NPB) [BAI 94] consists of a set of kernels which are de-rived from computational fluid dynamics (CFD) applications. They were designed by the NASA Ames Research Center and test different aspects of a system.
Some are testing pure computation performance with different kinds of problems like matrix computation or FFTs. Others involve a high memory usage, or network
1Object Oriented - Single Program Multiple Data 2Numerical Aerodynamic Simulation
speed with large data size communications. Finally, some problems try to evaluate the impact of irregular latencies between processors (short or long distance communi-cations). Each of these five kernels was designed to test a particular subset of these aspects.
To follow the evolution of computer performance, the NPB were designed with several classes of problems making kernels harder to compute by modifying the size of data and/or the number of iterations.
There are now 6 classes of problems: S, W, A, B, C and D. Class S is the easiest problem and is for testing purpose only. Class D is the hardest and usually requires a lot of memory.
In this paper we will use the CG, MG, IS, FT and EP kernels with the problem classes S and C. Indeed, we thought it would be interesting to study the behaviour with very small data (S), and with large data (C).
2.2
The ProActive library
ProActive is a GRID middleware (a Java library with open source code under LGPL license) for parallel, distributed, and concurrent computing in a uniform framework. With a reduced set of simple primitives, ProActive provides a comprehensive API to simplify the programming of Grid Computing applications: distributed on Local Area Network (LAN), on clusters of workstations, or on Internet Grids.
ProActive is only made of standard Java classes, and requires no changes to the Java Virtual Machine, no preprocessing or compiler modification; programmers write standard Java code. Based on a simple Meta-Object Protocol, the library is itself exten-sible, making the system open for adaptations and optimizations. ProActive currently uses the RMI4Java standard library as default portable transport layer.
The active object is the base entity of a ProActive application. It is a standard Java object which has its own thread. An active object can be created on any host used for the application deployment. Its activity and localization (local or distant) are completely transparent. Asynchronous requests are sent to an active object. These requests are stored in the active object’s request queue before being served according to a service policy. By default, this service policy is FIFO, but the user can create its own. A future object is a place holder for the asynchronous request result with a
wait-by-necessitymechanism for synchronization. Some requests can be invoked as immediate services: these requests will be served in parallel of the main thread and
other immediate services. For further details about ProActive, the reader can refer to [BAD 06].
The MPI implementation of the NPB are based on the SPMD paradigm. The ProActive library provides an Object-Oriented SPMD layer which is based on the no-tion of typed groups [BAD 02]. Thus, a request or a collective operano-tion can be per-formed on an OO SPMD group. Also, as this model is Object-Oriented, we keep all the benefits of the typed approach.
2.2.1 Exchange operator
Due to its main concepts, ProActive is not able to translate directly some constructions which are frequently used with MPI, like the irecv() / send() / wait() sequence. With MPI, this sequence offers a way to exchange potentially a very large amount of data
between 2 processes, making an implicit synchronization. With ProActive, the asyn-chronous request service mechanism is not really adapted to such task and should lead to some dead-locks, involving, in addition to an explicit synchronization, to make a copy of data to exchange (received data will first be copied into a request which will be served later).
In order to avoid unnecessary copying of data, we take advantage of the serializa-tion step of a request, through a special exchange operator. It allows two ProActive processes to exchange data efficiently. The two processes will invoke the exchange operator in order to exchange data with each other. It is equivalent to a pair of irecv() /
send() / wait()calls by those two processes. Hence, the ProActive call:
exchange(tag, destRank, srcArray, srcOffset, destArray, destOffset, len)
is equivalent to the MPI sequence:
mpi_irecv(dest_array, len, data_type, dest_rank, tag, mpi_comm_world, req)
mpi_send(src_array, len, data_type, dest_rank, tag, mpi_comm_world)
mpi_wait(req, status, ierr)
Figure 1: Data exchange operation between 2 Active Objects in ProActive Figure 1 explains the inner working of the operator: In this example, two active objects (AOs) are exchanging a subset of an array using the exchange operator, which works like a 2-way array copy. Thus, both AOs creates a RequestExchange object containing the details of the source and destination arrays (ie. array pointers, offsets and length). Then, each AO sends its RequestExchange object to the other one, per-forming an implicit synchronization when serializing and de-serializing data. Indeed, the serialized data are directly read in the source array without any intermediate copy. In the same way, de-serialized data are directly put in the destination array without any intermediate copy.
Moreover the Exchange does not work exclusively with arrays of primitives, but also with any complex data structure which implements the java.util.Collection in-terface.
2.3
High Performance Java Sockets Support in ProActive
As the use of Java RMI as transport layer in Proactive has an important impact on performance, it has been considered the substitution of the current RMI transport pro-tocol by a more efficient one. The RMI transport overhead can be reduced through the use of a high performance Java sockets implementation named Java Fast Sockets (JFS)[TAB 06]. JFS provides high performance network support for Java (currently direct Scalable Coherent Interface –SCI– support). It also increases communication performance avoiding unnecessary copies and buffering, by reducing the cost of prim-itive data type array serialization, the process of transforming the arrays in streams to send across the network. Most of these optimizations are based on the use of native methods as they obtain higher performance. On SCI, JFS makes JNI calls to SCI Sock-ets, SCILib and SISCI, three native communication libraries on SCI. JFS increases communication throughput looking for the most efficient underlying communication library in every situation. Moreover, it is portable because it implements a general “pure” Java solution over which JFS communications can rely on absence of native communication libraries. The “pure” Java approach usually leads in the lowest per-formance, but the stability and security of the application (associated tradeoffs for the higher performance of the native approach) is not compromised. The transparency to the user is achieved through Java reflection: the Factory for creating Sockets can be set at application startup to the JFS SocketImplFactory, and from then on, all sockets communications will use JFS. This process can be done in a small Java application launcher that will call the target Java application. This feature allows any Java appli-cation, and in this particular case ProActive middleware, to use JFS transparently and without any source code modification.
3
RELATED WORK
Studies of Java for High Performance Computing can be traced back to the JavaGrande Forum community effort[PHI 01]. The results, at that time, were disappointing and gave Java a bad reputation. However, the benchmarks written at that time are still available and useful to perform basic performance measurement of JVMs. Since then, only a few works have been dedicated to this task, although the technology behind the Java Virtual Machines and the computer architecture have changed a lot over the years. A notorious performance hit was the garbage collector, because of the pauses it intro-duced. Nowadays, all JVMs come with multiple garbage collectors implementation which can be chosen at startime [SUN , BEA , IBM ]. Multi-core CPUs are now main-stream and might change fundamentally the performance of Java. Indeed, a JVM is multi-threaded and can take advantage of multiple cores to perform background tasks like memory managment or Just-In-Time compilation.
The first result is the impressive work performed around the DaCapo Benchmarks [BLA 06]. The authors defines a set of benchmarks and methodologies meaningful for evaluating the performance of Java. As noted by the authors, Java introduces complex interactions between the architecture, the compiler, the virtual machine and the mem-ory management through garbage collectors. As such, using benchmarks and method-ologies developed for Fortran/C/C++ might put Java at a disadvantage.
In [CAO 05] the authors study the performance scaling of multithreaded Java with the number of processors on an SMP machine. Their finding is that the memory stalls are introduced by L2 cache misses and that they increase with the number of threads
and the number of processors. However, the authors do not indicate wether these stalls have a visible impact at user level. Our work is different from the previous one in that it focuses on a set of well known benchmarks which were not designed with Java in mind. Nonetheless, they correspond to plausible computations and such,produce meaningful results.
4
ARITHMETIC BENCHMARKS
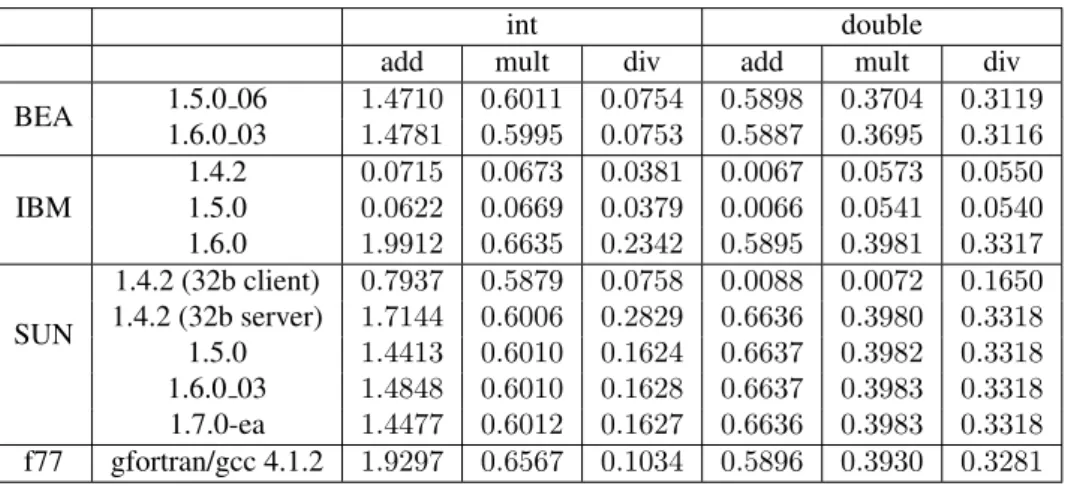
In this section we present the results of basic Java benchmarks. The aim is to give an overview of the behavior of different virtual machines on the same multi-core archi-tecture. The experimental platform was an 8 core machine (Dual Xeon E5335@2Ghz) running a 2.6.23 Linux kernel. The benchmarking software was the JavaGrande se-quential benchmark suite [FOR ]. Among all results available from these benchmarks, we present in table 1 those which might have the most important impact on the NAS benchmarks, i.e integer and double arithmetic. The benchmarks measure the number of basic operations (addition, multiplication, division) which can be performed over a long period of time and compute an average number of operations. During these bench-marks, no allocation is performed on the heap, limiting the influence of the garbage collector. This simple benchmark essentially tests the Just-In-Time compiler and its ability to quickly produce compiled code. Special care is taken to avoid dead-code re-moval. For the sake of comparison, we also present the result of the same experiment written in Fortran, using the gcc compiler.
We have tested the 64bits version of the JVMs from the following vendors : BEA (version 5 and 6), IBM(version 5 and 6) and Sun (version 5, 6 and 7 beta). In addi-tion, we have added some Java4 JVMs as they are still widely used. Unless specified, all benchmarks were run in server mode (higher resource usage at start-up and more aggressive JIT).
int double
add mult div add mult div
BEA 1.5.0 061.6.0 03 11.4710 0.6011 0.0754 0.5898 0.3704 0.3119 .4781 0.5995 0.0753 0.5887 0.3695 0.3116 IBM 1.4.2 0.0715 0.0673 0.0381 0.0067 0.0573 0.0550 1.5.0 0.0622 0.0669 0.0379 0.0066 0.0541 0.0540 1.6.0 1.9912 0.6635 0.2342 0.5895 0.3981 0.3317 SUN 1.4.2 (32b client) 0.7937 0.5879 0.0758 0.0088 0.0072 0.1650 1.4.2 (32b server) 1.7144 0.6006 0.2829 0.6636 0.3980 0.3318 1.5.0 1.4413 0.6010 0.1624 0.6637 0.3982 0.3318 1.6.0 03 1.4848 0.6010 0.1628 0.6637 0.3983 0.3318 1.7.0-ea 1.4477 0.6012 0.1627 0.6636 0.3983 0.3318 f77 gfortran/gcc 4.1.2 1.9297 0.6567 0.1034 0.5896 0.3930 0.3281
Table 1: JavaGrande benchmarks result in 109
operation.s−1
The JVMs from BEA have a low score for integer division and there is no visible improvement between version 5 and version 6.
The IBM’s JVMs have some overall low performance for versions prior to 1.6.0. However, the latest version has a very high score for integer addition and division. Finally, Sun’s JVMs were among the fastest in our benchmarks. There was a visible
difference between client and server mode, especially on double arithmetic. There is, however, no improvement between different versions.
Overall, the results are very close to those of an equivalent Fortran code.
5
NAS PARALLEL BENCHMARKS
As they are derived from algorithm which are frequently used in high performance computing, we have decided to run the Nas Parallel Benchmarks (NPB) to study the behavior of various JVMs with the ProActive middleware for distribution, and compare them to the original Fortran MPI implementation. The following section is divided as follows. We first present the execution time of the NPB for various JVMs and environmental testbeds. Then, we analyze the impact of garbage collection.
5.1
Experimentation methodology
We first divide the five kernels in two categories. If the kernel performs many calls with a particular communication scheme, we define it as a communication intensive one, otherwise, it is a computation intensive one. Regarding the former, we have first performed an analysis of their logical topology to understand the data movements char-acteristics involved in them.
Following this study, each kernel was run varying different parameters:
• the JVM version and vendor: BEA (5 and 6), IBM (5 and 6) and Sun (5, 6 and 7),
• the initial and maximum heapsize of the JVM, • the number of nodes used (from 1 to 32), • the kernel problem class size (class S or C)
• the network architecture: Gigabit Ethernet (GBE) with ProActive over RMI and Scalable Common Interface (SCI) with ProActive over JFS.
Some values or combinations had no impact on the runing of the NPBs and are not presented in the remaining of the paper.
The NPB ProActive implementation we have made is based on the NPB 3.2 version distributed by NASA. The Fortran MPI version was compiled with the 64 bits PGI 7.1 compiler (with -O3 option) and run onto a MPICH 2 message-passing implementation.
All the presented values are the average of five runs. To perform our tests, we have used three clusters :
• For our Gigabit Ethernet tests, we used a Sun Fire X2200 M2 cluster composed of 50 nodes Quad Core AMD Opteron 2218 (2.6GHz / 1MB / 667MHz), with 4 GBytes of memory. All the nodes are running on a Red Hat Enterprise Linux 5 with a Linux 2.6.18 kernel and are connected to 4 Cisco-3750 switches (gigabit ethernet). The switches are interconnected using a 32Gbps stack.
• A SCI cluster testbed consisting of eight nodes, with two dual-core processors per node (Intel Xeon Dual Core 5060 at 3.2 GHz) and 4GB of memory. The SCI NIC is a D334 card plugged into a 64bits/66MHz PCI slot. The OS is Linux CentOS 4.2.
• Regarding our memory usage tests presented in Section 5.4, we used a 8 nodes cluster. Each node contains two Quad Core Xeon E5335 (2.0GHz / 2*4MB / 1333MHz) with 16GB of memory. Each node runs a 2.6.23 Linux kernel. Experimental results from running NAS Parallel Benchmarks using JFS and their counterpart native MPI/PGI versions have been obtained on a commodity SCI cluster. As the cluster is limited to 8 nodes, where each node has 4 cores (dual nodes with dual-core processors), the experiments have been run using one process per node (single process configuration) and using four processes per node (quad process configuration). The transport protocol for ProActive on the SCI cluster is JFS, which achieves a latency of 6 microseconds and an asymptotic throughput of 2398 Mbps. The native MPI library presents a latency of 4 microseconds and an asymptotic throughput of 2613 Mbps. Thus, this high-performance interconnect cluster can achieve significantly higher performance scalability.
In fact, although the computational power of the SCI cluster is smaller as illustrated by the EP Kernel, which tests only “pure” computational power, its global parallel per-formance is higher, when setting the number of processes to only one worker per node. This illlustrates the communication layer scalability. In some cases the performance shown by the whole SCI cluster is similar or even higher than the GbE cluster (8 nodes vs. 64 nodes), as it can be seen in the native results for CG and IS, and in the ProActive results for CG and MG.
5.2
Computation Intensive Applications
Computation intensive applications can be characterized by a strong integer or float arithmetic, or by complex array manipulation. The Fourier Transformation (FT), Inte-ger Sort (IS) and Embarrassingly Parallel (EP) kernels are such applications.
5.2.1 Fourier Transformation kernel
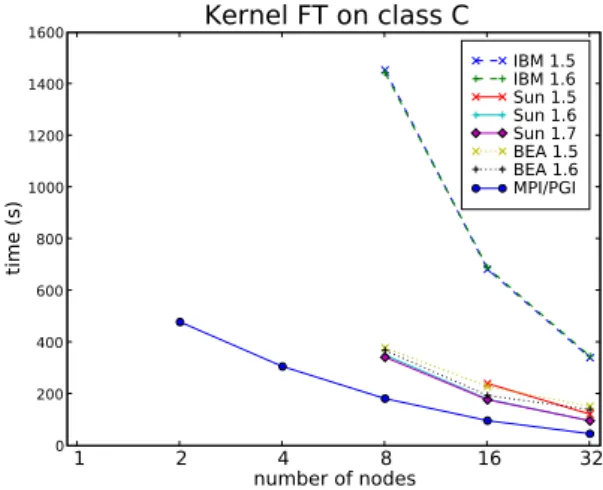
1 2 4 8 16 32 number of nodes 0 200 400 600 800 1000 1200 1400 1600 ti m e ( s) Kernel FT on class C IBM 1.5 IBM 1.6 Sun 1.5 Sun 1.6 Sun 1.7 BEA 1.5 BEA 1.6 MPI/PGI
Figure 2: Execution time of the FT kernel for various JVMs on the Gigabit Ethernet cluster
FT kernel is a test for computation performance, solving differential equation using FFTs. This kernel also tests communication speed by sending a few numbers of very large messages. For a class C problem with 16 workers, each worker sends 22 mes-sages for a total amount of 180 MBytes. Another characteristic of this kernel is that the original Fortran implementation uses some native operations on multi-dimensional arrays which are not available on Java. Thus, for our NPB Java ProActive implementa-tion, we have reimplemented some of these operations at a higher level, causing a large amount of integer operations through array indices computation.
The Figure 2 presents the performance comparison on the Gigabit Ethernet cluster. If we take a look at the behavior with the problem class C, where the data size are pretty big, the figure shows that the kernel could not start in all the cases. While the MPI version ran from 2 nodes, we see that the Java versions had more difficulties, only starting from 8 nodes, except for the Sun 1.5 version which was only able to start the kernel from 16 nodes. Actually, as this kernel deals with very large data structures, we encountered numerous “OutOfMemory” errors. A deeper study of this phenomenon is presented in Section 5.4. Regarding the duration time, we can see that the ProActive version has about the same behavior with 6 JVM out of 7. Compared to the MPI version, results are in the same order of magnitude. Concerning the IBM 1.5 result which is far from the others, it can be explained by the poor performance of this JVM on integer operations we saw on Section 4.
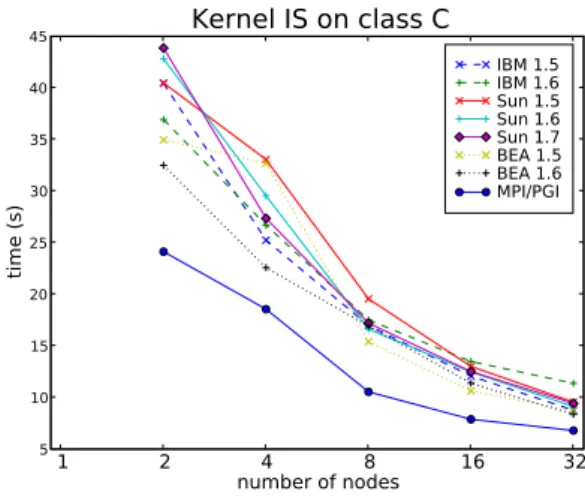
5.2.2 Integer Sort 1 2 4 8 16 32 number of nodes 5 10 15 20 25 30 35 40 45 ti m e ( s) Kernel IS on class C IBM 1.5 IBM 1.6 Sun 1.5 Sun 1.6 Sun 1.7 BEA 1.5 BEA 1.6 MPI/PGI
Figure 3: Execution time of the IS kernel for various JVMs on the Gigabit Ethernet cluster
IS kernel tests both computational speed and communication performance. It per-forms a bucket sort on a large array of integers (up to 550 MBytes for a class C prob-lem). Thus, this kernel is mainly characterized by a large amount of data movements. On a class C problem with 16 workers, each worker sends to each other 65 messages for a total amount of 22 MBytes.
The Figure 3 presents the performance comparison on the Gigabit Ethernet cluster. With a problem class C, all the JVM implementations have a similar behavior with an
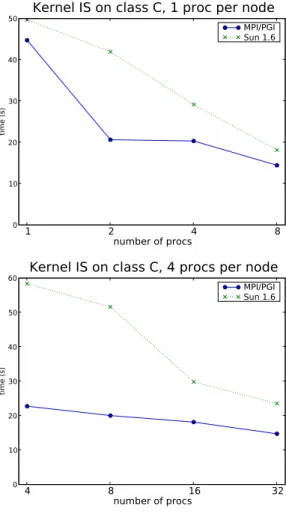
1 2 4 8 number of procs 0 10 20 30 40 50 ti m e ( s)
Kernel IS on class C, 1 proc per node
MPI/PGI Sun 1.6 4 8 16 32 number of procs 0 10 20 30 40 50 60 ti m e ( s)
Kernel IS on class C, 4 procs per node
MPI/PGI Sun 1.6
Figure 4: Execution time of the IS kernel for various JVMs on the SCI cluster execution time which is not so far from the native MPI results (by a factor smaller than 2).
Regarding performance on the SCI cluster; as shown on the Figure 4, we can see that ProActive+JFS presents better performance for the single configuration than for the quad configuration. As the communications involved in this kernel are all to all, IS does not take special advantage from running multiple processes on multi-core nodes. 5.2.3 Embarrassingly Parallel
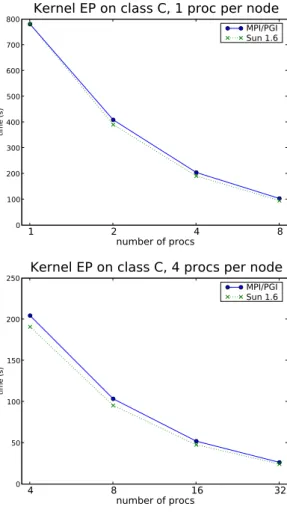
EP kernel provides an estimation of the floating point performance by generating pseudo-random floating point values according to a Gaussian and uniform schemes. This kernel does not involve significant inter-processor communication. Regarding the implemen-tation in Java ProActive, some mathematical functions has been rewritten for perfor-mance issues with base 2 computation. This is the case with pow and log methods. A large amount of the operations involved in this kernel are some very simple operations such as bit shifting.
1 2 4 8 16 32 number of nodes 0 200 400 600 800 1000 ti m e ( s) Kernel EP on class C IBM 1.5 IBM 1.6 Sun 1.5 Sun 1.6 Sun 1.7 BEA 1.5 BEA 1.6 MPI/PGI
Figure 5: Execution time of the EP kernel for various JVMs on the Gigabit Ethernet cluster
The Figure 5 presents the performance comparison on the Gigabit Ethernet cluster. These results shows that the achievable floating point performance of Java is now quite competitive with native MPI.
With a problem class C, we can say that the overall behavior of the various implementa-tions of Java are the same, with a lack of performance for IBM 1.5, again corresponding to what has been highlighted in Section 4 with the JavaGrande benchmarks. Further-more, we note that for this kind of problem, the Java results are a slightly better than the MPI ones.
Now if we look at the results of Figure 6 obtained with the SCI cluster, there is a behavior similar to those we obtained with GbE. This was predictable given the fact that there was almost no inter-processor communication in this kernel. Similarly, if now we try to take advantage of multicore architecture of the machine putting 1 process per core (so, 4 processes per node), then we can see that the execution time is divided by the same amount.
5.3
Communication Intensive Applications
Communication intensive kernels are those which send a large amount of messages. The Conjugate Gradient (CG) and MultiGrid (MG) kernels are such applictions. 5.3.1 Conjugate Gradient kernel
CG is typical of unstructured grid computation. It is a strong test for communication speed and is highly dependant on the network latency. It deals with a very large amount of small messages (with a problem class C on 16 nodes, 429, 248 messages smaller than 50 bytes are sent) and a large amount of mid-size messages (86, 044 messages of 300 KBytes are sent).
When running a class C problem, CG kernel is composed of 75 iterations. Figure 7 presents during one iteration and on one worker the size of outgoing messages over time. Note that this measurement was done at the Java socket level and therefore
in-1 2 4 8 number of procs 0 100 200 300 400 500 600 700 800 ti m e ( s)
Kernel EP on class C, 1 proc per node
MPI/PGI Sun 1.6 4 8 16 32 number of procs 0 50 100 150 200 250 ti m e ( s)
Kernel EP on class C, 4 procs per node
MPI/PGI Sun 1.6
Figure 6: Execution time of the EP kernel for various JVMs on the SCI cluster
cludes the overhead induced by the ProActive middleware.
It shows that for the CG kernel, sending messages is done in a uniform manner over time.
(a) CG kernel message density distribution
(b) CG kernel data density distribution
Figure 8: Communication pattern for the CG kernels on a problem class C with 16 workers
Figure 8 presents the communication pattern of the CG kernel. The SubFigure 8(a) shows that each worker sends about 26, 000 messages (excluding calls to themselves). However, there are some preferred targets. For example, worker 1 sends 11, 932 mes-sages to worker 0 and to worker 3, and 2, 052 mesmes-sages to worker 4. Actually, regard-ing the message density distribution, these 16 workers are divided into 4 clusters of 4 workers.
Now if we look at the SubFigure 8(b), these 26, 000 messages represent about 1.8 GBytes of data. We can see that, even if the clusters still exist, they are no longer so so defined. Hence, as worker 1 sends a total amount of about 593 MBytes to worker 0 and to worker 3 with 11, 932 messages, it sends the same amount of data to worker 4, but within only 2, 000 messages.
In fact, this characterizes the unstructured communications aspect of this kernel. 1 2 4 8 16 32 number of nodes 0 200 400 600 800 1000 1200 1400 1600 1800 ti m e ( s) Kernel CG on class C IBM 1.5 IBM 1.6 Sun 1.5 Sun 1.6 Sun 1.7 BEA 1.5 BEA 1.6 MPI/PGI
Figure 9: Execution time of the CG kernel for various JVMs on the Gigabit Ethernet cluster
Regarding performance comparison, Figure 9 shows the performance results on the Gigabit Ethernet cluster.
We can see that almost all the JVM implementations (except BEA on 1 node) and native MPI version have about the same performance. Actually, in the Java ProActive imple-mentation, CG kernel uses many of the exchange operator. Recall that it optimizes the synchronization between processes and eliminates unnecessary data duplications. It shows that to send a large number of messages of varying size (429, 248 messages of less than 50 bytes and 86, 044 messages of 300 KBytes), the Java ProActive solution is as good as the native Fortran MPI solution.
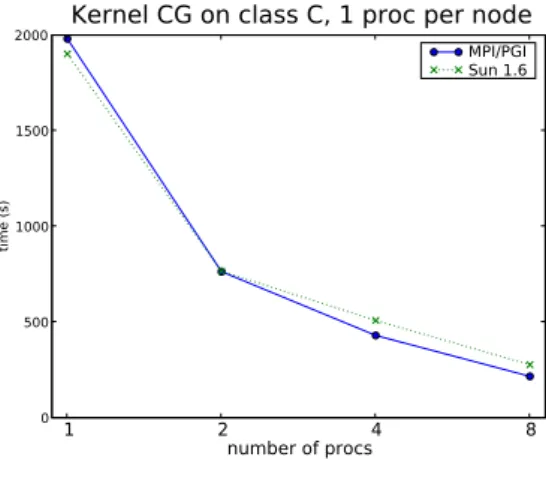
When looking at the performance comparison on the SCI cluster, presented on Figure 10, we see about the same behavior as for the Gigabit Ethernet cluster. More precisely, the SubFigure 10(a) shows that MPI take a little more advantage of the low latency cluster, but not blatantly.
If we now put more than 1 process per node, as the SubFigure 10(b) shows, we see that the achievable floating point performance increase significantly for MPI, but also for Java ProActive.
5.3.2 MultiGrid kernel
MG is a simplified multi-grid problem. Topology is based on a vanilla hypercube (some edges are added to standard hypercube). It tests both short and long distance data communication with variable message size. If we look at the Figure 12, when running with a problem class C on 16 nodes, a total of about 25, 000 messages are sent. Size distribution is as follows: 5000*1KB, 4032*2 KB, 4032*8KB, 4032*32KB, 4032*128KB and 4032*512KB. Also, MG deals with much larger data structures in memory than the CG kernel, causing memory problems.
1 2 4 8 number of procs 0 500 1000 1500 2000 ti me ( s)
Kernel CG on class C, 1 proc per node
MPI/PGI Sun 1.6
(a) CG kernel performance on SCI with 1 process per node
4 8 16 32 number of procs 0 100 200 300 400 500 600 ti m e ( s)
Kernel CG on class C, 4 procs per node
MPI/PGI Sun 1.6
(b) CG kernel performance on SCI with 4 processes per node
Figure 10: Execution time of the CG kernel on the SCI cluster
Figure 11 represents the size of outgoing messages over time. Compared to the CG kernel, messages sent by MG are concentrated around the middle of the iteration. Intervals between the sends corresponds to computation or waiting time.
(a) MG kernel message density distribution
(b) MG kernel data density distribution
Figure 12: Communication pattern for the MG kernels on a problem class C with 16 workers
Regarding performance comparison, Figure 13 shows the performance results on the Gigabit Ethernet cluster.
Here, the important size of data structures, previously mentioned, is clearly visible. Indeed, when using only one node, the data structures are too large to be handled by the JVMs. To be able to perform a run, we need at least two nodes for the BEA and IBM JVMs, and 4 nodes for the Sun, with default garbage collector configuration. On the other hand, the native MPI version is able to run using only one node.
Looking at the execution time, we see that Sun and BEA JVMs are twice as slow as the MPI version. The IBM JVM performance is even worse than other vendors VM . This lack of performance can be explained by the large amount of double and integer operations involved in.
1 2 4 8 16 32 number of nodes 0 50 100 150 200 250 300 350 400 450 ti m e ( s) Kernel MG on class C IBM 1.5 IBM 1.6 Sun 1.5 Sun 1.6 Sun 1.7 BEA 1.5 BEA 1.6 MPI/PGI
Figure 13: Execution time of the MG kernel for various JVMs on the Gigabit Ethernet cluster
When running on the SCI cluster, as shown on the Figure 14, we see that the MPI implementation takes a better advantage of the low latency cluster. When deploying one process per core (4 processes per node), as shown on the SubFigure 14(b), we obtain better results with the Java version, closing on the MPI performance.
5.4
Memory Usage
At startup, a JVM only gives a limited amount of the physical memory to the user pro-gram. The default value can be overridden by specifying a minimum and a maximum heap size. Depending on the vendor, the OS and the hardware it is running on, the default value range from 64MB to half the physical memory available. Having a too low heap size will simply prevent the application from working. Having a big heap, on the other hand, will make garbage collection heavier and might also lead to swap-ping. Thus, sizing the heap is an important part for having good performance on Java applications. However, there is no simple tool or scheme to do this. The memory cost of Java objects varies between JVMs and there is no sizeof method to measure it from inside Java code. Since the freeing of the memory is the responsibility of the Garbage Collector (GC), there is usually a difference between the measured usage of the heap (the size of the free space obtained using System.getRuntime().freeMemory()) and the optimal one.
The general process of garbage collection is as follows. When free memory gets too low, two actions can be taken: the heap size can be increased by the JVM, provided it does not go over the max limit and/or the GC can try to remove garbage. To do so, the GC is given a timeout value and a target free space (usually a percentage of the total heap size). If it fails to free enough space before reaching the timeout, the JVM stops the program with an ou-of-memory exception. It is important to understand that in some circumstances, such an error is raised although, if all the garbage were removed from the heap, there would be enough free memory. From a programmer point of view, it means it is necessary to over provision the heap size to account for
1 2 4 8 number of procs 0 50 100 150 200 250 ti me ( s)
Kernel MG on class C, 1 proc per node
MPI/PGI Sun 1.6
(a) MG kernel performance on SCI with 1 process per node
4 8 16 32 number of procs 0 20 40 60 80 100 120 140 ti m e ( s)
Kernel MG on class C, 4 procs per node
MPI/PGI Sun 1.6
(b) MG kernel performance on SCI with 4 processes per node
delayed reclaiming of garbage. This is a known limitation of GCs and has been taken into account by JVMs vendors. Most JVMs come with multiple GCs to be chosen at start time, depending on the needed performance.
A first criterion allowing to distinguish GC is based on the way the handle the heap space
Single spaced The heap is considered as a whole space
Generational The heap is divided into areas holding objects of different ages. Each area is garbage collected separately and objects which have spent a long enough time in a young generation area are copied to an older one. This allows to per-form collection on only small parts of the heap at the expense of higher memory usage.
Another important characteristic of GCs is the way they mark and sweep (m&s) garbage on the heap.
Serial One thread is used to mark and collect garbage. Although most of the JVMs have such a GC, it is disabled when running on multi processor/core machines Parallel Multiple threads are used to mark and collect garbage. However, the
applica-tion threads need to be stopped as the GC requires exclusive access to the heap. Concurrent The GC can run concurrently to the application threads (although it might
stop them, it will try to reduce the pauses as much as possible).
There are two main aspects to consider when choosing a GC. The first one is the pause time, i.e. periods when an application does not perform useful computation because of a garbage collection. The JVMs were infamous for their stop-the-world GCs which introduced very long pause times. Nowadays, they all come with parallel and concurrent GCs designed to minimize such pauses. The second one is promptness and measure the time between an object death and the reclaiming of the memory. The former affects the global run time of an application, while the later affects its memory footprint. Most JVMs have options to indicate which aspect has the highest priority. As a general rule, parallel GCs optimize memory footprint whereas concurrent one maintain a low pause time.
Our Java implementation of the NPBs has a very simple memory pattern. Most of the needed objects are allocated at the beginning of the run and don’t need to be garbage collected during the whole execution. Intermediate variables are created inside methods as local variables and are easily marked as garbage. As such, the NPBs are clearly not an effective GC benchmark.
In all our experiments, there was a clear difference between sequential and paral-lel/concurrent GCs in term of execution speed. In some situations, having a sequential GC added a 10x increase in some NPB duration, especially if during the execution very little heap space was left free. This was clearly visible in the MG benchmark.
Although no such difference appeared between parallel and concurrent GC we found that the heap size needed to perform a full run varied, depending on the ven-dor and the GC used. In table 2 we present the minimum heap size needed to run each NPB with a class C problem on 8 nodes. We have tested different values with a 32MB increment for 32-256MB heap size, and a 128MB increment otherwise. Only the maximum heap size was set, the minimum was left to choose for the JVM.
The first observation is that there is little difference in memory usage for most JVMs, even from different vendors. The notable exception to this is the IBM VM on
CG EP FT IS MG BEA Generational, ConcurrentSingle-Spaced,Parallel 256256 6464 15361536 512512 512512 IBM Generational, ConcurrentSingle-Spaced, Parallel 256256 6464 15361536 640896 512512
Sun
Generational, Serial 256 64 1792 640 512 (10x slower)
Generational, Parallel 256 64 2304 768 768
Generational, Concurrent 256 64 1536 512 512
Table 2: Lowest heap size in MB for various Java6 virtual machines and Garbage Collector, class C on 8 nodes
the IS benchmark, which needed at least 640MB to run. Another observation is that the needed heap size depends on the GC chosen. As we can see, when running FT on a Sun VM with the concurrent GC, we needed 1536MB, whereas when using the Parallel one, 2304MB was the minimum value to run. This is rather counter-intuitive as parallel GCs are supposed to lower the memory footprint. This situation only occurred when not setting a minimal heap size. Having an equal minimum and maximum heap size prevented an out of memory. We believe this was caused by an insufficient increase of the heap size by the VM and the inability for the GC to reach its target free space. 5.4.1 Conclusions
The heap size set at the start-up time of the JVM has an impact on the execution of the NPBs. However, when running on a multi-core architecture, the impact does not lay in the execution time but in the capacity to perform a run, especially when the initial heap value is not set by the programmer. Even on benchmarks with simple memory usage, the results were not straightforward.
This is a disadvantage of Java compared to Fortran, as it is very difficult to pre-dict the size of the data structure to be able to size the heap correctly. Multi-core architecture have a beneficial impact on JVMs as they allow the use of parallel and concurrent GCs. They can prevent long pauses in the execution to increase the overall performance.
6
CONCLUSION AND FUTURE WORK
In this paper we have given an overview of the current situation of Java for HPC. First, we have shown that basic performance for integer and double arithmetic have increased since Java4, reaching a high level with Java6 VMs and are no longer an issue.
In the second part of this paper, we have compared the performance of a Java im-plementation of the NPBs to a Fortran MPI one. When considering strongly commu-nicating applications, the speed and scalability of the Java ProActive implementation are, as of today still lower than MPI. On three NAS benchmarks (CG, MG, FT), the overhead factor ranged from 1.5-2 on 16 nodes to 2-6 on 32 nodes.
The lack of scalability in those benchmarks is mainly due to numerous small mes-sages for which the ProActive overhead is significantly higher than the MPI one. We are working to reduce that overhead through size reduction of the message context but are dependant on the RMI layer.
On two benchmarks (IS and EP) the Java ProActive version performs is on par with the Fortran MPI one on up to 64 machines; We have also shown that it is possible to take advantage of high-performance interconnects (SCI) in a non-intrusive way. Using a network layer, JFS, it is possible to transparently use an SCI infrastructure without source modification or reconfiguration. The differences between the Java implementa-tion of NAS benchmarks and the MPI one are narrower on these systems, showing the feasibility of this approach on high-performance interconnects.
Finally, we have shown that the garbage collection overhead can be kept minimal. An important effort has been put in it and the results confirm it, especially when run-ning on multi-core architecture. However, there remain the problem of heap sizing, especially when considering potential interraction with the garbage collector.
Overall, the results obtained are encouraging. We believe that the overhead of Java is now acceptable when performing computational intensive tasks. Regarding com-munication intensive tasks, the lower performance can be partially overcomed using optimized network layers. The HPC community has already worked on the issue and produced interesting results [NIE 05]. However, current JVM vendors have not devel-oped efficient enough solutions yet.
References
[BAD 02] LAURENT BADUEL, FRANC¸OISE BAUDE, and DENIS CAROMEL.
“ Efficient, Flexible, and Typed Group Communications in Java ”. In Joint
ACM Java Grande - ISCOPE 2002 Conference, pages 28–36, Seattle, 2002.
ACM Press.
[BAD 06] LAURENT BADUEL, FRANC¸OISE BAUDE, DENIS CAROMEL, ARNAUD
CONTES, FABRICE HUET, MATTHIEU MOREL, and ROMAIN QUILICI.
“ Grid Computing: Software Environments and Tools ”, chapter Program-ming, Deploying, Composing, for the Grid. Springer-Verlag, January 2006. [BAI 94] D. H. BAILEY, E. BARSZCZ, J. T. BARTON, D. S. BROWNING, R. L.
CARTER, D. DAGUM, R. A. FATOOHI, P. O. FREDERICKSON, T. A.
LASINSKI, R. S. SCHREIBER, H. D. SIMON, V. VENKATAKRISHNAN,
and S. K. WEERATUNGA. “ The nas parallel benchmarks ”. Technical re-port, NASA Ames Research Center, march 1994.
[BEA ] BEA. Checklist/tuning guide for optimizing the jrockit jvm. http:// dev2dev.bea.com/pub/a/2007/12/jrockit-tuning.html. [BLA 06] S. M. BLACKBURN, R. GARNER, C. HOFFMAN, A. M. KHAN, K. S.
MCKINLEY, R. BENTZUR, A. DIWAN, D. FEINBERG, D. FRAMPTON, S. Z. GUYER, M. HIRZEL, A. HOSKING, M. JUMP, H. LEE, J. E. B. MOSS, A. PHANSALKAR, D. STEFANOVIC´, T. VANDRUNEN, D. VON
DINCKLAGE, and B. WIEDERMANN. “ The DaCapo benchmarks: Java
benchmarking development and analysis ”. In OOPSLA ’06: Proceedings
of the 21st annual ACM SIGPLAN conference on Object-Oriented Pro-graming, Systems, Languages, and Applications, New York, NY, USA,
Oc-tober 2006. ACM Press.
[CAO 05] ZHONGBOCAO, WEIHUANG, and J.M. CHANG. A study of java virtual machine scalability issues on smp systems. iiswc, 0:119–128, 2005.
[FOR ] THE JAVA GRANDE FORUM. The java grande forum benchmark suite. http://www2.epcc.ed.ac.uk/computing/research activities/java grande/index 1.html.
[GOR 04] SERGEIGORLATCH. Send-receive considered harmful: Myths and realities of message passing. ACM Trans. Program. Lang. Syst., 26(1):47–56, 2004.
[IBM ] IBM. Detailed description of virtual machine garbage collection
tuning. http://publib.boulder.ibm.com/infocenter/
javasdk/v1r4m2/index.jsp?topic=/com.ibm.java.doc. diagnostics.142/html/gcdetailed.html.
[NIE 05] ROB V. VAN NIEUWPOORT, JASON MAASSEN, GOSIA WRZESINSKA,
RUTGERHOFMAN, CERIELJACOBS, THILOKIELMANN, and HENRIE.
BAL. Ibis: a flexible and efficient Java based grid programming envi-ronment. Concurrency and Computation: Practice and Experience, 17(7-8):1079–1107, June 2005.
[PHI 01] MICHAEL PHILIPPSEN, RONALD F. BOISVERT, VLADIMIR GETOV,
ROLDAN POZO, JOSE´ E. MOREIRA, DENNIS GANNON, and GEOFFREY FOX. “ Javagrande - high performance computing with java ”. In PARA
’00: Proceedings of the 5th International Workshop on Applied Parallel Computing, New Paradigms for HPC in Industry and Academia, pages 20–
36, London, UK, 2001. Springer-Verlag.
[SUN ] SUN. Java se 6 hotspot virtual machine garbage collection tuning. http://java.sun.com/javase/technologies/hotspot/ gc/gc tuning 6.html.
[TAB 06] G. L. TABOADA, J. TOURINO˜ , and R. DOALLO. “ Efficient java communi-cation protocols on high-speed cluster interconnects ”. In Proc. 31st IEEE
Conf. on Local Computer Networks (LCN’06), pages 264–271, Tampa, FL,
Centre de recherche INRIA Bordeaux – Sud Ouest : Domaine Universitaire - 351, cours de la Libération - 33405 Talence Cedex Centre de recherche INRIA Grenoble – Rhône-Alpes : 655, avenue de l’Europe - 38334 Montbonnot Saint-Ismier Centre de recherche INRIA Lille – Nord Europe : Parc Scientifique de la Haute Borne - 40, avenue Halley - 59650 Villeneuve d’Ascq
Centre de recherche INRIA Nancy – Grand Est : LORIA, Technopôle de Nancy-Brabois - Campus scientifique 615, rue du Jardin Botanique - BP 101 - 54602 Villers-lès-Nancy Cedex
Centre de recherche INRIA Paris – Rocquencourt : Domaine de Voluceau - Rocquencourt - BP 105 - 78153 Le Chesnay Cedex Centre de recherche INRIA Rennes – Bretagne Atlantique : IRISA, Campus universitaire de Beaulieu - 35042 Rennes Cedex Centre de recherche INRIA Saclay – Île-de-France : Parc Orsay Université - ZAC des Vignes : 4, rue Jacques Monod - 91893 Orsay Cedex
Éditeur
INRIA - Domaine de Voluceau - Rocquencourt, BP 105 - 78153 Le Chesnay Cedex (France) http://www.inria.fr