HAL Id: hal-00295568
https://hal.archives-ouvertes.fr/hal-00295568
Submitted on 14 Dec 2004
HAL is a multi-disciplinary open access
archive for the deposit and dissemination of
sci-entific research documents, whether they are
pub-lished or not. The documents may come from
teaching and research institutions in France or
abroad, or from public or private research centers.
L’archive ouverte pluridisciplinaire HAL, est
destinée au dépôt et à la diffusion de documents
scientifiques de niveau recherche, publiés ou non,
émanant des établissements d’enseignement et de
recherche français ou étrangers, des laboratoires
publics ou privés.
irradiance
J. M. Sabburg, C. N. Long
To cite this version:
J. M. Sabburg, C. N. Long. Improved sky imaging for studies of enhanced UV irradiance. Atmospheric
Chemistry and Physics, European Geosciences Union, 2004, 4 (11/12), pp.2543-2552. �hal-00295568�
Atmos. Chem. Phys., 4, 2543–2552, 2004 www.atmos-chem-phys.org/acp/4/2543/ SRef-ID: 1680-7324/acp/2004-4-2543 European Geosciences Union
Atmospheric
Chemistry
and Physics
Improved sky imaging for studies of enhanced UV irradiance
J. M. Sabburg1and C. N. Long21Centre for Astronomy, Solar Radiation and Climate, Faculty of Sciences, Univ. Southern Queensland, Toowoomba, Australia 2Pacific Northwest National Laboratory, Richland, WA, USA
Received: 13 July 2004 – Published in Atmos. Chem. Phys. Discuss.: 6 October 2004 Revised: 2 December 2004 – Accepted: 5 December 2004 – Published: 14 December 2004
Abstract. A recent World Meteorological Organisation
re-port discussed the imre-portance of continued study of the ef-fect of clouds on the solar UV radiation reaching the earths surface. The report mentions that the use of all-sky imagery offers the potential to understand and quantify cloud effects more accurately. There are an increasing number of studies investigating the enhancement of surface solar, UV irradi-ance, and UV actinic flux, using automated CCD and sky imagers. This paper describes new algorithms applicable to a commercially available all-sky imager (TSI-440), for re-search investigating cloud enhanced spectral UV irradiance. Specifically, these include three new algorithms relating to cloud amount at different spatial positions from 1) zenith and 2) from the solar position and 3) the visible brightness of clouds surrounding the sun. A possible relationship be-tween UV enhancement and the occurrence of near-sun cloud brightness is reported based on this preliminary data. It is found that a range of wavelength dependent intensities, from 306 to 400 nm, can occur in one day for UV enhancements. Evidence for a possible decreasing variation of intensity with longer wavelengths is also presented.
1 Introduction
In a recent World Meteorological Organisation (WMO) re-port, Kerr et al. (2003) included a subsection discussing the importance of the dependence of solar ultraviolet (UV) radi-ation at the earth’s surface due to clouds. There are contin-uing studies of the influence of clouds on surface broadband UV irradiance (e.g. Alados-Arboledas et al., 2003), and an increasing number of studies investigating the enhancement of surface spectral solar and UV irradiance, as well as UV actinic flux, using automated charge coupled device (CCD) Correspondence to: J. M. Sabburg
(sabburg@usq.edu.au)
and whole sky imagers (e.g. Pfister et al., 2003; Crawford et al., 2003; Eckstein et al. 2003). Thus far cases of increas-ing “trends” of wavelength dependence have been published, based on both measured and modelled clear scans as the ref-erence (e.g. Crawford et al., 2003), for spectra below clouds. This is further discussed in Sect. 3.4. Decreasing “trends”, based on model clear scans (e.g. Kylling et al., 1997), have been reported for spectra above clouds. Eckstein et al. (2003) and Crawford et al. (2003) have reported spectra on cloudy days showing UV enhancements, all with a “trend” (vari-ation) of increasing wavelength dependence above 320 nm for an unobscured Sun surrounded by cloud-filled skies. In searching for the reasons for the wavelength dependence of the effects of clouds, Eckstein et al. (2003) suggest that the main effect of clouds is the conversion of direct radiation to diffuse radiation due to scattering.
Parisi et al. (2004) devoted two chapters discussing sky cameras and the topic of UV enhancement, including the re-sults obtained from the first integrated sun centred sky cam-era (Sabburg and Wong, 1999; Sabburg and Wong, 2000a). A preliminary one-year study of enhanced spectral UV ir-radiance, without corresponding sky images (Sabburg et al., 2003), is also reported. Sabburg (2000) reported that cloud amount, in the field of view (FOV) of the sun centred sky camera (approximately 120◦), accounted for up to 90% of the effect on UV irradiance levels at the ground compared to whole sky cloud amounts (approximately 180◦FOV). Sab-burg and Wong (2000a) previously postulated that UV en-hancement might be due to a combination of refraction and scattering of direct and diffuse sunlight when the solar disk is obscured by cirrus cloud or haze, but still visible. This is elaborated on in Sect. 3.3.
Much progress has been made in the development of auto-mated whole sky imagers since their inception in the 1970’s, e.g. Horvath et al. (2002) and Shields et al. (2003), however this progress has been at a considerable increased cost to the purchaser of these instruments. Horvath et al. (2002) present
a combined radiometric and polarimetric algorithm that per-forms the detection of clouds more efficiently and reliably, e.g. including cirrus clouds, as compared with an exclusively radiometric cloud-detection algorithm. Shields et al. (2003) describe their Whole Sky Imager (WSI) that provides cloud amount assessment as well as measurements of the radiance distribution over the full sky in several spectral bands. A more sophisticated version of their algorithm, to detect thin-ner clouds and enable aerosol assessment, is in development and will be based on using the near infrared (NIR) part of the solar spectrum.
This paper presents cases of spectral UV enhancement and spectral dependence in conjunction with cloud parameters derived from new image processing algorithms, e.g. detect-ing cloud in the vicinity of the solar disk, applied to the images from a TSI-440 instrument (Yankee Environmental Systems Inc, YES, MA, USA.). As the operation of the TSI-440 has been described elsewhere (e.g. Beaubien and Bis-berg, 1998), and its predecessor, the Hemispheric Sky Imager (HSI) Long and DeLuisi, 1998), details will not be presented in this paper. The TSI-440 was previously used by the first author of this current paper to establish an algorithm for clas-sifying clear-days using a Brewer Spectrophotometer (Kipp & Zonen) (Sabburg et al., 2002). Another version of the TSI has been produced by YES to include a self-contained com-puter (the TSI-880), but using the same camera and image processing algorithm. A paper comparing the performance of the WSI and the TSI-880 has been published by Long et al. (2001). This paper suggests that there is agreement be-tween the results from the TSI-880 and WSI. It could be in-ferred that there is also agreement with the TSI-440.
The new image processing algorithms were designed to suit the features of the TSI-440 and are presented below. Additionally, a summary of the major findings of cloud en-hanced UV index (UVI) and spectral UV irradiance (over 5 min intervals), and how these findings relate to the current literature on this topic is presented.
2 Instrumentation
2.1 Measurement location and spectral instrument
The measurement site for this current research is the cam-pus of the University of Southern Queensland (USQ), Toowoomba, Australia (27.5◦S, 151.9◦E, 693 m altitude).
The spectroradiometer and TSI-440 (discussed below) were located approximately five metres apart atop a 4-story build-ing with no surroundbuild-ing hills or trees affectbuild-ing the FOV. This site has a relatively unpolluted atmosphere (Parisi and Downs, 2004).
The spectroradiometer, described in detail by Parisi and Downs (2004), is a DTM300 Bentham Instrument (Reading, UK), installed in an environmentally sealed container and based on a double grating monochromator. Solar radiation
enters the spectroradiometer via a diffuser connected by a 1 m long optical fibre to the input slit of the first monochro-mator. The manufacturer has determined the error associated with the cosine response of the diffuser as less than ±0.8% for a solar zenith angle (SZA) of up to 70◦. The uncer-tainty of measuring SZA was estimated to be less than ±1%. The instrument was not temperature stabilised for the period of this research and the manufacturer supplied temperature coefficients (−0.4%/◦C), have been applied to temperature correct the data, assuming wavelength independence. On each day the spectroradiometer is scheduled to start scanning wavelengths at dawn, and thereafter every 5 min till dusk from 280 to 400 nm in increments of 0.5 nm. A scan lasts for approximately 2 min.
For the 5 month period of this study, the instrument was ir-radiance calibrated on 17 March 2003 against a 150 W quartz tungsten halogen (QTH) lamp traceable to the National Phys-ical Laboratory, UK standard. It was also wavelength cali-brated against the UV spectral lines of a mercury lamp. There is a ±3% uncertainty associated with this calibration due to irradiance and lamp traceability errors. On a fortnightly ba-sis, the stability of the instrument was checked using three 150 W QTH lamps and a mercury lamp. The overall abso-lute irradiance uncertainty of the Bentham spectroradiome-ter is estimated to be ±9% based on the temporal stability, cosine error, dark count variability and the traceability of the absolute irradiance (Parisi and Downs, 2004).
2.2 All-Sky Imager
The TSI-440 was geometrically aligned with the sun so that the shadow band, taped onto the hemispherical mirror dome that rotates to track the sun across the sky throughout the day, prevented reflection of the sun directly into the digital camera lens. A filament under the dome provides heating to evapo-rate any moisture on the dome surface. The shadow band set-tings were adjusted to block about 9% of the image. It was found that on clear days at low SZA in summer, a shadow of the camera head was sometimes cast across the shadow band increasing the uncertainty by approximately 0.5% in the cloud amount estimate. On average if a cloud is behind the strip in one image it causes an underestimate of sky cover, but if the cloud moves from behind the strip it causes an over-estimate, thus tending to balance out. It is estimated that for a 15-min average of cloud amount, based on a 30-s resolution, the uncertainty is less than ±3%.
The camera is positioned above and facing down over the centre of the dome (Fig. 1), and is used to capture the sky images (e.g. Fig. 2a). It is configured to automatically col-lect the images every 5 min of daylight to coincide with the beginning of each spectral scan of the Bentham. Thus it was essential to examine two images, acquired before and after the UV scan of interest, to see if any major changes in the sky hemisphere had occurred during the scan period. The standard TSI software package captures 352×288 pixel,
J. M. Sabburg and C. N. Long: Improved sky imaging for studies of enhanced UV irradiance 2545
1
Fig. 1. The TSI-440 at USQ with the first author pictured on the
right. The hemispherical dome, shadow band and digital camera can be seen (Parisi et al., 2004).
24 bit colour images and saves them as JPEG format data files. The data recorded by this software includes date, lo-cal time, SZA, sunshine indicator, and “opaque” and “thin” cloud amounts (described later). Analysis of cloud amounts, performed on the images, is within 160◦FOV. The portion of the sky near the horizon, and thus outside the FOV, accounts for approximately 12.5% of the actual sky view. However, as noted by Long and Ackerman (2000), this portion of the sky has very little influence on the amount of energy collected by a flat plate detector oriented parallel to the Earth’s surface due to the cosine weighting effect of the radiance striking the detector at such glancing incidence. In this current pa-per, the sunshine indicator (‘sunny’ algorithm) was used to determine whether or not the sun was blocked by cloud. Al-though Pfister et al. (2003) found that the factory setting of “35” related well to the WMO definition of solar obstruction, a value of “50” was used in this current paper. Thus “thicker” haze and Cirrus cloud, across the sun, was classified as ob-scured, but not when the sun was still easily visible through thinner cloud. The occurrence of “Opaque” and “thin” cloud amounts were used to estimate the total cloud amount, less the 9.5% due to the shadow band and camera head shadow that is assumed to be represented by the rest of the sky im-age. The ratio of the red/blue colour values for each pixel is used to determine clear/cloudy status. Clear skies scatter the shorter blue wavelengths more efficiently than the longer red wavelengths, which is why the clear sky is blue. In com-parison, clouds tend to scatter the visible wavelengths about equally, thus the red/blue ratio is higher for clouds. The sky filter parameters, used to determine the levels of opaque and thin cloud amount, were set to the manufacturer default lev-els of 40 for the Clear/Thin limit and 60 for the Thin/Opaque limit. These settings relate to the percentage above the man-ufacturer’s baseline limit for clear sky, which is a function of each pixel’s distance from zenith and sun position in the
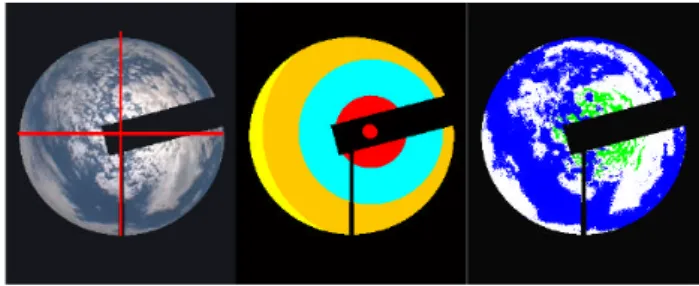
1 Fig. 2. (a) Example TSI-440 all-sky image showing four regions
used to check uniformity, (b) “inner”, “middle”, “outer” and “ex-treme” solar proximity regions about the sun, (c) “enhanced” re-gions of the threshold image shown in (a).
image. These are what the user decides as reasonable demar-cations in “blueness” between clear versus thin (can see blue through the cloud) and opaque cloudiness (no blue tint in the cloud). Overall, it was found that these settings resulted in an uncertainty of approximately 2% for incorrect sky reddening (i.e. increased red pixels for cloud free sky). This finding was based on a visual analysis of 653 images sampled randomly in the period December 2001 to September 2002.
The TSI does not correct for the difference between in-stantaneous retrievals of fractional sky cover (looking up at the clouds, e.g. from a sky imager) and earth cover (look-ing down at the clouds). This issue has been discussed in past literature, e.g. Goodman and Henderson-Sellers (1988). Using an average of a highly sampled time series greatly de-creases the difference between “average sky cover” and “av-erage earth cover” (Kassianov et al., 2003). This is due to the integration of the “fish-eye” distortion of the hemispheric FOV. The “too small near the edge” pixels somewhat bal-ances out the “too large in the centre” distortion of the FOV over time.
The TSI uses an “off-the-shelf” camera with a CCD of somewhat limited intensity range. Thus, the presence of “thin cloud” or haze can cause forward scattering of visible light in the vicinity of the solar disk that overloads the upper limit of the CCD when set to also try to detect thin clouds, particularly at large SZA. Pfister et al. (2003) also address this problem and further research, with possible additions to the TSI optics, being required to satisfactorily resolve this issue.
In terms of absolute uncertainty, for a single image of the sky, cloud amount measurement is estimated to be approxi-mately ±24%. This applies to a one off image compared to the determination of an equivalent 180◦FOV cloud amount. This uncertainty estimate is based on the 12.5% of the im-age out of the FOV of the TSI, the 9.5% due to the shadow band and camera arm shadow and 2% due to sky reddening. Although this is the worst-case scenario, the TSI estimated uncertainty is usually considered much lower, i.e. ±10% at least 95% of the time, according to Long et al. (2001). This
is at least in agreement with the uncertainty from other meth-ods, e.g. a trained human observer.
2.3 New software algorithms
The new algorithms for the TSI-440 were written to record cloud ‘uniformity’ in the entire image (with respect to zenith), “inner”, “middle”, “outer” and “extreme” regional cloud amounts (with respect to the solar position), and “en-hancement” of clouds surrounding the sun. Sabburg and Wong (2000a) has previously evaluated the cloud parameters around the sun’s location using a sun centred sky camera, and more recently Pfister et al. (2003) implemented some similar parameters in the analysis of their HSI images.
“Uniformity” was recorded as 1 if cloud amount in four quadrants of the image were within 20% of the total image cloud amount, else listed as 0. The quadrants were defined as N to E, N to W, S to W and S to E, and the summation of these cloud amounts was another representation of whole sky amount. This cloud amount was calculated differently from the TSI cloud amount, as adjustable thresholds were applied based on the mean brightness of the whole image. This was done to try and account for the difficulty in the detection of “thin cloud” or haze. Although there has been no rigorous comparison between this and the standard TSI cloud amount algorithm, there were sufficient indicators suggesting its use primarily for checking cloud uniformity.
Cloud amounts were also calculated in four separate cir-cular “regions” surrounding the sun. Each region is concen-tric about an estimated position of the Sun. The position of the Sun was determined by the TSI processing algorithm and typically coloured in yellow if the sun is not obscured accord-ing to the “sunny” algorithm threshold settaccord-ing discussed pre-viously, else coloured white. The estimated central position of the Sun is determined as the point of intersection of the major vertical and major horizontal axis of the yellow region. If either axis is found to be of the same width at different po-sitions the average position of the widest axis is taken. Re-gions were classified as follows: inner, 45 pixel radius about solar position (approximately 15◦), middle, 90 pixel radius about solar position (approximately 30◦), outer, 135 pixel ra-dius about Solar position (approximately 40◦) and extreme, extending beyond the outer region that is within the image area. It should be noted that the approximate angles are only representative of noon, summer SZA situations when the sun is at its minimum SZA and the outer region covers the outer extreme of the image area. Region estimates do not count pixels defined by the shadow band mask or sunshine indica-tor. Image distortion, due to the physical mirror-camera dis-tance, is not taken into account by this algorithm and solar proximity regions are assumed to be linearly representative of the region of sky they occupy. By examining clear sky data, errors in the solar proximity cloud amount were found at large SZA. From approximately 60◦SZA, increasing false cloud amounts are recorded as the sun progresses in SZA
to-ward the horizon. This error is caused by the reddening of the sky, and increased brightness of the circumsolar disk due to aerosol forward scattering. The method of determining cloud amount can contribute to an over estimation of cloud amount, up to 60% in the inner (sun-centred) proximity range to a few percent in the mid proximity range, depending on the aerosol loading of the atmosphere. Solar proximity regions are illus-trated in Fig. 2b.
“Enhancement” was listed as 1 if cloud in the image was thought to be a contributor to UV enhancement, else listed as 0. In the algorithm this was determined if the number of “bright” cloud pixels exceeded 1000 and the TSI sunshine in-dicator was “true”. “Bright” pixels were those that exceeded the threshold pixel brightness, determined by converting the “RED” component of the indexed colour image (0 to 255 lu-minance level) into greyscale by direct value mapping. This “RED” greyscale level was linearly stretched over a specified range (in this case intensities between 0.3 and 0.1) to cover a full range of intensities from 0 to 1 (1 being the maximum or white and 0 being the least or black). This operation effec-tively maximised the contrast of the image in the specified (0.1 to 0.3) range of the “RED” greyscale. The threshold of this greyscale was set to 0.8 (i.e. 80%). The above inten-sity range and greyscale threshold was determined to be the most optimum from an initial analysis of the enhanced cases from a sample of 653 TSI images. Enhanced regions were indicated in green, e.g. Fig. 2c, (see Sect. 3.3 below for an estimate of the uncertainty).
3 Results, analysis and discussion
3.1 Complete dataset (UVI)
The data set employed in this paper uses the UV spectra and sky parameters from the Bentham and TSI, respectively, from 5 February 2003 to 30 June 2003. This is a total of 145 days (consisting of 7750 five minute UV scans and sky images), covering the SZA range of 11.5 to 80◦. Total ozone mapping spectrometer (TOMS) ozone data was also obtained from the TOMS version 7 overpass database (http://jwocky.gsfc.nasa. gov/). The TOMS ozone data was previously found to have an uncertainty of ±2% for this site at Toowoomba (Sabburg et al., 2003). The range of ozone values, as measured around noon, for this current dataset was found to be between 248 to 311 Dobson units (DU). Using the quick TUV online calcu-lator (http://www.acd.ucar.edu/TUV/), this corresponds to a variation of approximately ±15% in UVI.
The fractional sky cover, before and after each spectral scan, was employed to determine the spectral scans corre-sponding to relatively cloud free skies. A criterion of less than 2% sky cover, as recorded by the TSI, was employed to classify the scan as being cloud free. Prior TSI images were compared to visual observations on 5 days (653 images) sam-pled randomly in the period December 2001 to September
J. M. Sabburg and C. N. Long: Improved sky imaging for studies of enhanced UV irradiance 2547
1
(a)
14
° 20° 32° 37°
(b)
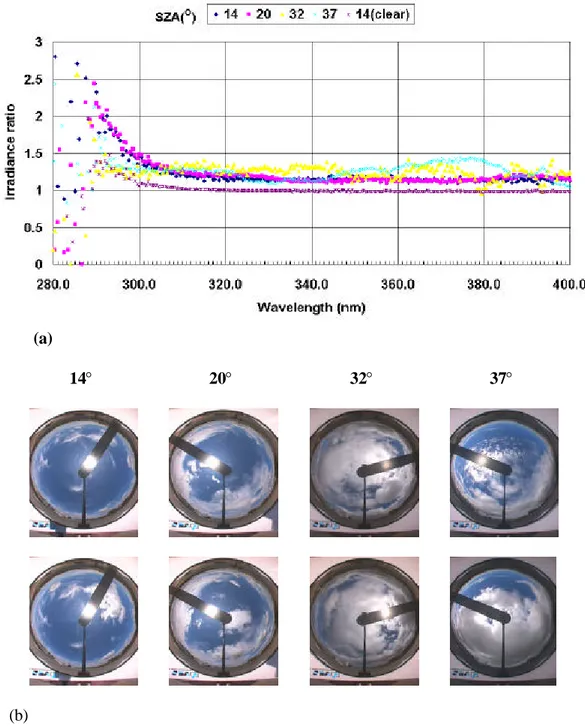
Fig. 3. (a) Graph of the ratio of an enhanced scan and the average of clear-sky scans versus wavelength, corresponding to four SZA ranges, (b) Corresponding before (top) and after (below) images, showing the sky cover changes during the 5 min interval.
2002. It was found that 156 out of 188 clear sky images were correctly classified (83%). This result was in part due to the TSI algorithm using a 160◦ FOV, resulting in 12.5% of the sky near the horizon not being analysed. This dis-crepancy resulted in some apparent clear sky images being rejected from the current dataset after manual inspection, as cloud coverage near the horizon was found in those cases. A manual check was also made on the sky images where the in-tensity of the irradiances were lower than expected for clear
scans, thus further reducing the likelihood of incorrect clas-sification. These cases were caused by undetected haze or thin cloud (thus greater than 2% sky cover), as well as cases of cloud (less than 2% sky cover), but in close proximity to the sun and still unobscured.
A total of 1694 clear scans were classified as “clear” us-ing the above method (22% of all scans). In comparison to instruments with longer scan times, e.g. Brewer Spectro-radiometers, these data points were not randomly scattered
1
(a)
(b)
Fig. 4. Relatively clear TSI images taken on, (a) 12 February at
11:50 am and, (b) 14 February at 12:15 pm.
about the line of best fit. A cubic equation, found to produce the best fit to a graph of the UVI values versus the SZA in the range of 13.8 to 80◦(r2value of 0.99), is presented below:
U V I =7 × 10⁻⁵SZA3−0.0082SZA2+0.0381SZA + 15.817 (1)
Scatter in the data about the line of best fit is related to numer-ous factors. These included instrument uncertainty, possible traces of undetected (by algorithm or observer) cloud/haze in the sky, and total column ozone and aerosol optical depth (AOD) variation. The maximum variation of the data (±9%) over the complete SZA range was the same as the uncertainty of the instrument (also ±9%). The worst case uncertainty is therefore 18% which exceeds the maximum variation of UVI, based on ozone variation, calculated above as 15%. Thus it was not meaningful to separate the effects of ozone variation on the UVI data, even though the clear sky scans had a similar range of ozone levels as the complete dataset. Further, using the method of Fioletov et al. (2002), a maxi-mum variation of ±8% was found for the same clear scans mentioned previously, also less than the instrument uncer-tainty. This method used the 324 nm irradiance as a proxy for AOD due to this wavelength not being affected by ozone or SO2 changes. Thus, using Eq. (1) as a clear-sky refer-ence, all UV scans were classified as either enhanced or not enhanced as described below.
The only candidates for enhancement that were chosen were those data points where the irradiance (less measure-ment uncertainty), were greater than the corresponding clear sky reference (plus variation uncertainty) for that SZA. For example, all UV spectra that were considered enhanced by cloud were chosen as 18% (9% instrument uncertainty plus 9% variation uncertainty), above the clear sky reference value (i.e. worst case scenario). In total there were 99 can-didates (less than 1.3% of all scans), for UV enhancement (SZA range of 12 to 74◦).
The maximum enhancement (1.4) was recorded at 11:00 am local time on the 6 February, with a corresponding SZA of 19.4◦. There was approximately 10% opaque cloud
amount with no detectable thin cloud. The cloud distribution was uniform with respect to both zenith and the solar posi-tion. The wavelength dependency (investigated in Sect. 3.4), was found to have a general negative slope, possibly con-tributed by clouds passing over the sun’s disk during the fi-nal stages of the wavelength scan. Based on previous studies, it was surprising that the cloud cover was not greater corre-sponding to this maximum enhancement. However, it must be remembered that this is based on preliminary data (ap-proximately 5 months) and future work will include a further investigation of enhancement versus cloud cover.
For the purposes of this study, only enhancements occur-ring between the times of 9:00 am to 3:00 pm were consid-ered. This resulted in 57 scans (SZA range of 12 to 39◦),
accounting for just over half the total number of enhanced scans.
3.2 Enhanced scans based on SZA
To investigate the spectral dependence of the intensity of these enhanced UV scans, as was undertaken by Sabburg et al. (2003) using a different spectral instrument, a comparison of scans centred on similar SZA was undertaken. Figure 3a shows four such scans, including a fifth scan to show the ef-fect of the ratio of two apparent clear scans. It can be seen in Fig. 3a that the ratio of the spectral irradiances of two of the cloud enhanced scans (SZA of 14 and 20◦, with approximate ratios of 1.2), is essentially wavelength independent above a cut-off wavelength of approximately 306 nm. The ratio of the spectral irradiances of the cloud enhanced scans (SZA of 32 and 37◦), also had average ratios of 1.2, but above the cut-off wavelength there were variations of the ratio of up to ±20% (refer to Sect. 3.4). There were no scans at 32◦ that gave an average ratio of 1.0, in contrast with the corresponding results of Sabburg et al. (2003). Figure 3b shows the im-ages corresponding to each scan, before and after the 5 min interval between scans. These images indicate how the sky conditions changed, due to both cloud motion and cloud mor-phology. It can be seen in the images that when the intensity of the scans varied the most with wavelength (SZA examples 32 and 37◦), this also corresponded to the most variation of solar obstruction by clouds. Some changes in fractional sky cover between images are also apparent.
To illustrate the difficulty in interpreting the ratios for wavelengths less than 306 nm, the ratio of two apparent clear scans (SZA 14◦, approximate ratio of 1.0 for wavelengths above 306 nm), obtained on two different days around noon (ratio of February 12 to 14 scans, with ozone difference of approximately +3%) is also illustrated in Fig. 3a. Ratio vari-ations of ±100% could be attributed to changes in ozone. Additionally, as can be seen from Fig. 4, the scans were not taken when the skies were entirely clear of cloud, i.e. there
J. M. Sabburg and C. N. Long: Improved sky imaging for studies of enhanced UV irradiance 2549
1
(a)
(b)
(c)
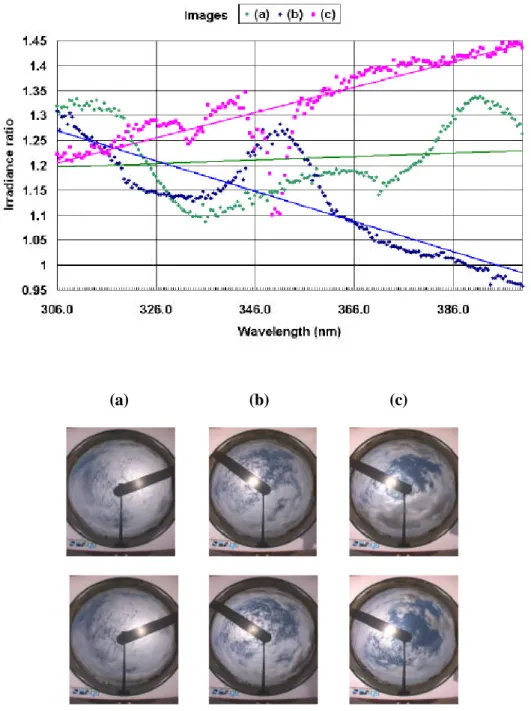
Fig. 5. Graph of the ratio of irradiance for cloudy UV scans to corresponding clear UV scans, of similar SZA, versus wavelength with
corresponding before (top) and after (below) TSI images, all taken on 6 February at, (a) 10:20 am, (b) 13:05 pm and, (c) 13:25 pm. The slopes and r2for the linear fits were, (a) 0.4, 0.02, (b) −3.0, 0.71, and (c) 2.5, 0.72.
might have been some further effect due to the undetected cloud.
3.3 All enhanced scans
Eckstein et al. (2003) suggest that the main reason for the wavelength dependence of the effects of clouds is the conver-sion of direct radiation to diffuse radiation due to scattering. In the case of broken clouds they conjecture that direct
radi-ation is scattered at the edge of one cloud, reaches the neigh-bouring cloud and is scattered again, leading to a tunnelling effect between the clouds, and increasing the diffuse radia-tion below the clouds. At a point on the ground where the di-rect radiation arrives through a cloud gap, additional diffuse radiation is observed compared to the clear sky case, result-ing in a higher actinic flux. With increasresult-ing wavelength the diffuse part of the actinic flux decreases while the direct radi-ation increases due to the inverse fourth power dependence of
molecular scattering. Therefore, at longer wavelengths rela-tively more direct radiation is converted to diffuse radiation below the cloud, leading to the observed wavelength depen-dence for the enhancement.
Crawford et al. (2003) reported two cases where the great-est wavelength dependence occurred for SZA greater than 53◦. They performed simple model calculations to demon-strate that the wavelength dependence could be produced by the transmission of radiation through clouds and the conver-sion of direct radiation to diffuse radiation. They also sug-gest that wavelength dependence in cloud transmission of UV would be more prevalent at higher latitudes where low Sun conditions persist.
In the case of Pfister et al. (2003), for pyranometer data, al-though they did not comment directly on wavelength depen-dency, they did support the findings of Crawford et al. (2003) with respect to cases of enhancement for SZA greater than 50◦. However, their explanation relates to the case of op-tically thin clouds producing multiple scattering so that the angular distribution of the diffuse radiation field becomes nearly isotropic. They found that the cosine weighting for the direct beam remained unchanged, but the small amount of di-rect radiation that is turned into diffuse radiation experiences (at large SZA) higher cosine weighting. In other words, the actual total flux will not be enhanced through a surface nor-mal to the sun’s direction, but only through a horizontal sur-face. The statistics of their data set confirmed that enhanced cases, in association with thin clouds, occurred mainly at large SZA. These findings may not apply when considering only UV radiation.
As mentioned in the introduction, Sabburg and Wong (2000a) previously postulated that UV enhancement might be due to a combination of refraction and scattering of di-rect and diffuse sunlight when the solar disk is obscured by cirrus cloud or haze, but still visible. Refraction of the di-rect sunlight could take place through haze or high altitude cirrus cloud across the sun, followed by forward scattering of this refracted light from the edges of lower altitude cloud, such as cumulus. Multiple scattering between the lower and upper altitude cloud layers could account for further UV en-hancement, particularly when the scattering is directed back towards the cirrus cloud across the sun. Additional enhance-ment would result from an increase in diffuse UV irradiance with increasing cloud amount over the whole sky caused by a combination of Mie scattering from cloud droplets and sub-sequent Rayleigh scattering of the visible and shorter UV wavelengths.
The current results do not confirm which of the above mechanisms (including those accounting for wavelength de-pendency effects), is responsible for UV enhancement. How-ever, we speculate it is a combination of both real cloud enhancement and problems with the measurement process. Solving the measurement problems would probably reduce the frequency and magnitude of real cases of enhancement.
It was found that the new “Enhanced” algorithm correctly classified 72% of all UV enhanced scans (with 60% correctly classified as un-enhanced scans), and 77% of the enhanced scans were classified as non-uniform, based on the ‘Uniform’ algorithm. Approximately 65% contained more than 50% total cloud cover with 67% containing greater than 2% of thin cloud, but no consistency could be found in the “regional” distribution of the cloud around the sun in the image.
By examining the dates and times of all enhanced scans it was found that 9 (16%), persisted longer than one scan, with 5 lasting (or at least reoccurring), longer than 2 scans, 1 over 3 scans, 2 over 4 scans and 1 lasted for over 5 scans from 1:00 to 1:20 pm on February 7 (that is a total of 25 min), with corresponding irradiance ratios of 1.28, 1.33, 1.28, 1.26 and 1.29.
3.4 Additional wavelength dependency
To investigate the wavelength dependency of the current dataset, each of the 57 UV enhanced scans were analysed to establish wavelength “trends” and their corresponding phys-ical parameters. Figure 5 presents a graph of the ratio of irradiance for cloudy UV scans to corresponding clear UV scans, of similar SZA, versus wavelength with correspond-ing before and after TSI images. This graph represents the three main types of data “trends” that were found. Table 1 summarises the corresponding parameter data for these three cases as well as the average and range of the remaining 54 scans. The “general wavelength slope” is the actual slope of the linear line of best fit to the data, with values of 0.4, 3.0 and 2.5, respectively, for a), b) and c). The r2value of this linear best fit gives some measure of the occurrence “dips” and “humps” appearing in the data throughout the wave-length range, e.g. a large r2 would indicate less scatter and thus less dips and humps (0.02, 0.71 and 0.72, respectively). Although not conclusive, at least in the case of the three ex-amples illustrated in Fig. 5a, b, c (which all occurred during the same day) it appears that both upward (25% of all en-hanced scans), downward (18%) and wavelength trends in between these two cases (57%) are all possible. Table 1 indi-cates that the average trend is −1.1, which can be considered as in between but tending towards downward.
As mentioned in the introduction cases of increasing “trends” of wavelength dependence have been published for spectra below clouds. This may be a result of the proportion of aerosol particles outside of the cloud compared to inside of the clouds, as was found by Erlick et al. (1998), when their results indicated that the outside aerosols have a greater influence on both magnitude and the shape of the transmis-sion spectrum. Although they did not report cases of UV en-hancement they did present downward wavelength trends, as did Crawford et al. (2003), for a number of non-enhanced cases. From a study of the reduction of radiation below cloud, Mayer et al. (1998) conclude that the transfer of radia-tion through cloud is influenced nonlinearly mainly by three
J. M. Sabburg and C. N. Long: Improved sky imaging for studies of enhanced UV irradiance 2551
Table 1. Physical properties corresponding to 3 cloud enhanced UV scans (Fig. 5) and summary of remaining enhanced UV scans.
Property/Image Flat Falling Rising Remaining scans (a) (b) (c) Average Range Average UV ratio 1.27 1.26 1.23 1.15 1.40–0.42 SZA (◦) 27 18 22 23.8 39.2–12.1 Sunny Yes Yes Yes Yes (1) 1 Opaque (%) 96 99 86 64 100–5 Thin (%) 2 0 2 4 14–0 Uniform Yes Yes No No (0.24) 1–0 Cloud Proximity 100/100/100/100 98/99/100/100 52/69/90/99 60/56/55/60 100–0 (Inner/middle/outer/extreme)
Enhanced Flag Yes No Yes Yes (0.70) 1–0 General Wavelength Slope 0.4 −3.0 2.5 −1.1 2.7 to −13 (×10−3)
r2 0.02 0.71 0.72 0.25 0.82–0
parameters: the AOD, the optical depth of the cloud itself and the amount of ozone within the cloud, determined by the ver-tical position of the cloud. Wenny et al. (2001) conclude that at shorter wavelengths, ozone becomes the dominant factor shaping the total optical depth. This accounts for an average of nearly 70% of the total optical depth at 300 nm. At longer wavelengths, the aerosol and Rayleigh terms are increasingly important contributors to the total optical depth, accounting for all the total optical depth at 368 nm where ozone absorp-tion is minimal. Kirchhoff et al. (2002) has found an in-creasing wavelength dependence of AOD between 306.3 and 320.1 nm.
Careful inspection of the before and after images in Fig. 5 (the visibility of the sun), suggests that the downward “trend” of UV intensity with wavelength might correspond with a de-crease in solar brightness during the end of a scan, 5(b). This is the most likely cause for the downward wavelength trend, but further research is required to confirm this. Similarly, an upward “trend” could correspond to a slight increase in brightness during the end of the scan, 5(c). Thus, it is possi-ble that to some extent these trends are the result of the finite amount of time it takes to complete a scan under change-able cloud conditions. The determination of the extent of this “cloud morphology” influence will be undertaken in fu-ture research using higher time resolution sky imager data in an attempt to record the actual changes in cloud influence during the scans.
4 Conclusions
This paper has analysed UVI and spectral UV irradiance data to suggest a possible relationship between UV enhancement and the occurrence of near-sun cloud brightness for SZA less than 39◦. Additionally, wavelength dependencies that can occur during UV enhancement measurements due to cloud
at a southern hemisphere subtropical site have been reported. New image processing algorithms, relating to cloud amount at different spatial positions and the visible brightness of clouds surrounding the sun, have not been able to distin-guish the three types of wavelength “trends” found. From inspection of over 600 images it would appear that the new algorithms processed the images very well. However, we be-lieve that the difference in scan times of our work and in some earlier studies is contributing to the differences found in comparing our results to the earlier work. It is therefore necessary to include higher temporal resolution sky image capture and analysis to better document the variability dur-ing the scans in any future studies. In addition an indepen-dent check of the obstruction of the solar disk by cloud and haze during a UV scan, particularly at larger SZA, is neces-sary to rule out any manifestation of the measuring process causing the “trends”. Future research will also establish al-ternative methods of measuring UVI, (e.g. based on methods such as Sabburg and Wong, 2000b), possibly including UVI enhancements. Transportable image analysis, such as geo-metric corrections, will be investigated for different types of sky camera.
Acknowledgements. The authors acknowledge A. Parisi (see
Fig. 1), the technical staff in Physics and the Sciences workshop, USQ, for their assistance in this project, NASA/Goddard Space Flight Center for TOMS ozone data, and the funding provided by the Australian Research Council (ARC) for the spectroradiometer and USQ for the TSI. Special thanks to N. Downs of USQ for his dedicated work in coding the sky camera algorithms and evaluating their uncertainties. C. N. Long acknowledges the support of the Climate Change Research Division of the U.S. Department of Energy as part of the Atmospheric Radiation Measurement (ARM) Program. J. Sabburg acknowledges the EGU for a Keith Runcorn Travel Award for Non-Europeans for financial assistance attending EGU2004.
Edited by: Q. Fu
References
Alados-Arboledas, L., Alados, I., Foyo-Moreno, I., Olmo, F. J., and Alcantara, A.: The influence of clouds on surface UV erythemal irradiance, Atmos. Res., 66(4), 273–290, 2003.
Beaubien, M. C. and Bisberg, A.: A New CCD-based Instrument for the automatic determination of cloud cover, AMS Confer-ence, Phoenix, Arizona, 1998.
Crawford, J., Shetter, R. E., Lefer, B., Cantrell, C., Junkermann, W., Madronich, S., and Calvert, J.: Cloud impacts on UV spectral ac-tinic flux observed during the International Photolysis Frequency Measurement and Model Intercomparison (IPMMI), J. Geophys. Res., 108(D14), Art. No. 8545, 2003.
Eckstein, E., Perner, D., Bruhl, C., and Trautmann, T.: A new ac-tinic flux 4 pi-spectroradiometer: instrument design and appli-cation to clear sky and broken cloud conditions, Atmos. Chem. Phys., 3, 1965–1979, 2003,
SRef-ID: 1680-7324/acp/2003-3-1965.
Erlick, C., Frederick, J. E., Saxena, V. K., and Wenny, B. N.: At-mospheric transmission in the ultraviolet and visible: Aerosols in cloudy atmospheres, J. Geophys. Res., 103, 31 541–31 556, 1998.
Fioletov, V. E., Kerr, J. B., Wardle, D. I., Krotkov, N., and Herman, J. R.: Comparison of Brewer ultraviolet irradiance measurements with Total Ozone Mapping Spectrometer satellite retrievals, Opt. Eng., 41, 3051–3061, 2002.
Goodman, A. H. and Henderson-Sellers, A.: Cloud detection and analysis: A review of recent progress, Atmos. Res., 21, 203–228, 1988.
Horvath, G., Barta, A., Gal, J., Suhai, B., and Haiman, O.: Ground-based full-sky imaging polarimetry of rapidly changing skies and its use for polarimetric cloud detection, App. Opt., 41(i3), 543– 559, 2002.
Kassianov, E. I. , Long, C. N., and Ovtchinnikov, M.: ARM Total Sky Imager: Monte Carlo Simulations, 12th ARM Science Team Meeting Proceedings, St. Petersburg, Florida, April 8–12, 2002. Kerr, J. B. and Seckmeyer, G. (Lead Authors), Bais, A. F., Bern-hard, G., Blumthaler, M., Diaz, S. B., Krotkov, N., Lubin, D., McKenzie, R. L., Sabziparvar, A. A., and Verdebout, J.: Surface ultraviolet radiation: Past and future, Chapter 5 in Scientific As-sessment of Ozone Depletion: 2002, Global Ozone Research and Monitoring Project, Report No. 47, Geneva, 2003.
Kirchhoff, V. W. J. H., Silva, A. A., and Pinheiro, D. K.: Wave-length dependence of aerosol optical thickness in the UV-B band, Geophys. Res. Lett., 29(12), doi:10.1029/2001GL014141, 2002. Kylling, A., Albold, A., and Seckmeyer, G.: Transmittance of a cloud is wavelength-dependent in the UV range: Physical inter-pretation, Geophys. Res. Lett., 24(4), 397–400, 1997.
Long, C. N. and DeLuisi, J. J.: Development of an Automated Hemispheric Sky Imager for Cloud Fraction Retrievals, Proc. 10th Symp. On Meteorological Observations and Instrumenta-tion, Jan. 11–16, 1998, Phoenix, Arizona, Amer. Meteor. Soc., 171–174, 1998.
Long, C. N. and Ackerman, T. P.: Identification of Clear Skies from Broadband Pyranometer Measurements and Calculation of Downwelling Shortwave Cloud Effects, J. Geophys. Res., 105, D12, 15 609–15 626, 2000.
Long, C. N., Slater, D. W., and Tooman, T.: Total Sky Imager (TSI) Model 880 Status and Testing Results, Atmospheric Radiation Measurement Program Technical Report, ARM TR-004, 2001. Mayer, B., Kylling, A., Madronich, S., and Seckmeyer, G.:
En-hanced absorption of UV radiation due to multiple scattering in clouds: Experimental evidence and theoretical explanation, J. Geophys. Res., 103, 31 241–31 254, 1998.
Parisi, A. V., Sabburg, J., and Kimlin, M. J.: Scattered and Filtered Solar UV Measurements, in: Advances in Global Change Re-search, Kluwer Academic Publishers, Dordrecht, 2004. Parisi, A. V. and Downs, N.: Cloud Cover and Eye Damaging
UV Exposures, Int. J. Biomet., doi:10.1007/s00484-004-0213-7, 2004.
Pfister, G., McKenzie, R. L., Liley, J. B., Thomas, A., Forgan, B. W., and Long, C. N.: Cloud Coverage Based on All-Sky Imag-ing and Its Impact on Surface Solar Irradiance, J. Appl. Meteor., 42(10), 1421–1434, 2003.
Sabburg, J.: Quantification of Cloud around the Sun and its corre-lation to Global UV Measurement, PhD thesis, Queensland Uni-versity of Technology, Brisbane, Australia, 2000.
Sabburg, J. M., Parisi, A. V., and Kimlin, M. G.: Enhanced spectral UV irradiance: a 1 year preliminary study, Atmos. Res., 66(4), 261–272, 2003.
Sabburg, J., Rives, J. E., Meltzer, R. S., Taylor, T., Schmalzle, G., Zheng, S., Huang, N., Wilson, A., and Udelhofen, P. M.: Com-parisons of corrected daily-integrated erythemal UVR data from the U.S. EPA/UGA network of Brewer spectroradiometers with model and TOMS-inferred data, J. Geophys. Res., 107(D23), 4676, doi:10.1029/2001JD001565, 2002.
Sabburg, J. and Wong, J.: Evaluation of a Ground-Based Sky Cam-era System for Use in Surface Irradiance Measurement, J. Atmos. Oceanic Tech., 16(6), 752–759, 1999.
Sabburg, J. and Wong, J.: The effect of clouds on enhancing UVB irradiance at the earth’s surface: a one year study, Geophys. Res. Lett., 27(20), 3337–3340, 2000a.
Sabburg, J. and Wong, J.: Evaluation of a sky/cloud formula for estimating UV-B irradiance under cloudy skies, J. Geophy. Res., 105(D24), 29 685–29 692, 2000b.
Shields, J. E., Johnson, R. W., Karr, M. E., Burden, A. R., and Baker, J. G.: Daylight Visible / NIR Whole Sky Imagers for Cloud and Radiance Monitoring in Support of UV Research Pro-grams, International Symposium on Optical Science and Tech-nology, SPIE, Ultraviolet Ground and Space-based Measure-ments, Models, and Effects III, San Diego, USA, August 4–6, 155–166 2003.
Wenny, B. N., Saxena, V. K., and Frederick, J. E.: Aerosol op-tical depth measurements and their impact on surface levels of ultraviolet-B radiation, J. Geophys. Res., 106(D15), 17 311– 17 319, 2001.