HAL Id: hal-03027619
https://hal-amu.archives-ouvertes.fr/hal-03027619
Submitted on 27 Nov 2020
HAL is a multi-disciplinary open access
archive for the deposit and dissemination of
sci-entific research documents, whether they are
pub-lished or not. The documents may come from
teaching and research institutions in France or
abroad, or from public or private research centers.
L’archive ouverte pluridisciplinaire HAL, est
destinée au dépôt et à la diffusion de documents
scientifiques de niveau recherche, publiés ou non,
émanant des établissements d’enseignement et de
recherche français ou étrangers, des laboratoires
publics ou privés.
evolution in the [C ii]-SFR relation over the last 13 Gyr
D. Schaerer, M. Ginolfi, M. Béthermin, Y. Fudamoto, P. A. Oesch, Olivier Le
Fèvre, A. Faisst, P. Capak, P. Cassata, J. Silvermann, et al.
To cite this version:
D. Schaerer, M. Ginolfi, M. Béthermin, Y. Fudamoto, P. A. Oesch, et al.. The ALPINE-ALMA [C
ii] survey: Little to no evolution in the [C ii]-SFR relation over the last 13 Gyr. Astronomy and
Astrophysics - A&A, EDP Sciences, 2020, 643 (A3). �hal-03027619�
May 27, 2020
The ALPINE-ALMA [C
ii
] survey:
Little to no evolution in the [C
ii
]–SFR relation over the last 13 Gyr
D. Schaerer
1, 2, M. Ginolfi
1, M. Béthermin
3, Y. Fudamoto
1, P.A. Oesch
1, O. Le Fèvre
3, A. Faisst
4, P. Capak
4, 5, 6,
P. Cassata
7, 8, J.D. Silverman
9, 10, Lin Yan
11, G.C. Jones
12, 13, R. Amorin
14, 15, S. Bardelli
16, M. Boquien
17,
A. Cimatti
18, 19, M. Dessauges-Zavadsky
1, M. Giavalisco
20, N.P. Hathi
21, S. Fujimoto
5, 6, E. Ibar
22, A. Koekemoer
21,
G. Lagache
3, B.C. Lemaux
23, F. Loiacono
18, 19, R. Maiolino
12, 13, D. Narayanan
5, 24, 25, L. Morselli
7, 8, Hugo
Méndez-Hernàndez
22, F. Pozzi
18, D. Riechers
26, 27, M. Talia
18, 16, S. Toft
5, 6, L. Vallini
28, D. Vergani
16, G. Zamorani
16,
and E. Zucca
16(Affiliations can be found after the references) Received 29 january 2020; accepted 29 april 20202
ABSTRACT
The [C ii] 158 µm line is one of the strongest IR emission lines, which has been shown to trace the star formation rate (SFR) of galaxies in the nearby Universe, and up to z ∼ 2. Whether this is also the case at higher redshift and in the early Universe remains debated. The ALPINE survey, which targeted 118 star-forming galaxies at 4.4 < z < 5.9, provides a new opportunity to examine this question with the first statistical dataset. Using the ALPINE data and earlier measurements from the literature, we examine the relation between the [C ii] luminosity and the SFR over the entire redshift range from z ∼ 4 − 8. ALPINE galaxies, which are both detected in [C ii] and in dust continuum, show good agreement with the local L([CII])–SFR relation. Galaxies undetected in the continuum by ALMA are found to be over-luminous in [C ii]when the UV SFR is used. After accounting for dust-obscured star formation, by an amount of SFR(IR)≈SFR(UV) on average, which results from two different stacking methods and SED fitting, the ALPINE galaxies show an L([CII])–SFR relation comparable to the local one. When [C ii] non-detections are taken into account, the slope may be marginally steeper at high-z, although this is still somewhat uncertain. When compared homogeneously, the z > 6 [C ii] measurements (detections and upper limits) do not behave very differently to the z ∼ 4 − 6 data. We find a weak dependence of L([CII])/SFR on the Lyα equivalent width. Finally, we find that the ratio L([CII])/LIR∼ (1 − 3) × 10−3for the ALPINE sources, comparable to that of ‘normal’ galaxies at lower redshift. Our analysis, which includes the largest sample (∼ 150 galaxies) of [C ii] measurements at z > 4 available so far, suggests no or little evolution of the [C ii]–SFR relation over the last 13 Gyr of cosmic time.
Key words. Galaxies: high redshift – Galaxies: evolution – Galaxies: formation – Galaxies: star formation
1. Introduction
The [C ii] 158 µm line is an important coolant of the neutral interstellar medium (ISM), one of the strongest emission lines in the infrared (IR), which is also emitted relatively close to the peak of dust continuum emission. Although [C ii] has long been known to originate from Hii regions, diffuse neutral and ionised ISM, and from photodissociation regions (e.g. Wolfire et al. 1995; Hollenbach & Tielens 1999), it has been found to trace star formation. In particular, the [C ii] luminosity has been shown to correlate well with the total star formation rate (SFR) of galaxies in our Galaxy, nearby galaxies, and up to z ∼ 2 (see e.g. Pineda et al. 2014; Herrera-Camus et al. 2015; de Looze et al. 2011; De Looze et al. 2014, and references therein). Other studies have recently stressed that [C ii] could alternatively be used as a tracer of molecular gas (see e.g. Nordon & Sternberg 2016; Glover & Smith 2016; Fahrion et al. 2017; Zanella et al. 2018).
Since [C ii] 158 µm can be observed from the cosmic noon (z ∼ 2) out to very high redshift (z ∼ 7 − 8 Inoue et al. 2016) with ALMA, and potentially even into the cosmic dark ages with other facilities (cf. Carilli et al. 2017), this line has often been targeted. The goal is to use it as a probe of the ISM properties in distant galaxies, as a measure of the total SFR (unaffected by
the possible presence of dust), and for other purposes, including redshift confirmation for galaxies in the epoch of reionisation.
The first attempts to measure [C ii] 158 µm in galaxies at z > 6 with ALMA have mostly been unsuccessful, essen-tially yielding non-detections, both for Lyα emitters (LAEs) and Lyman-break galaxies (LBGs) (e.g. Ouchi et al. 2013; Ota et al. 2014; Maiolino et al. 2015). Subsequent observations have de-tected [C ii] in LAEs and LBGs, both in blank fields and behind lensing clusters, finding several [C ii]-underluminous galaxies at high-z and suggesting a large scatter in L([CII])-SFR (see e.g. Maiolino et al. 2015; Willott et al. 2015; Pentericci et al. 2016; Bradaˇc et al. 2017; Carniani et al. 2018) compared to the lo-cal samples (De Looze et al. 2014). On the other hand, Riech-ers et al. (2014) and Capak et al. (2015) successfully detected several z ∼ 5 − 6 star-forming galaxies, revealing relatively broad [C ii] lines and a good agreement with the local [C ii]– SFR relation. Reanalysing the existing [C ii] detections and non-detections of z ∼ 6−7 galaxies, Matthee et al. (2019) showed that the available data appears compatible with the De Looze et al. (2014) relation for SFR>∼ 30 M yr−1and may deviate from that
of lower SFRs, if broader [C ii] lines are assumed for the non-detections and the data are consistently compared. Conversely, using very similar data, Harikane et al. (2018) and Harikane et al. (2019) concluded that z= 5−9 galaxies show a clear [C ii] deficit with respect to the local [C ii]–SFR relation, and that this deficit
increases with increasing Lyα equivalent width. Manifestly, no consensus has yet been reached on these questions, and it is un-clear if the [C ii] 158 µm line remains a good tracer of star for-mation at z > 4 or if there is a quantitative change compared to the observations at low redshift.
To make progress on these issues, we used the ALMA Large Program to INvestigate C+ at Early Times (ALPINE) survey, which targets 118 ‘normal’ (i.e. main sequence) star-forming galaxies with known spectroscopic redshifts at 4.4 < z < 5.9, and which is designed to provide the first statistical dataset mak-ing it possible to determine the observational properties of [C ii] emission at high-z. The survey was recently completed and is described in detail in Le Fèvre et al. (2019), Bethermin et al. (2020), and Faisst et al. (2020). Our measurements, yielding 75 high-significance detections of [C ii] 158 µm and 43 non-detections, combined with the earlier [C ii] observations of 36 galaxies at z ∼ 6 − 9.11 from literature compilations, allow us to examine what is normal for high-z galaxies and shed new light on the above questions.
The paper is structured as follows. We briefly summarise the ALPINE [C ii] dataset and other measurements in Sect. 2. We then examine the behaviour of the [C ii] 158 µm luminos-ity with different SFR indicators, and we carefully compare the [C ii]–SFR observations of high-z galaxies to the reference sam-ple of De Looze et al. (2014) (Sect. 3). We combine the ALPINE dataset with the available [C ii] observations at z > 6 and exam-ine whether all high-redshift observations show the same picture and if the [C ii]–SFR relation is different in the early Universe (Sect. 3.3). Finally, we present the observed [C ii]-to-IR ratio in Sect. 4. We discuss the possible caveats and future improvements in Sect. 5. Our main results are summarised in Sect. 6, and we provide results to fits to different datasets in the Appendix. We assume a ΛCDM cosmology with ΩΛ = 0.7, Ωm = 0.3 and
H0 = 70 km s−1Mpc−1, and a Chabrier IMF (Chabrier 2003).
2. Observations and derived quantities
The ALMA Large Program to INvestigate [C ii] at Early times (ALPINE) survey, presented in Le Fèvre et al. (2019), has ob-served 118 ‘normal’ star-forming galaxies with known spectro-scopic redshifts at 4.4 < z < 5.9. The ALPINE sample also in-cludes seven galaxies (HZ1, HZ2, HZ3, HZ4, HZ5, HZ6/LBG-1, and HZ8) that were previously observed with ALMA by Riech-ers et al. (2014) and Capak et al. (2015). It currently constitues the largest sample of [C ii] observations at z ∼ 4 − 6.
Details of the ALPINE data reduction and statistical source properties are described in Bethermin et al. (2020), from which we used the [C ii] 158 µm line luminosities (L([CII]), 75 detec-tions with high significance, and 43 non-detecdetec-tions) and the dust continuum measurements (23 detections and 95 non-detections). The 158 µm rest-frame continuum fluxes have been converted to total IR luminosities, LIR, using an average empirically based
conversion from the 158 µm monochromatic continuum flux density to LIRas described in Bethermin et al. (2020). The
em-pirical template gives a conversion similar to a modified black body with a dust temperature of Td = 42 K, a dust opacity at
850 µm of k850 = 0.077 m2kg−1, and a grey-body power-law
exponent β= 1.5 (see e.g. Ota et al. 2014; Matthee et al. 2019). For galaxies undetected in [C ii], we used the ‘aggressive’ 3σ upper limits of L([CII]) reported in Bethermin et al. (2020), de-fined as three times the RMS of the noise in velocity-integrated flux maps obtained by collapsing a channel width of 300 km s−1centered around the expected spectroscopic redshift. We then
Fig. 1. Observed FWHM of the [C ii] 158 µm line as function of the [C ii] luminosity from ALPINE and other data from the literature (the compilation of z > 6 sources from Matthee et al. (2019) and available measurements for galaxies in the Zanella et al. (2018) compilation (z ∼ 0 − 6). The violet dashed line is a Tully-Fisher-like relation derived for high-z galaxies by Kohandel et al. (2019). The green solid line shows our best fit to the data.
rescaled these limits to reflect a more realistic (though less con-servative) distribution of full width half maximum (FWHM) of our [C ii]-undetected galaxies: motivated by the observed de-pendence of FWHM on L([CII]) shown in Fig. 11, we adopted FWHM= 150 km s−1, instead of the median of 252 km s−1of
the [C ii]-detected ALPINE galaxies (Bethermin et al. (2020)). As discussed in Bethermin et al. (2020), we note that by con-struction our 3 σ upper limits of L([CII]) can be underestimated if the sources are: (i) just below the detection threshold; (ii) spa-tially extended (larger than the beam-size, e.g.,& 100); and/or (iii)
show very broad line profiles (see e.g. Kohandel et al. 2019), where the two latter conditions are less likely to occur in less massive and less star-forming objects.
For galaxies undetected in continuum, we used the aggres-sive upper limits determined by Bethermin et al. (2020), using the same conversion from158 µm rest-frame continuum fluxes to total IR luminosity. Finally, we also used LIR values derived
from the IRX–β relation obtained by stacking of the ALPINE sources, as described in Fudamoto et al. (2020). In the absence of a direct detection of dust continuum emission, this is our pre-ferred method to correct for dust-obscured star formation.
From the rich dataset of ancillary photometric and spectro-scopic data, which is also available for the ALPINE sources (see Faisst et al. (2020) for details), we used the observed UV lumi-nosity (or equivalently the absolute UV magnitude M1500at 1500
Å). To compare our [C ii] data with other measurements and re-sults in the literature, we also used measurements of the Lyα equivalent widths, EW(Lyα), obtained from the rest-UV spectra of our sources, which were obtained during earlier spectroscopic observations with DEIMOS and VIMOS on the Keck and VLT telescopes. The spectra are discussed by Faisst et al. (2020). The Lyα measurements, available for 98 sources, are taken from Cas-sata et al. (2020), where a more detailed description of the Lyα properties is presented.
From the above-mentioned measurements of the UV and IR luminosities, we derived three ‘classical’ measures of star-formation rate, SFR(UV) uncorrected for attenuation, SFR(IR), and the total SFR(tot)=SFR(UV)+SFR(IR). We also used
esti-1 A linear fit to the data yields log(L([CII])/L
) = 2.24 × log(FWHM/(kms−1)+ 3.21.
0.0 0.5 1.0 1.5 2.0 2.5 3.0
log(SFR(tot)) [M /yr]
7.0 7.5 8.0 8.5 9.0 9.5 10.0 10.5log
(L
CII) [
L
]
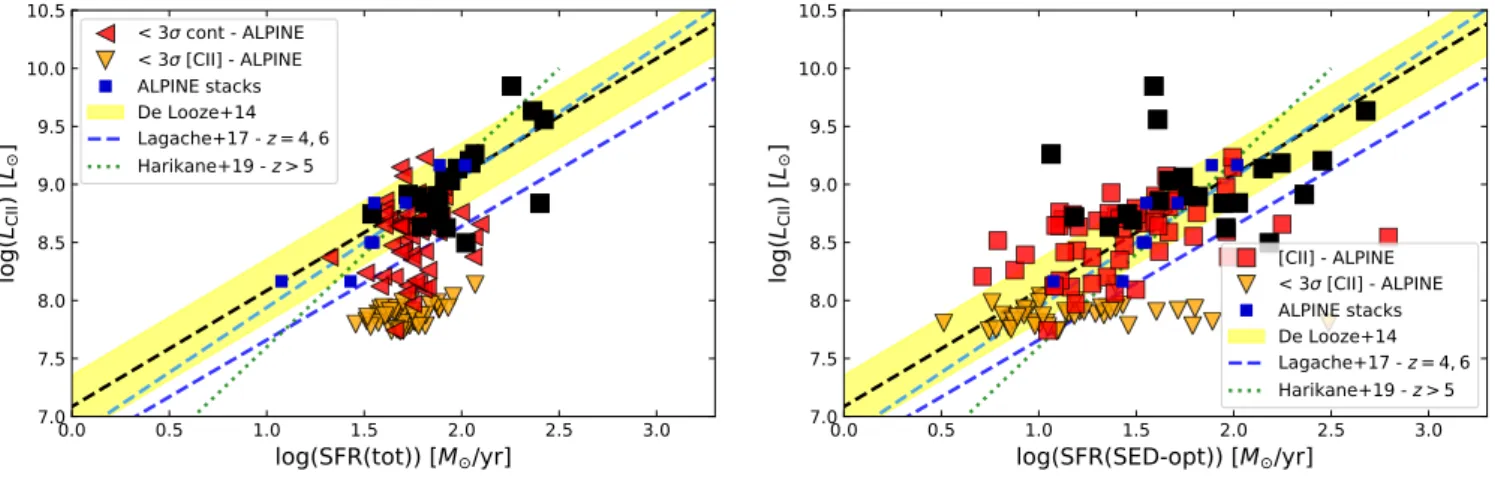
[CII] - ALPINE < 3 [CII] - ALPINE ALPINE stacks De Looze+14 Lagache+17 - z = 4, 6 Harikane+19 - z > 5Fig. 2. [C ii] as a function of UV or UV+IR-derived SFR for the z ∼ 4.5 ALPINE sources. Squares show the [C ii] detections, orange triangles the 3 σ upper limits. Black squares show galaxies with continuum de-tection (black filled squares show SFR(UV)+SFR(IR), empty squares the SFR(UV) of the same sources); red squares shows the SFR(UV) for the other (non-continuum-detected) ALPINE sources. Blue circles show the results from stacks of ALPINE sources in four bins of L([CII]) and two redshift bins, adapted from from Bethermin et al. (2020). The observations are compared to the [C ii]-SFR relations of local galax-ies determined by De Looze et al. (2014) adjusted to the Chabrier IMF by reducing the SFR by a factor of 1.06 (black dashed line), shown by the yellow band with a total width corresponding to 2σ. The green dot-ted line shows the relation fitdot-ted to observations of z ∼ 5 − 9 galaxies by Harikane et al. (2019). The fits from the models of Lagache et al. (2018) for redshifts spanning the range of the observations are shown by the two blue dashed lines.
mates of the total SFR, SFR(SED), obtained from the multi-band SED fits of Faisst et al. (2020). The different SFR measurements are all included in the ALPINE database2, where the data will be made public.
To allow a proper comparison of the L([CII])–SFR relation with the low-z galaxy sample of De Looze et al. (2014), we adopted the same conversion factors between LUV, LIR, and SFR
as the ones used in their paper. We note that the SFR(UV) cali-bration adopted by De Looze et al. (2014) agrees with the classi-cal one from Kennicutt (1998), when resclassi-caled to the same IMF. However, for the same IMF, their IR calibration, taken from Mur-phy et al. (2011), yields 30% (0.12 dex) higher SFR(IR) val-ues than the Kennicutt (1998) calibration. Finally, we rescaled the SFR(UV) and SFR(IR) values by a factor of 1.06 from the Kroupa IMF (used by De Looze et al. (2014)) to the Chabrier IMF, for consistency with the other ALPINE papers.3 We
high-light that we assume SFR(IR)=0 per default and unless other-wise stated for sources that are not detected in the continuum. This is discussed further below.
2 https://cesam.lam.fr/a2c2s/
3 In short, the final adopted SFR calibrations are: SFR(UV)/(M yr−1)= 8.24 × 10⁻²⁹L
ν, where Lνis in units of ergs/s/Hz, or equivalently SFR(UV)/(M yr−1)= 1.59 × 10⁻¹⁰LUV/L , where LUVis calculated at 1500 Å. And SFR(IR)/(M yr−1)= 1.40 × 10⁻¹⁰LIR/L .
3. Relations between the [C
ii
] 158µ
m luminosityand SFR indicators at
z ∼ 4 − 6
and higherredshift
3.1. Comparing L([CII]) with UV, IR, and SED-fit-based SFRs
As is often done for high-z galaxies, which are generally selected from the rest-UV and seldomly detected in the dust continuum, we first used a basic SFR indicator, SFR(UV) derived from the observed UV luminosity, which is available for the entire sam-ple, to obtain the L([CII])–SFR relation shown in Fig. 2. The ALPINE data is compared to average relation of the low-z Hii-galaxy/starburst sample from De Looze et al. (2014) as a refer-ence (hrefer-enceforth named the ‘local’ relation), which is often used in the literature. It includes 184 galaxies, shows a linear scal-ing between L([CII]) and SFR, and a scatter of 0.27 dex (see their Table 3).4While the [C ii] detections span a wide range be-tween L([CII]) ∼ 5 × 10⁷ L
and 5 × 10⁹L , SFR(UV) varies
less, thus resulting in a relatively steep relation between L([CII]) and SFR(UV). Compared to the local L([CII])–SFR correlation, the [C ii] luminosity of our sources appears higher, in contrast to several high-z (z >∼ 6) galaxies where [C ii] was found to be ‘under-luminous’, as mentioned in the introduction. It is more likely that the SFR is underestimated, as can be expected from dust attenuation of the UV light.
To correct for dust attenuation in the simplest way, in the same figure (Fig. 2) we plot the [C ii] measurements as a func-tion of the total SFR, adding the dust-attenuated SFR(IR) to SFR(UV) for the galaxies for which we detect emission from the dust continuum. Clearly, for the continuum-detected sources, the increase in SFR is significant, bringing them to fair agreement with the local L([CII])–SFR relation, as seen by the comparison with the left panel. This corresponds to galaxies with SFR(tot) >
∼ 30 M yr−1.
On average, however, the [C ii] luminosities of the 74 de-tected sources remain larger than expected from the local rela-tion of De Looze et al. (2014), by a factor ∼ 1.5 for the entire sample and a factor ∼ 2 for the sources that are not detected in the continuum (red squares in Fig. 2). Approximately 40% of the [C ii]-detected ALPINE galaxies are extended and classified as mergers from a morphological and kinematic analysis (Le Fèvre et al. (2019)). Excluding, for example, these mergers from the sample does not significantly change the deviation from the re-lation; on average, a shift by a factor 1.25 in SFR(tot) remains, compared to a factor 1.5 shift for the entire sample. For the merg-ers alone, the deviation is 0.28 dex, similar to that of several sources not detected in the continuum. From this, we conclude that even if there were systematic differences between mergers and galaxies in the local sample, this would probably not explain the observed deviation between the ALPINE dataset and the De Looze et al. (2014) relation. Obscured star formation, below our current detection threshold in the ALMA measurements, is prob-ably present in the majority of the ALPINE sample.
Bethermin et al. (2020) carried out stacking of the ALPINE sources in different bins of [C ii] luminosity, detecting thus the dust continuum in several of these bins, and hence measuring in particular the average dust-attenuated contribution SFR(IR). Af-ter conversion to the same SFR calibrations used here (cf. above) their results are shown in Fig. 2. The ALPINE stacking results show a good agreement with the local [C ii]–SFR relation,
indi-4 For comparison, their entire sample of 530 galaxies shows a larger scatter (0.42 dex) and a [C ii] 158 µm luminosity, which is lower by 0.07 dex for a given SFR.
0.0 0.5 1.0 1.5 2.0 2.5 3.0
log(SFR(tot)) [M /yr]
7.0 7.5 8.0 8.5 9.0 9.5 10.0 10.5log
(L
CII) [
L
]
< 3 cont - ALPINE < 3 [CII] - ALPINE ALPINE stacks De Looze+14 Lagache+17 - z = 4, 6 Harikane+19 - z > 5 0.0 0.5 1.0 1.5 2.0 2.5 3.0log(SFR(SED-opt)) [M /yr]
7.0 7.5 8.0 8.5 9.0 9.5 10.0 10.5log
(L
CII) [
L
]
[CII] - ALPINE < 3 [CII] - ALPINE ALPINE stacks De Looze+14 Lagache+17 - z = 4, 6 Harikane+19 - z > 5Fig. 3. Same as Fig. 2. Left: SFR(UV+IR) where the IR contribution now includes the 1-σ limit on LIR. Right: using the SFR derived from SED fitting of the stellar emission (rest-UV to optical).
0.0 0.5 1.0 1.5 2.0 2.5 3.0
log(SFR(tot)) [M /yr]
7.0 7.5 8.0 8.5 9.0 9.5 10.0 10.5log
(L
CII) [
L
]
[CII] - ALPINE < 3 [CII] - ALPINE ALPINE stacks De Looze+14 Lagache+17 - z = 4, 6 Harikane+19 - z > 5Fig. 4. Same as Fig. 2 using SFR(UV+IR). Here, SFR(IR) is derived from the observed UV slope and luminosity using the ALPINE IRX-β relation obtained from stacking (Fudamoto et al. 2020). The [C ii]--detected galaxies follow the local relation well.
cating that some correction for dust-obscured star formation is necessary even for the continuum undetected galaxies, and espe-cially those at the low L([CII]) range.
Regrettably, the upper limits on the IR continuum fluxes of the individual ALPINE sources are not sufficiently constrain-ing. Even if we use the aggressive 1σ limits to determine a limit on hidden star formation by summing SFR(UV) and the SFR(IR) limit, we obtain the SFR(tot) limits shown in Fig. 3 (left), which are mostly in the range of SFR(tot)<∼ 40 − 100 M
yr−1. Clearly, tighter constraints are desirable to examine if/how
the high-z galaxies do or do not deviate from the local [C ii]–SFR relation. Fitting the SED provides one way to account for this. Using tihe results from the multi-band SED fitting results dis-cussed in Faisst et al. (2020) and assuming a Calzetti attenuation law, reduces the apparent [C ii] excess found when not account-ing for dust-obscured star formation. As shown in Fig. 3 (right), the mean offset between the local L([CII])–SFR relation and the ALPINE data ([C ii] detections only) is then reduced to 0.06 dex, although the scatter around the local relation is quite large (0.40 dex). However, we note that a comparison using SED-based SFR values with the relations established by De Looze et al. (2014) would be methodologically inconsistent, since these authors use simple (UV and IR) SFR calibrations, whereas SED fitting
al-lows for varying star formation histories, different ages, etc., which may not yield compatible results and is known to give a larger scatter (see e.g. Wuyts et al. 2011; Schaerer et al. 2013). In any case, all the methods illustrated here show that most, if not all of the z ∼ 4 − 6 galaxies included in the ALPINE sample must suffer from some dust attenuation.
3.2. The [C ii]–SFR relation accounting for hidden SF in z ∼4 − 6 galaxies
We now proceed to account for hidden SF in all individual ALPINE galaxies in the best possible and consistent way to com-pare the [C ii]–SFR relation with lower redshift data. To do this, we used the average IRX–β relation derived by Fudamoto et al. (2020) for the ALPINE sample from median stacking of the con-tinuum images in bins of the UV slope β. These authors found an IRX–β relation, which is close to but below the relation expected for the SMC attenuation law, with little evolution across the red-shift range of the ALPINE sample. We applied their mean IRX–β relations to each individual source for which the dust continuum had not been detected, thus yielding a predicted LIR5and hence
a corresponding SFR(IR), using the same assumptions as for the rest of the sample. For continuum-detected galaxies, we used the standard SFR(IR) values, shown above.
The result is illustrated in Fig. 4 showing a very small o ff-set from the local relation (−0.05 dex) and a scatter of 0.28 dex around it (for the [C ii] detections). In other words, taking into account a relatively small correction for hidden SF, which is compatible with our continuum non-detections and the IRX–β relation, the ALPINE [C ii]-detected galaxies nicely follow the same L([CII])–SFR relation as low-redshift galaxies.
Now, if we include the ‘agressive’ [C ii] non-detections and fit the data with a linear relation of the form
log(L([CII])/L )= a + b × log(SFR/M yr−1), (1)
using a Bayesian fit including censored data6, we obtain a slope
that is marginally steeper than the local relation (1.17 ± 0.12, the results from different fits are given in the Appendix). However,
5 We note that the L
IRvalues predicted in this way are below the con-servative upper limits determined from the individual non-detections.
6 We follow the method of Kelly (2007) implemented in the python package linmix, https://github.com/jmeyers314/linmix. The method allows for uncertainties in one quantity, here L([CII]).
0.0 0.5 1.0 1.5 2.0 2.5 3.0
log(SFR(tot)) [M /yr]
7.0 7.5 8.0 8.5 9.0 9.5 10.0 10.5log
(L
CII) [
L
]
[CII] - ALPINE < 6 [CII] - ALPINE ALPINE stacks Bayesian fit (all data) Lagache+17 - z = 4, 6 Harikane+19 - z > 5Fig. 5. Same as Fig. 4 for ALPINE sources, but adopting conservative upper limits for the [C ii] non-detections (two times the agressive 3σ up-per limits). The Bayesian linear fit to all the measurements (detections and upper limits) is shown by the dark green lines/band, which also il-lustrates the probability distribution of the fit. The fit yields a slope of 0.96 ± 0.09, compatible with unity, and a small but insignificant offset (by ∼ −0.03 dex) with respect to the local relation.
adopting more conservative upper limits for L([CII]), for exam-ple the ‘secure’ limits7from Bethermin et al. (2020), which are
typically less deep by a factor of two, our fits including censored data yields a slope of 0.96 ± 0.09, compatible with unity, and slightly offset (by ∼ −0.03 dex) with respect to the local relation. From this we conclude that main sequence galaxies at z ∼ 4 − 6 may show the same L([CII])–SFR relation as low redshift galax-ies or a relation which is somewhat steeper (with an exponent ∼ 1.2). More firm statements are difficult to make at the present stage, until [C ii] non-detections and the exact amount of dust-obscured star formation are better quantified.
3.3. Is there a universal behaviour of L([CII]) at z > 4? We now examine how the ALPINE [C ii] measurements of z ∼4 − 6 galaxies compare with the other available observations at even higher redshifts. To do this, we use the recent compila-tion of Matthee et al. (2019), which includes 25 reported ALMA [C ii] observations of galaxies with known spectroscopic red-shifts between z= 6.0 and z = 7.212. Importantly, Matthee et al. (2019) recomputed [C ii] non-detection limits using empirically-motivated [C ii] line widths8. Furthermore they have uniformly
re-derived SFR(UV) and SFR(IR) from the observations, assum-ing a modified black body with Td = 45 K. We use their derived
properties, after rescaling them to the IMF and SFR(IR) cali-brations adopted in this paper (see Sect. 2). To this we add 11 measurements (6 detections, 5 upper limits) of galaxies between z = 6.0 and 9.11 from Harikane et al. (2019), who report three new observations and eight others not included in the Matthee et al. (2019) compilation. For consistency, we used the SFR(UV) and SFR(IR) values, and we carefully rescaled their results to a single, consistent IMF and to the same SFR(IR) calibration.
Fi-7 Secure limits are calculated by summing the 3 σ rms of the noise to the highest flux measured in 1 arcsec around the phase centre in visibility-tapered velocity-integrated flux maps (see Bethermin et al. (2020) for more details).
8 They use FWHM= −1215 − 66 × M
UVkm s−1, translating to a min-imum FWHM= 123 km s−1
for the UV-faintest [C ii] non-detected galaxy in their sample (Matthee, private communication).
0.0 0.5 1.0 1.5 2.0 2.5 3.0
log(SFR(tot)) [M /yr]
6.5 7.0 7.5 8.0 8.5 9.0 9.5 10.0 10.5log
(L
CII) [
L
]
[CII] - ALPINE < 3 [CII] - ALPINE ALPINE stacks z=6-9 Lagache+17 - z = 4, 6 Harikane+19 - z > 5Fig. 6. [C ii]–SFR relation combining the ALPINE sample and observa-tions of z ∼ 6 − 9 galaxies taken from the literature. The z > 6 data, after proper uniformisation, are plotted with pink symbols (circles for detec-tions, and triangles for upper limits). The SFR of all sources includes an SFR(IR) contribution, determined from the observed dust contin-uum or from the IRX–β relation if undetected. All [C ii] non-detections are illustrated by triangles, showing 3σ (aggressive) upper limits. The Bayesian linear fit to all the z > 4 measurements (detections and upper limits) is shown by the dark green lines/band. The slope is somewhat steeper than unity: 1.28 ± 0.10.
101 102
EW(Ly ) [Å]
6.0 6.5 7.0 7.5 8.0 8.5log
(L
CII/S
FR
(to
t))
[L
/(M
/yr
]]
[CII] - ALPINE < 3 [CII] - ALPINE z~6-7Bayesian fit (all data) De Looze+14 Harikane+19 - z > 5
Fig. 7. L([CII])/SFR(tot) as a function of the rest-frame Lyα equivalent width of the ALPINE sources and z ∼ 6 − 7 galaxies taken from the literature (pink symbols: circles for detections, and triangles for upper limits). The dotted line shows the fitting relation obtained by Harikane et al. (2018) for a compilation of z ∼ 5.7 − 7 galaxies, the horizontal line the average value from the local relation. The green lines/band show the fit to the data; the resulting slope is −0.11 ± 0.06, indicating a weak dependence on EW(Lyα).
nally, for sources that are not detected in the dust continuum, we corrected for hidden SF by applying the IRX–β relation de-rived at z ∼ 5.5 from the ALPINE sample when the UV slope is reported. For the majority of the galaxies, the correction turns out to be small, since their UV slope is fairly blue. The data are plotted Fig. 5.
Interestingly, most of the known z >∼ 6 galaxies largely follow the same behaviour/trend as the ALPINE galaxies. At SFR(tot)>∼ 30M yr−1, very few points deviate by more than 1σ
our results and those shown in Harikane et al. (2019) are ex-plained by several effects: by our use of a single IMF consistent with the De Looze et al. (2014) relation, a consistent use of cal-ibrated SFR determinations for all sources (no SED-based SFR as for some of their sources) following Matthee et al. (2019), and finally by the adoption of conservative line widths to determine upper limits on L([CII]).
[C ii] is undetected in a significant number of galaxies at SFR<∼ 30M yr−1. Assuming a FHWM= 150 km s−1 for the
ALPINE sources and the 15 upper limits from the z > 6 data discussed above, we find that the deepest 3σ upper limits are log(L([CII])/L ) < 7.8 for the bulk of the data. While a fraction
of those are well within the scatter around the ‘local’ De Looze et al. (2014) relation, several are probably below this, which pushes the average L([CII])/SFR ratio of both the ALPINE sam-ple and the full high-z galaxy samsam-ple to log(L([CII])/)SFR≈ 6.85 L /M yr−1, approximately 0.2 (0.1) dex lower than the
reference value from De Looze et al. (2014) for the Hii/starburst (complete) galaxy samples (see also Fig. 7). Two non-detections at SFR< 30M yr−1are strongly underluminous in [C ii]
com-pared to the rest of the sample: these are two lensed galaxies at z> 8, A2744-YD4 at z = 8.382 and MACS1149-JD1 at z = 9.11 observed by Laporte et al. (2019), which were previously de-tected by ALMA in the [O iii] 88µm line by Laporte et al. (2017) and Hashimoto et al. (2018). On the other hand, another [O iii]-detected lensed z= 8.312 galaxy (MACS0416-Y1 from Tamura et al. 2019) is detected in [C ii] and follows the observed trend well.
To quantify this behaviour again, we use the Bayesian fit including censored data. The results including the uncertainties and upper limits on L([CII]) are shown by the green lines/band in Fig. 6. The fit shows that the inclusion of the upper limits primar-ily leads to a somewhat steeper (super-linear) slope (1.28 ± 0.1) in the L([CII])–SFR relation for galaxies at z > 4, and to an overall (but slight) decrease of the normalisation, for instance to a lower [C ii] luminosity on average at a given SFR, as already mentioned and shown in Fig. 7. Overall, the observational data shows a behaviour that is quite comparable to the mean L([CII])– SFR relations predicted by the models of Lagache et al. (2018) between z = 4 and z = 6. The fit to the data shown in Fig. 3.2 is also similar to the mean relation obtained from the re-cent simulations of high-z galaxies by Arata et al. (2020), who find a somewhat steeper slope of 1.47. In contrast, the cosmo-logical plus radiative transfer simulations of Leung et al. (2020) for z ∼ 6 galaxies predict a L([CII])–SFR relation with, on aver-age, significantly lower [C ii] luminosities than the observational data shown here. Furthermore, the slope of their best-fit relation (0.66 ± 0.01) is flatter than unity and than those found in our study.
Interestingly, with the enlarged sample (ALPINE and z > 6 galaxies) our fits yield slopes steeper than unity using both op-tions for the [C ii] upper limits (agressive versus conservative; cf. above). This result is mostly driven by a few additional data points at low L([CII]) and low SFR, which have low uncertain-ties on L([CII]) and thus a fairly strong leverage. Whether these points are truly representative of the bulk of the population of fainter galaxies or ‘outliers’ remains to be confirmed with new observations probing this regime.
Overall, we conclude that the [C ii] measurements (detec-tions and upper limits) of star-forming galaxies at z ∼ 4−8 follow a unique relation between L([CII]) and SFR(UV)+SFR(IR) quite well over nearly two orders of magnitude in the [C ii] luminos-ity. This holds for a wide variety of galaxy types (LAEs, LBGs primarily, plus two SMGs from Marrone et al. (2018) included
in the Harikane et al. (2019) compilation) issued from differ-ent selections. Taking the [C ii] non-detections into account, the L([CII])–SFR rrelation appears to be somewhat steeper and o ff-set from the ‘local’ counterpart determined by De Looze et al. (2014). Whether the relation shows a turnover below SFR<∼ 10 − 30 M yr−1, as suggested, for example by Matthee et al.
(2019), cannot be established from the available data. This would require more sensitive measurements.
3.4. Is there a dependence of [C ii] with the Lyα equivalent width in high-z galaxies?
Several authors have pointed out that galaxies with an increasing Lyα equivalent width show a fainter [C ii] emission, compared to expectations from the local [C ii]-SFR relation (see e.g. Car-niani et al. 2018; Harikane et al. 2018; Harikane et al. 2019). They relate this trend to a possible increase of the ionisation pa-rameter or to a low covering fraction of photodissociation re-gions with increasing Lyα emission. Benefitting now from the large amount of new data from ALPINE for which we also have EW(Lyα) measurements (for 58 [C ii]-detected plus 33 non-detected sources, taken from Cassata et al. (2020)), we show the behaviour of L([CII])/SFR(tot) as a function of EW(Lyα) in Fig. 7. The ALPINE sources cover a wide range of Lyα equivalent widths, also including relatively large EWs, some of which were selected as LAE. Again, a large scatter is found in L([CII])/SFR at all values of EW(Lyα), and the fit to all the data including the non-detections shows a weak dependence of EW(Lyα) on L([CII])/SFR9. Clearly, we cannot claim a strong anti-correlation
of [C ii] with increasing Lyα equivalence width, in contrast to Harikane et al. (2019). The difference compared to their work lies in our significantly larger dataset, our use of ‘uniformised’ values for SFR, and the use of a more conservative line width for the determination of the upper limits on [C ii] luminosities, as already mentioned above.
4. Observed [C
ii
] 158µ
m line to IR continuumratios
With the exception of some lensed sources from the SPT survey (Gullberg et al. 2015), the z > 3 galaxies currently detected in the dust continuum have typical (lensing-corrected, if applica-ble) IR luminosities in the range of LIR >∼ 1011 to 2 × 10¹²L ,
hence they are LIRG or ULIRG by definition. This is also the case for the continuum-detected ALPINE sources (see Bether-min et al. (2020)). In this regime of high-IR luBether-minosities, low-z galaxies show the well-known ‘[C ii] deficit’, meaning a drop of L([CII])/LIR towards high LIR (see e.g. Malhotra et al. 2001;
Graciá-Carpio et al. 2011). It is therefore of interest to examine how high redshift galaxies, the ALPINE sample in particular, and others, behave in this respect.
Since the IR continuum is undetected in many observations of normal star-forming galaxies at high redshift, we first plot the L([CII])/LIR ratio as a function of the [C ii] luminosity instead
of LIR. The result is shown in the left panel of Fig. 8. where we
show the data for all the [C ii]-detected galaxies of ALPINE, the z > 6 data from the compilation of Matthee et al. (2019), other [C ii] detections (non-AGN-dominated sources) at z > 3 taken from the compilation in Gullberg et al. (2015), the SPT sources of Gullberg et al. (2015), and observations at z < 3 from the compilation of Zanella et al. (2018). We note that we
9 The Bayesian fit yields log(L([CII])/SFR)= (6.99 ± 0.07) − (0.10 ± 0.06) × log(EW) in the units plotted in Fig. 7.
104 105 106 107 108 109 1010 1011
log(L
CII) [L ]
5.0 4.5 4.0 3.5 3.0 2.5 2.0 1.5 1.0log
(L
CII/L
IR)
Zanella+18 (z<3) z>3 z>6 ALPINE - (3 limits) [CII] - ALPINE 108 109 1010 1011 1012 1013 1014log(L
IR) [L ]
5.0 4.5 4.0 3.5 3.0 2.5 2.0 1.5 1.0log
(L
CII/L
IR)
Zanella+18 (z<3) z>3 z>6 ALPINE - LIR(IRX) [CII] - ALPINEFig. 8. L([CII])/LIRversus L([CII]) (left panel) and LIR(right) for the ALPINE sources and comparison samples where the [C ii] line is detected. For the z > 6 sources, taken from the Matthee et al. (2019) sample, we adopt Td= 45 K for the detections and LIRupper limits. For galaxies not detected in the dust-continuum, we show their L([CII])/LIR3 σ lower limit in the left panel as triangles. In the right panel, the LIRlimits of the ALPINE sources have been replaced by the LIRvalues computed from the IRX–β relation, where possible.
use the total IR luminosity here (from 8-1000 µm), following Zanella et al. (2018), for example, whereas other authors use the far-IR luminosity, LFIR(from 40-122 µm restframe), as a
refer-ence; in the Zanella et al. (2018) compilation, one typically has LIR/LFIR= 1.6. For the SED template used for ALPINE one has
LIR/LFIR= 1.628.
The ALPINE sources detected in the continuum show a ra-tio L([CII])/LIR∼ (1 − 3) × 10−3 (or a factor of 1.628 higher
when compared to LFIR), comparable to the ‘normal’ z < 1
sources, whereas the IR luminous [C ii]-deficient galaxies have L([CII])/LIR< 10−3. The same is also found for the other
continuum-detected z > 6 galaxies, and the majority of the z ∼4 − 7 sources that are currently undetected in the dust con-tinuum are also compatible with normal or higher L([CII])/LIR
ratios. In other words, the majority of the z > 4 galaxies where [C ii] is detected do not seem to show a deficit in L([CII])/LIR,
similar to earlier findings at lower redshift (e.g. z ∼ 1−2, Zanella et al. 2018). On the other hand, the SPT sample, which is signif-icantly brighter than the ALPINE sources and the z > 6 LBGs and LAEs, shows several sources with L([CII])/LIR< 10−3and
an increasing [C ii]-deficit at IR luminosities above >∼ 1012 L ,
as shown by Gullberg et al. (2015). One may therefore specu-late that a [C ii] deficit is also present in high-z galaxies, albeit at intrinsically higher IR luminosities, again suggesting that the [C ii]/IR-deficit is not a universal property, as already suggested earlier (cf. Zanella et al. 2018).
In the right panel of Fig. 8 we show a more classical version of the dependence of the L([CII])/LIRratio, plotted as a function
of LIR, where the IR luminosity of the high-z (z ∼ 4 − 6 galaxies
from ALPINE and the z > 6 sample) is taken from the observa-tions or has been computed from the ALPINE IRX–β relation (as used in Figs. 4–7) for the continuum non-detected sources. Most of the latter sources have predicted LIR ∼ 1010− (3 × 10¹¹) L ,
and L([CII])/LIRratio ranges between 10−3and 10−2, compatible
with the bulk of the z < 3 galaxies.
Since the observed decrease of L([CII])/LIRin low and high-z
galaxies is known to correlate with the increasing dust tempera-ture (e.g. Malhotra et al. 2001; Graciá-Carpio et al. 2011; Diaz-Santos et al. 2013; Gullberg et al. 2015), one might be tempted to conclude that the ‘normal’ L([CII])/LIR ratio found for the
majority of the ALPINE galaxies and z > 6 LBGs and LAEs, could indicate that these sources do not harbor particularly hot dust. In the context of the intensely debated uncertainties on the typical dust temperatures of normal galaxies in the early Uni-verse (see e.g. Bouwens et al. 2016; Faisst et al. 2017; Ferrara et al. 2017), this would have important implications. Conversely, from the analysis of Magdis et al. (2014) one would expect some [C ii] deficiency for the ALPINE continuum-detected galaxies at Td ∼ 42 K of our template, but this effect is not seen in our
data. In any case, Fig. 8 should not be over-interpreted since the inferred IR luminosity itself depends on the assumed IR SED template, meaning directly or indirectly on Td. Independent
con-straints on the IR SED and dust temperature of high-z galaxies are clearly needed.
5. Discussion
If star formation were unobscured in most of the z ∼ 4 − 6 galax-ies covered by the ALPINE survey, our observations would indi-cate that [C ii] is over-luminous at a given SFR≈SFR(UV), com-pared to the observed correlation for low redshift galaxies (see Fig. 2). At face value, such a conclusion would be quite in con-trast with earlier studies of z > 6 galaxies, which for example have argued that [C ii] was less luminous than expected from comparisons with the low-z reference sample (see e.g. Ouchi et al. 2013; Bradaˇc et al. 2017; Harikane et al. 2018).
However, as argued above, it seems much more likely that a fraction of the UV light from star formation is attenuated by dust, in the majority of our targets, as well as in those from which we do not detect dust-continuum emission with ALMA. Indeed, a relatively small correction of SFR(UV) – upward by a factor of ∼ 2 on average – is sufficient to bring the [C ii] measurements on average into agreement with the local L([CII])–SFR relation (cf. Sect. 3.2). The amount of this correction appears very reasonable from several points of view: firstly, it corresponds to the average correction obtained from multi-band SED fitting of the rest-UV-to-optical SED; and secondly, the same correction is found, on average, by applying an empirically calibrated IRX–β relation of the ALPINE galaxies derived from stacking to the individual ALPINE galaxies, which are not detected in the dust continuum.
Finally, stacking the continuum in bins of L([CII]) also indicates a necessary correction to the SFR(UV) as shown by Bethermin et al. (2020), leading to a fair agreement of the stacked data with the local relation.
Taking into account a correction for dust-obscured star for-mation, we then examined and derived the empirical relation be-tween L([CII]) and the total SFR(tot) for z > 4 galaxies, us-ing both the ALPINE sample coverus-ing z ∼ 4 − 6 and data from the literature for z ∼ 6 − 9 galaxies. We also included [C ii] non-detections in a Bayesian linear fit of the data (Sect. 3.3 and Appendix). We also stress the importance of a consistent use of SFR calibrations, IMF normalisations, and empirically moti-vated [C ii] line widths to compute upper limits (see also Matthee et al. 2019), which must be taken into account for meaningful and consistent comparisons of different datasets and to estab-lish, for example, a possible evolution of the L([CII])–SFR rela-tion with redshift. Some of our results are obviously also subject to uncertainties and future improvements, which we now briefly discuss.
Making reasonable assumptions on the dust-obscured SFR and using for the first time a large sample of up to 150 galax-ies, we have shown that the [C ii] luminosity of high-z (z > 4) galaxies correlates well with the total SFR, over approximately two orders of magnitude in SFR. The data is described well by a linear relationship between log(L([CII])) and log(SFRtot) with
a slope close to unity (b ∼ 0.8 − 1.3) (see Table A.1). How-ever, the exact slope of the relation depends in part on the [C ii]-undetected sources, and hence on the detailed assumptions on the upper limits, which depends not only on assumed line widths, but also on the hypothesis about size (point-like or slightly ex-tended sources). Deeper observations for some of the ALPINE targets would be easily attainable with ALMA, and helpful to better understand the sources with log(L([CII])) <∼ 108 L . To
firm up the result of a possibly steeper L([CII])–SFR relation at high-z than for local galaxies, it is also clearly important to acquire more measurements of fainter galaxies with lower star formation rates, ideally at SFR <∼ 1 − 3 M yr−1, where
cur-rently only very few observations of lensed galaxies have been obtained (Knudsen et al. 2016; Bradaˇc et al. 2017).
Although we fitted the available data with simple linear rela-tions (i.e. a power-law dependence of L([CII]) on SFR), nature may be more complicated, and the conditions may be different in high-redshift galaxies. The high-z data discussed here do not al-low us to exclude different behaviour at low SFR or low L([CII]), as suggested, for example, by Matthee et al. (2019). However, on resolved scales in our Galaxy and for individual galaxies from the nearby Universe up to z ∼ 1 − 3, different studies have empir-ically established a correlation between [C ii] and the total SFR with simple power laws with exponents of ∼ 0.8 − 1.2 extend-ing over approximately six orders of magnitude (see e.g. Pineda et al. 2014; de Looze et al. 2011; De Looze et al. 2014; Zanella et al. 2018), and which include the range probed by high-z ob-servations. From an empirical point of view and in the absence of strongly deviating data, we did not consider other functional forms of the [C ii]–SFR relation.
Beyond [C ii], the second fundamental quantity for this work is obviously the total SFR, which is currently not easy to deter-mine, due to technical limitations (insufficient sensitivity to de-tect dust-continuum emission) and our limited knowledge of the dust properties and IR template, which are required to infer the total IR luminosity, and hence the dust-obscured part SFR(IR). On the other hand, SFR(UV) is easy to determine for the galax-ies of interest here, since all of them were previously detected at these wavelengths for our survey (Le Fèvre et al. (2019)). The
IR template used in our work to translate the rest-frame 158 µm continuum measurements into the total LIRhas a similar
‘bolo-metric correction’ to a modified black body (MBB) with Td≈ 42
K (Bethermin et al. (2020)). Using, for example, the empirical template of Schreiber et al. (2018) would imply LIR values that
are higher by 43%, comparable to an MBB with Td ∼ 45 K. If
even higher dust temperatures were appropriate, LIR would, for
example, increase by a factor of 1.87 (3.79) for Td = 50 (60) K
compared to (Bethermin et al. (2020)).
With our assumptions and the adopted IRX–β correction, for the ALPINE galaxies one has SFR(UV) ≈ SFR(IR) on average, and most galaxies have SFR(UV) <∼ 2 SFR(IR). In this case, an increase of LIR by a factor of two (3) would translate as an
increase of the total SFR by a factor of 1.5–1.6 (2–2.3). This effect could thus shift the [C ii]–SFR relation by this amount, away from the local relation. Whether (and by how much) this could also change the slope of the relation depends if the dust-obscured SFR fraction is constant in all galaxies, and how the dust temperature may vary with galaxy properties, all of which are largely unknown for high-z galaxies.
Clearly, accurately determining the total SFR of high-z galaxies will lead to significantly more robust results on the [C ii]–SFR relation in the distant Universe. Efforts are under way to constrain the dust temperatures at high-z (e.g. Hirashita et al. 2017; Faisst et al. 2017; Bakx et al. 2020). Alternatively, the JWST should soon provide measurements of rest-optical lines including hydrogen recombination lines, which will allow one to determine, for example, the Hα SFR and dust corrections using the Balmer decrement for high-z galaxies. This could become an important and complementary method to nail down some of the uncertainties discussed here, and indirectly also to constrain the dust temperature and LIRof distant galaxies.
Finally, we would like to caution that the [C ii] luminosity may not necessarily trace the SFR accurately in general, espe-cially in high redshift galaxies. Although L([CII]) empirically correlates well with the SFR, the main physical reason(s) for this dependence are not well understood and predictive mod-els are therefore difficult to construct, presumably largely since [C ii] is known to originate from a broad range of ISM phases and regions with different conditions (see e.g. Vallini et al. 2015; Lagache et al. 2018; Ferrara et al. 2019; Popping et al. 2019). In fact, the empirical correlations of L([CII]) determined here and in earlier studies are with the UV+IR luminosity, or a com-bination of the two, which can be converted to the SFR if one assumes a particular star formation history and age of the pop-ulation. More fundamentally, the data thus probably indicate a correlation of the [C ii] luminosity with the intrinsic UV lumi-nosity of the galaxy – part of which emerges in the UV, and the other part after processing by dust in the IR – which is also phys-ically significant, since [C ii] requires photons capable of singly ionising carbon atoms, that is to say with energies > 11.26 eV (wavelength < 1102 Å). This implies in particular that L([CII]) does not need to closely follow the instantaneous SFR in galax-ies with strongly varying (irregular, burst, etc.) star formation histories, where significant variations between LUVand the SFR
are expected (see e.g. Schaerer et al. 2013; Madau & Dickinson 2014). Such situations are probably more common in the early Universe, and one may therefore expect a better correlation of L([CII]) with the intrinsic (total) UV luminosity than with other tracers of the SFR, such as H recombination lines.
Furthermore, [C ii] emission may also depend on metallic-ity and other galaxy properties such as the gas fraction, distance from the main sequence, and so on (cf. Vallini et al. 2015; La-gache et al. 2018; Zanella et al. 2018). Currently, these
quanti-ties are largely unknown for high-z galaxies and are difficult to measure. In addition, the ALPINE sample is, by construction, not well placed to examine possible dependences on the main sequence distance, since it selected main sequence galaxies and subtle variations from it are difficult to measure. Future indepen-dent measurements may yield a more refined picture of the main processes governing the emission of [C ii] in distant galaxies.
Other results from the rich ALPINE dataset are presented elsewhere. Beyond those already mentioned earlier, these cover, for example, the use of [C ii] to estimate the amount of gas in galaxies, morphological studies, the detection of [C ii] in the cir-cumgalactic medium, studies of the kinematics between [C ii] and Lyα, the discovery of very obscured sources, and several other topics. For more details on these issues, see Dessauges-Zavadsky et al. (2020); Fujimoto et al. (2020); Ginolfi et al. (2020); Cassata et al. (2020); Romano et al. (2020).
6. Conclusions
We analysed the new [C ii] 158 µm measurements from the ALPINE survey of star-forming galaxies at z ∼ 4 − 6 (Le Fèvre et al. (2019), Bethermin et al. (2020), Faisst et al. (2020)), which for the first time provides a large sample (118 galaxies) to study [C ii] emission and its correlation with the star formation rate at high redshift. We examined whether our data and other obser-vations at z > 6 – now totalling 153 galaxies – are compatible with the observed correlation between the [C ii] luminosity and SFR found at lower redshift, and described in the De Looze et al. (2014) reference sample.
To compare the high-z observations to the earlier data, we used consistent SFR calibrations (based on UV and IR contin-uum luminosities) and a carefully homogenised IMF. We also took into account the [C ii] non-detections, which are translated into upper limits on L([CII]) adopting empirically motivated as-sumptions on the [C ii] line widths, which we re-examined us-ing our own data and literature data (see Fig. 1). The ALPINE galaxies, which are both detected in [C ii] and the dust contin-uum, show a good agreement with the low-z L([CII])–SFR re-lation when considering the total SFR(UV+IR). A fraction of the non-detected ALPINE galaxies in the dust continuum appear over-luminous in L([CII]) compared to expectations from the De Looze et al. (2014) relation, when no correction for dust attenu-ation is made (see Fig. 2). This is in contrast with earlier studies, which have often reported apparent deficits of [C ii] in high-z galaxies (e.g. Ouchi et al. 2013; Inoue et al. 2016; Harikane et al. 2018). Using the results from two different stacking methods, de-scribed in Bethermin et al. (2020), Fudamoto et al. (2020), and SED fits allows us to account for dust-obscured star formation in these galaxies, thus increasing their total SFR by a factor of ∼ 2 on average, which brings the ALPINE galaxies into agreement with the local [C ii]–SFR relation (Fig. 3, right, and Fig. 4).
When conservative upper limits from the [C ii] non-detected galaxies (∼ 1/3 of the ALPINE survey) are also considered, we find that L([CII]) scales linearly with the total SFR for the ALPINE sample, although with a slightly lower normalisa-tion (L([CII])) than the local Hii/starburst galaxy sample of De Looze et al. (2014). Using more agressive upper limits leads to a steepening of the L([CII])–SFR relation. A steeper increase of L([CII]) with SFR is also found when all the available [C ii] measurements (detections and upper limits) at z ∼ 4 − 8, includ-ing other ALMA measurements from the literature are combined (Fig. 6). Given the remaining uncertainties on the [C ii] non-detected galaxies and the exact amount of dust-obscured SFR,
we conclude that the exact slope of the L([CII])–SFR relation at z> 4 is not firmly established.
Upon analysing the homogenised sample of 153 z > 4 galax-ies with [C ii] measurements (detections or upper limits), we find that very few galaxies deviate significantly from the bulk of the sample, and that most z ∼ 4 − 8 galaxies show an L([CII])– SFR relation that is not very different from that of low-z galaxies nearly 13 Gyr later. In other words, the currently available data show no strong evidence for a deficit of [C ii] from z ∼ 4 to 8, in contrast to several earlier results, but in line with other sug-gestions (Carniani et al. 2018; Matthee et al. 2019). The only strong outliers from the L([CII])–SFR relation are two galaxies at z > 8 with [O iii] 88µm line detections with ALMA and no [C ii] 158 µm (Laporte et al. 2019), which may indicate a more fundamental change of properties in the very early Universe.
We also examined the behaviour of L([CII])/SFR with the observed Lyα equivalent width of the ALPINE galaxies and lit-erature data, and we do not find a strong dependence of the [C ii] excess or deficiency with EW(Lyα) at z > 4 (Fig. 7), in con-trast with earlier suggestions (e.g. Harikane et al. 2018; Harikane et al. 2019; Matthee et al. 2019). Finally, we show that the de-rived ratio L([CII])/LIR∼ (1 − 3) × 10−3for the ALPINE sources,
comparable to that of ‘normal’ galaxies at lower redshift (Fig. 8).
Overall, our results, using 153 galaxies at z > 4, suggest that the [C ii] luminosity can be used to trace the SFR at these high redshifts, although the scatter is higher than at low redshift, as already indicated by Carniani et al. (2018), for example. Fur-thermore, there is some evidence for a possible steepening of the L([CII])–SFR relation compared to z < 3, although this needs to be confirmed with future measurements and better constraints on dust-obscured star formation in high-z galaxies, which can be obtained with new ALMA and future JWST observations.
Appendix A: Fits for the [C
ii
]–SFR relation at highredshift
The ALPINE dataset and the data for z > 6 galaxies from the literature were fitted using a Bayesian fit including censored data following the method of Kelly (2007), which is implemented in the linmix python package. In Table A.1, we list the resulting fit coefficients of the linear fits of the form log(L([CII])/L ) =
a+ b × log(SFRtot/M yr−1) and their uncertainties obtained for
different combinations of datasets, assumptions on SFR(tot), and adopted [C ii] upper limits. Not all combinations are shown and discussed in the text; those shown in Figures are indicated in the last column in the table.
Acknowledgements. This paper is based on data obtained with the ALMA Ob-servatory, under Large Program 2017.1.00428.L. ALMA is a partnership of ESO (representing its member states), NSF(USA) and NINS (Japan), together with NRC (Canada), MOST and ASIAA (Taiwan), and KASI (Republic of Korea), in cooperation with the Republic of Chile. The Joint ALMA Observatory is op-erated by ESO, AUI/NRAO and NAOJ. DS, MG and MD acknowledge support from the Swiss National Science Foundation. AC, CG, FL, FP and MT acknowl-edge the support from grant PRIN MIUR 2017 - 20173ML3WW_001. EI ac-knowledges partial support from FONDECYT through grant N◦1171710. GCJ and RM acknowledge ERC Advanced Grant 695671 “QUENCH” and support by the Science and Technology Facilities Council (STFC). GL acknowledges sup-port from the European Research Council (ERC) under the European Union’s Horizon 2020 research and innovation programme (project CONCERTO, grant agreement No 788212) and from the Excellence Initiative of Aix-Marseille University-A*Midex, a French “Investissements d’Avenir” programme. DR ac-knowledges support from the National Science Foundation under grant numbers AST-1614213 and AST-1910107 and from the Alexander von Humboldt Foun-dation through a Humboldt Research Fellowship for Experienced Researchers. ST acknowledges support from the ERC Consolidator Grant funding scheme (project ConTExT, grant No. 648179). The Cosmic DAWN Center is funded by the Danish National Research Foundation under grant No. 140 LV acknowledges funding from the European Union’s Horizon 2020 research and innovation pro-gram under the Marie Sklodowska-Curie Grant agreement No. 746119.
References
Arata, S., Yajima, H., Nagamine, K., Abe, M., & Khochfar, S. 2020, arXiv e-prints, arXiv:2001.01853
Bakx, T. J. L. C., Tamura, Y., Hashimoto, T., et al. 2020, MNRAS, 493, 4294 Bethermin, M., Fudamoto, Y., Ginolfi, M., et al. 2020, arXiv e-prints,
arXiv:2002.00962
Bouwens, R. J., Aravena, M., Decarli, R., et al. 2016, ApJ, 833, 72 Bradaˇc, M., Garcia-Appadoo, D., Huang, K.-H., et al. 2017, ApJL, 836, L2 Capak, P. L., Carilli, C., Jones, G., et al. 2015, Nature, 522, 455
Carilli, C., Murphy, E., Ferrara, A., & Dayal, P. 2017
Carniani, S., Maiolino, R., Amorin, R., et al. 2018, MNRAS, 478, 1170 Cassata, P., Morselli, L., Faisst, A., et al. 2020, arXiv e-prints, arXiv:2002.00967 Chabrier, G. 2003, PASP, 115, 763
de Looze, I., Baes, M., Bendo, G. J., Cortese, L., & Fritz, J. 2011, MNRAS, 416, 2712
De Looze, I., Cormier, D., Lebouteiller, V., et al. 2014, A&A, 568, A62 Dessauges-Zavadsky, M., Ginolfi, M., Pozzi, F., et al. 2020, arXiv e-prints,
arXiv:2004.10771
Diaz-Santos, T., Armus, L., Charmandaris, V., et al. 2013, ApJ, 774, 68 Fahrion, K., Cormier, D., Bigiel, F., et al. 2017, A&A, 599, A9 Faisst, A. L., Capak, P. L., Yan, L., et al. 2017, ApJ, 847, 21 Faisst, A. L., Schaerer, D., Lemaux, B. C., et al. 2020, ApJS, 247, 61
Ferrara, A., Hirashita, H., Ouchi, M., & Fujimoto, S. 2017, MNRAS, 471, 5018 Ferrara, A., Vallini, L., Pallottini, A., et al. 2019, MNRAS, 489, 1
Fudamoto, Y., Oesch, P. A., Faisst, A., et al. 2020, arXiv e-prints, arXiv:2004.10760
Fujimoto, S., Silverman, J. D., Bethermin, M., et al. 2020, arXiv e-prints, arXiv:2003.00013
Ginolfi, M., Jones, G. C., Béthermin, M., et al. 2020, A&A, 633, A90 Glover, S. C. O. & Smith, R. J. 2016, MNRAS, 462, 3011
Graciá-Carpio, J., Sturm, E., Hailey-Dunsheath, S., et al. 2011, ApJL, 728, L7 Gullberg, B., De Breuck, C., Vieira, J. D., et al. 2015, MNRAS, 449, 2883 Harikane, Y., Ouchi, M., Inoue, A. K., et al. 2019, arXiv e-prints,
arXiv:1910.10927
Harikane, Y., Ouchi, M., Shibuya, T., et al. 2018, The Astrophysical Journal, 859, 84
Hashimoto, T., Laporte, N., Mawatari, K., et al. 2018, Nature, 557, 392 Herrera-Camus, R., Bolatto, A. D., Wolfire, M. G., et al. 2015, ApJ, 800, 1 Hirashita, H., Burgarella, D., & Bouwens, R. J. 2017
Hollenbach, D. J. & Tielens, A. G. G. M. 1999, Reviews of Modern Physics, 71, 173
Inoue, A. K., Tamura, Y., Matsuo, H., et al. 2016, Science, 352, 1559 Kelly, B. C. 2007, ApJ, 665, 1489
Kennicutt, Jr., R. C. 1998, ARA&A, 36, 189
Knudsen, K. K., Richard, J., Kneib, J.-P., et al. 2016, Monthly Notices of the Royal Astronomical Society: Letters, 462, L6
Kohandel, M., Pallottini, A., Ferrara, A., et al. 2019, MNRAS, 487, 3007 Lagache, G., Cousin, M., & Chatzikos, M. 2018, A&A, 609, A130 Laporte, N., Ellis, R. S., Boone, F., et al. 2017, ApJL, 837, L21 Laporte, N., Katz, H., Ellis, R. S., et al. 2019, MNRAS, 487, L81
Le Fèvre, O., Béthermin, M., Faisst, A., et al. 2019, arXiv e-prints, arXiv:1910.09517
Leung, T. K. D., Olsen, K. P., Somerville, R. S., et al. 2020, arXiv e-prints, arXiv:2004.11912
Madau, P. & Dickinson, M. 2014, ARA&A, 52, 415
Magdis, G. E., Rigopoulou, D., Hopwood, R., et al. 2014, ApJ, 796, 63 Maiolino, R., Carniani, S., Fontana, A., et al. 2015, MNRAS, 452, 54 Malhotra, S., Kaufman, M. J., Hollenbach, D., et al. 2001, ApJ, 561, 766 Marrone, D. P., Spilker, J. S., Hayward, C. C., et al. 2018, Nature, 553, 51 Matthee, J., Sobral, D., Boogaard, L. A., et al. 2019, ApJ, 881, 124 Murphy, E. J., Condon, J. J., Schinnerer, E., et al. 2011, ApJ, 737, 67 Nordon, R. & Sternberg, A. 2016, MNRAS, 462, 2804
Ota, K., Walter, F., Ohta, K., et al. 2014, ApJ, 792, 34 Ouchi, M., Ellis, R., Ono, Y., et al. 2013, ApJ, 778, 102
Pentericci, L., Carniani, S., Castellano, M., et al. 2016, ApJL, 829, L11 Pineda, J. L., Langer, W. D., & Goldsmith, P. F. 2014, A&A, 570, A121 Popping, G., Narayanan, D., Somerville, R. S., Faisst, A. L., & Krumholz, M. R.
2019, MNRAS, 482, 4906
Riechers, D. A., Carilli, C. L., Capak, P. L., et al. 2014, ApJ, 796, 84
Romano, M., Cassata, P., Morselli, L., et al. 2020, arXiv e-prints, arXiv:2002.00961
Schaerer, D., de Barros, S., & Sklias, P. 2013, A&A, 549, A4 Schreiber, C., Elbaz, D., Pannella, M., et al. 2018, A&A, 609, A30 Tamura, Y., Mawatari, K., Hashimoto, T., et al. 2019, ApJ, 874, 27
Vallini, L., Gallerani, S., Ferrara, A., Pallottini, A., & Yue, B. 2015, The Astro-physical Journal, 813, 36
Willott, C. J., Carilli, C. L., Wagg, J., & Wang, R. 2015, ApJ, 807, 180 Wolfire, M. G., Hollenbach, D., McKee, C. F., Tielens, A. G. G. M., & Bakes,
E. L. O. 1995, ApJ, 443, 152
Wuyts, S., Förster Schreiber, N. M., Lutz, D., et al. 2011, ApJ, 738, 106 Zanella, A., Daddi, E., Magdis, G., et al. 2018, Monthly Notices of the Royal
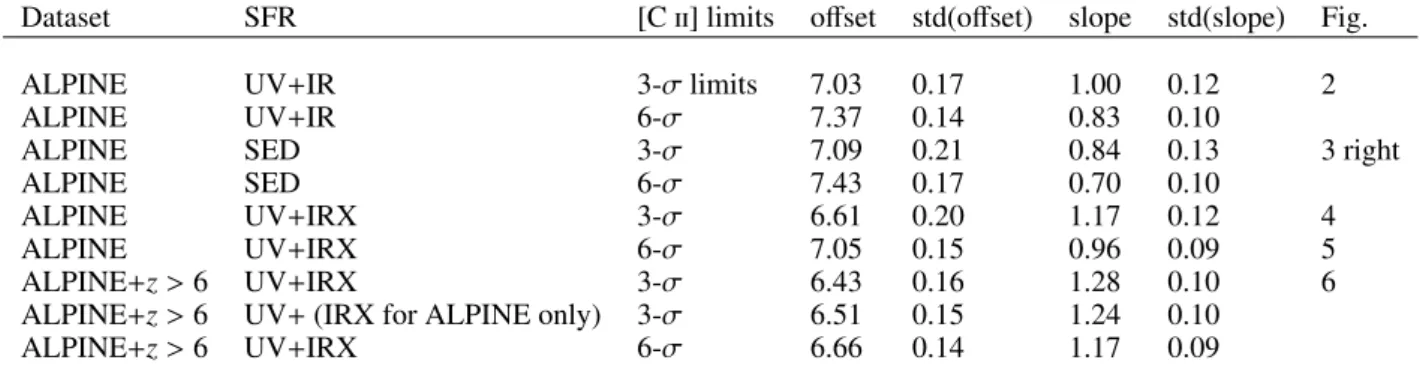
Table A.1. Fit coefficients from Bayesian fits including censored data: (a, b)=(offset, slope) and their uncertainties (standard deviation). Col. 1 indicates the dataset used, col. 2 the total SFR used, col. 3 the [C ii] limits. Col. 8 indicates the figure number showing the corresponding data and fit in some cases.
Dataset SFR [C ii] limits offset std(offset) slope std(slope) Fig.
ALPINE UV+IR 3-σ limits 7.03 0.17 1.00 0.12 2
ALPINE UV+IR 6-σ 7.37 0.14 0.83 0.10
ALPINE SED 3-σ 7.09 0.21 0.84 0.13 3 right
ALPINE SED 6-σ 7.43 0.17 0.70 0.10
ALPINE UV+IRX 3-σ 6.61 0.20 1.17 0.12 4
ALPINE UV+IRX 6-σ 7.05 0.15 0.96 0.09 5
ALPINE+z > 6 UV+IRX 3-σ 6.43 0.16 1.28 0.10 6
ALPINE+z > 6 UV+ (IRX for ALPINE only) 3-σ 6.51 0.15 1.24 0.10
ALPINE+z > 6 UV+IRX 6-σ 6.66 0.14 1.17 0.09
1 Observatoire de Genève, Université de Genève, 51 Ch. des Mail-lettes, 1290 Versoix, Switzerland
2 CNRS, IRAP, 14 Avenue E. Belin, 31400 Toulouse, France 3 Aix Marseille Université, CNRS, CNES, LAM (Laboratoire
d’Astrophysique de Marseille), 13013, Marseille, France
4 IPAC, California Institute of Technology, 1200 East California Boulevard, Pasadena, CA 91125, USA
5 Cosmic Dawn Center (DAWN), Copenhagen, Denmark
6 Niels Bohr Institute, University of Copenhagen, Lyngbyvej 2, DK-2100 Copenhagen, Denmark
7 Dipartimento di Fisica e Astronomia, Università di Padova, Vicolo dell’Osservatorio, 3 35122 Padova, Italy
8 INAF, Osservatorio Astronomico di Padova, vicolo dell’Osservatorio 5, I-35122 Padova, Italy
9 Kavli Institute for the Physics and Mathematics of the Universe, The University of Tokyo, Kashiwa, Japan 277-8583 (Kavli IPMU, WPI) 10 Department of Astronomy, School of Science, The University of
Tokyo, 7-3-1 Hongo, Bunkyo, Tokyo 113-0033, Japan
11 The Caltech Optical Observatories, California Institute of Technol-ogy, Pasadena, CA 91125, USA
12 Cavendish Laboratory, University of Cambridge, 19 J. J. Thomson Ave., Cambridge CB3 0HE, UK
13 Kavli Institute for Cosmology, University of Cambridge, Madingley Road, Cambridge CB3 0HA, UK
14 Instituto de Investigacion Multidisciplinar en Ciencia y Tecnologia, Universidad de La Serena, Raul Bitran 1305, La Serena, Chile 15 Departamento de Astronomia, Universidad de La Serena, Av. Juan
Cisternas 1200 Norte, La Serena, Chile
16 INAF - Osservatorio di Astrofisica e Scienza dello Spazio di Bologna, via Gobetti 93/3, I-40129, Bologna, Italy
17 Centro de Astronomia (CITEVA), Universidad de Antofagasta, Avenida Angamos 601, Antofagasta, Chile
18 University of Bologna, Department of Physics and Astronomy (DIFA), Via Gobetti 93/2, I-40129, Bologna, Italy
19 INAF - Osservatorio Astrofisico di Arcetri, Largo E. Fermi 5, I-50125, Firenze, Italy
20 Astronomy Department, University of Massachusetts, Amherst, MA 01003, USA
21 Space Telescope Science Institute, 3700 San Martin Drive, Balti-more, MD 21218, USA
22 Instituto de Física y Astronomía, Universidad de Valparaíso, Avda. Gran Bretaña 1111, Valparaíso, Chile
23 Department of Physics, University of California, Davis, One Shields Ave., Davis, CA 95616, USA
24 Department of Astronomy, University of Florida, 211 Bryant Space Sciences Center, Gainesville, FL 32611 USA
25 University of Florida Informatics Institute, 432 Newell Drive, CISE Bldg E251, Gainesville, FL 32611
26 Department of Astronomy, Cornell University, Space Sciences Building, Ithaca, NY 14853, USA
27 Max-Planck Institut für Astronomie, Königstuhl 17, D-69117, Hei-delberg, Germany
28 Leiden Observatory, Leiden University, PO Box 9500, 2300 RA Lei-den, The Netherlands
![Fig. 1. Observed FWHM of the [C ii ] 158 µm line as function of the [C ii ] luminosity from ALPINE and other data from the literature (the compilation of z > 6 sources from Matthee et al](https://thumb-eu.123doks.com/thumbv2/123doknet/14618034.546703/3.892.457.831.86.332/observed-function-luminosity-alpine-literature-compilation-sources-matthee.webp)
![Fig. 2. [C ii ] as a function of UV or UV+IR-derived SFR for the z ∼ 4.5 ALPINE sources](https://thumb-eu.123doks.com/thumbv2/123doknet/14618034.546703/4.892.63.430.90.328/fig-function-uv-uv-derived-sfr-alpine-sources.webp)
![Fig. 6. [C ii ]–SFR relation combining the ALPINE sample and observa- observa-tions of z ∼ 6 −9 galaxies taken from the literature](https://thumb-eu.123doks.com/thumbv2/123doknet/14618034.546703/6.892.64.433.89.329/relation-combining-alpine-sample-observa-observa-galaxies-literature.webp)
![Fig. 8. L([CII])/L IR versus L([CII]) (left panel) and L IR (right) for the ALPINE sources and comparison samples where the [C ii ] line is detected.](https://thumb-eu.123doks.com/thumbv2/123doknet/14618034.546703/8.892.84.798.112.368/versus-panel-right-alpine-sources-comparison-samples-detected.webp)