ORIGINAL PAPER
Soil organic phosphorus and microbial community
composition as affected by 26 years of different
management strategies
E. K. Bünemann&P. Marschner&R. J. Smernik&
M. Conyers&A. M. McNeill
Received: 5 March 2007 / Revised: 5 November 2007 / Accepted: 6 November 2007 / Published online: 11 December 2007
# Springer-Verlag 2007
Abstract Agricultural management can affect soil organic matter chemistry and microbial community structure, but the relationship between the two is not well understood. We investigated the effect of crop rotation, tillage and stubble management on forms of soil phosphorus (P) as determined by solution 31P nuclear magnetic resonance spectroscopy and microbial community composition using fatty acid methyl ester analysis in a long-term field experiment (26 years) on a Chromic Luvisol in New South Wales, Australia. An increase in soil organic carbon, nitrogen and phosphorus compared to the beginning of the experiment was found in a rotation of wheat and subterranean clover with direct drill and mulching, while stubble burning in wheat–lupin and wheat–wheat rotations led to soil organic matter losses. Microbial biomass was highest in the treatment with maximum organic matter contents. The
same soil P forms were detected in all samples, but in different amounts. Changes in organic P occurred mainly in the monoester region, with an increase or decrease in peaks that were present also in the sample taken before the beginning of the experiment in 1979. The microbial community composition differed between the five treat-ments and was affected primarily by crop rotations and to a lesser degree by tillage. A linkage between soil P forms and signature fatty acids was tentatively established, but needs to be verified in further studies.
Keywords Crop rotation . FAME . Microbial community composition .
Solution31P NMR spectroscopy . Soil organic phosphorus
Introduction
Soil organic matter influences soil physical, chemical and biological properties and the amount of soil organic matter is affected by agricultural management strategies such as crop rotation, tillage and stubble management. In a Luvisol in Australia, cereal–legume rotations in combination with stubble retention and direct drilling maintained or even increased soil organic carbon (C) over a period of 21 years, while tillage and stubble burning led to losses of soil organic matter, particularly under continuous cereal crop-ping (Heenan et al. 2004). The grain yield of wheat was significantly lower in continuous wheat cropping than in rotations of wheat with lupin or subterranean clover (Bünemann et al.2006; Heenan et al.1994).
Soil organic C is the main source of energy for soil microorganisms and consequently has a major influence on the amount of microbial biomass in soil (Wardle 1992). Changes in the composition of the microbial community
E. K. Bünemann
:
P. Marschner:
R. J. Smernik:
A. M. McNeill School of Earth and Environmental Sciences,University of Adelaide, DP 636,
Adelaide, SA 5005, Australia M. Conyers
NSW Department of Primary Industries, Wagga Wagga Agricultural Institute, Private Mail Bag,
Wagga Wagga, NSW 2650, Australia Present address:
E. K. Bünemann (*) Institute of Plant Sciences,
Swiss Federal Institute of Technology Zurich (ETH), Eschikon 33,
CH-8315 Lindau, Switzerland
have also been linked to the quantity of soil organic matter. For example, the relative abundances of fungi and Gram-negative bacteria increased together with soil organic matter content as a result of introducing a legume-fallow phase into a maize cropping system which led to incorporation of considerable amounts of plant residues into the soil (Bünemann et al.2004).
Soil microorganisms act as both a source and a sink of plant nutrients such as nitrogen (N) and phosphorus (P). Most of the identifiable organic N compounds in soil seem to be of microbial origin (Kögel-Knabner 2006). At the same time, the mineralisation of N is driven by microbial activity. The origin and mineralisation processes of soil organic P are less well understood. Organic P compounds in soil extracts are usually dominated by monoester P compounds, whereas diester P compounds are more abundant in plant material and bacterial cells (Makarov et al.2005). Fungi tend to contain a significant proportion of their total P content in inorganic forms, i.e. as orthophosphate or as polyphosphates, and their organic P is dominated by monoester P. The different composition of organic P in soil compared to that in plants and micro-organisms has been explained by differential stabilisation of organic P compounds in soil (Magid et al.1996). However, based on the results by Makarov et al. (2005), differences in the microbial community composition may also influence the chemical composition of organic P in soil.
The objective of this study was to investigate the effect of long-term management strategies with respect to crop rotation, tillage and stubble management on forms of soil P as detected by solution 31P nuclear magnetic resonance (NMR) spectroscopy and on the microbial community composition assessed by fatty acid methyl ester (FAME) analysis.
Methods Field experiment
The field experiment is located at the Agricultural Research Institute in Wagga Wagga, New South Wales, Australia. It was started in 1979 on a site that had been under pasture for
most of the previous 19 years. Findings from the trial have been published in a number of publications addressing wheat and lupin yields (Heenan et al. 1994, 2000) and various soil properties (Chan and Heenan1993; Chan et al.
2002; Heenan and Chan1992; Heenan et al.2004; Heenan and Taylor1995). Soil P dynamics during the first 24 years of the trial have been described by Bünemann et al. (2006). The soil has been classified as a red earth (Northcote
1979) or a Chromic Luvisol (FAO/ISRIC/ISSS1998), with 29% clay, 15% silt and a pH of 4.93 (1:5, 0.01 M CaCl2) in
1979 in the top 10 cm. The experiment consisted of six blocks with 16 plots each. Each phase of each rotation was represented each year, with blocks 1, 3 and 5 sown to wheat in 1979 and blocks 2, 4 and 6 in 1980. All data presented in this paper are from blocks 1, 3 and 5. Thus, there were three field replicates for each treatment. Plot size for the treatments studied here was 4.3×50 m.
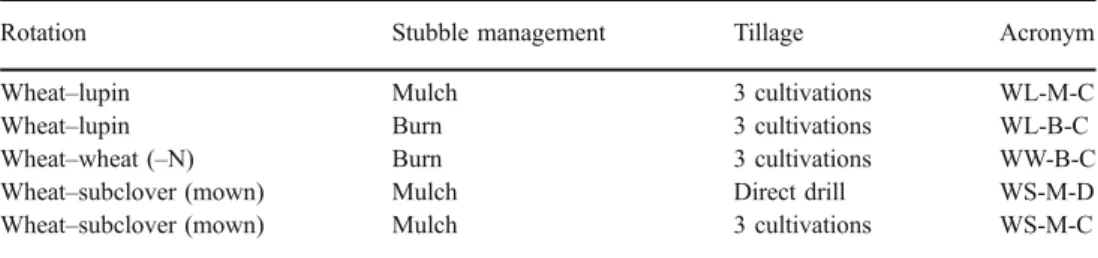
The five treatments chosen for this study (Table1) cover the entire range of soil organic C levels after 26 years of different rotation, stubble management and tillage systems (Heenan et al. 2004). All crops including subclover received 20 kg P ha−1 as single superphosphate with the seed at sowing. The subclover was mown once or twice in spring or early summer, depending on seasonal rainfall and left on the plots as mulch. In the treatments with stubble retention, stubble was slashed between late December (summer) and early March (autumn). Burning of stubble occurred in autumn. The soil was cultivated in autumn after the soil had been wetted to 10 cm, using offset disc harrows to 10 cm in the mulched wheat–lupin rotation and a scarifier to 10 cm in treatments with stubble burning and in the cultivated wheat–subclover rotation.
Soil sampling and analyses
Soil samples were collected in winter (July 2005, i.e. 26 years after the beginning of the trial) from 0- to 5-cm depth, with five randomly located soil cores per plot combined into one composite sample and sieved at 4 mm to remove coarse plant debris. The gravimetric water content after sieving ranged from 16 to 23%. Samples were stored at 4°C for a few days until extraction for the determination of microbial biomass. A subsample was
Table 1 Treatments from the long-term rotation trial in Wagga Wagga chosen for this study
Rotation Stubble management Tillage Acronym Wheat–lupin Mulch 3 cultivations WL-M-C Wheat–lupin Burn 3 cultivations WL-B-C Wheat–wheat (–N) Burn 3 cultivations WW-B-C Wheat–subclover (mown) Mulch Direct drill WS-M-D Wheat–subclover (mown) Mulch 3 cultivations WS-M-C
frozen at−80°C immediately after sieving for extraction of fatty acid methyl esters, while another subsample was air-dried and ground for determination of total C, N and P pools. A composite sample for the three field reps of each treatment from the beginning of the trial in 1979 was obtained from the set of archived samples stored dry at the Wagga Wagga Agricultural Institute.
For each of the samples taken in 2005, all analyses were performed in duplicate. For the composite sample from 1979, analyses were performed with four analytical replicates. Soil pH (in H2O or 0.01 M CaCl2) was measured
in a 1:5 soil/solution ratio. Total C and N were determined by combustion (LECO CN2000), while total P was determined by digestion with perchloric and nitric acid in a 1:6 ratio (Kuo1996). Phosphorus extracted with 0.5 M H2SO4 from non-ignited soils was considered to be
inorganic P, while the increase in H2SO4-extractable P after
ignition (500°C, 1 h) was assumed to originate from organic P (Saunders and Williams1955). The concentration of Pi in all extracts was determined colorimetrically
(Murphy and Riley1962).
Microbial C (Cmic) and N (Nmic) were determined by 24-h
chloroform fumigation followed by extraction with 0.5 M K2SO4 (Vance et al. 1987), with measurement of total
organic C and total N in the extracts using a Formacs Series Combustion TOC/TN Analyser (Skalar, The Netherlands). Microbial P (Pmic) was determined by simultaneous liquid
fumigation and extraction with anion-exchange resin mem-branes (BDH #55164) in bicarbonate form for 16 h as described by Kouno et al. (1995), but using hexanol as the fumigant instead of chloroform and eluting the resins with 0.1 M NaCl/HCl. Microbial C, N and P are reported as the difference between fumigated and non-fumigated subsam-ples. No correction for P sorption was applied, as the presence of the resin as a strong sink resulted in complete recovery of an inorganic P spike. Measurements of C, N and P in non-fumigated subsamples are reported as dissolved organic C (DOC), dissolved N (DN) and resin-extractable P (Presin), respectively.
Soil P forms were determined by solution 31P-NMR analysis of NaOH–ethylenediaminetetraacetic acid (EDTA) extracts, a method that was first used by Cade-Menun and Preston (1996) and which has been further refined since (e.g. Turner et al.2003b). Subsamples of dry and ground soil (2.5 g) were extracted with 50 ml of a 0.25 M NaOH– 0.05 M EDTA solution by shaking end-over-end for 16 h followed by centrifugation for 10 min at 1,300×g and filtration of the supernatant under suction through Whatman 41. An aliquot (40 ml) was immediately frozen at−80°C and freeze-dried subsequently. The remainder of the extract was used for colorimetric determination of inorganic P with malachite green (Ohno and Zibilske 1991) after 20-fold dilution of the extract and for determination of total P by
inductively coupled plasma–optical emission spectroscopy (ICP-OES; Spectroflame Modula, Spectro Analytical Instruments, Kleve, Germany) using 1,200-W power and a torch height of 8 mm with a V groove nebuliser and cyclonic spray chamber. Organic P in the extracts was calculated as the difference between total and inorganic P. The concentrations of Al, Ca, Fe and Mn in the NaOH– EDTA extracts were determined by ICP as well. For each plot, the extraction and determination by colorimetry and ICP was performed in duplicate. The freeze-dried extracts of selected samples (the composite sample from 1979 and one sample per treatment from block 5) were redissolved in 5 ml H2O, and 3.5 ml was transferred into a 10-mm NMR
tube with addition of 0.3 ml D2O. Solution 31P NMR
spectra were acquired at 24°C on a Varian INOVA400 NMR spectrometer at a 31P frequency of 161.9 MHz. Recovery delays for the whole soil extracts were in the range of 10–19 s and were set to at least five times the T1
value of the orthophosphate resonance determined in preliminary inversion-recovery experiments. Previous ex-perience has indicated that the T1value for orthophosphate
is generally greater than those of organic P resonances (unpublished results). We used a 90° pulse of 80 μs, an acquisition time of 1.0 s and broadband 1H decoupling. Between 2,800 and 17,000 scans were accumulated. Chemical shifts were referenced to external 85% H3PO4.
The spectra presented have a line broadening of 2 Hz. FAMEs were extracted in duplicate from each sample following the protocol by Pankhurst et al. (2001). The FAMEs were separated by capillary GC (HP 5890, Hewlett Packard) with a flame ionisation detector (MIDI; Microbial ID, Newark, DE, USA). The GC was equipped with a HP 25×0.2 mm fused silica capillary column and hydrogen was used as the carrier gas. The temperature program was ramped from 170 to 250°C at 5°C min−1. The FAME peaks were identified by the MIDI program based on their chain length. The peak areas were normalised against two internal standards, correcting for the efficiency of the methylation reaction, extraction efficiency and recovery in GC analysis. Fatty acid nomenclature was used as described by Frostegård et al. (1993). As FAMEs can be of microbial as well as plant origin (Drenovsky et al.2004), only fatty acids that have been clearly related to soil microorganisms were entered into the statistical analysis using the selection of Zak et al. (2000). Fungi were represented by the fatty acid 18:2ω6,9c, Gram-positive bacteria by 16:0, i15:0, a15:0, i16:0 and i17:0, Gram-negative bacteria by 16:1ω7c, 16:1ω5c, cy17:0 and cy19:0 and total bacteria by the sum of the two previous groups of fatty acids plus 14:0, 15:0, 17:0, a17:0, 17:1ω8c and 18:1ω11c. The relative abun-dances of individual FAMEs were calculated as weight percentages (wt%) of the total weight (μg g−1soil) of these
Statistical analysis
Statistical analyses were performed with GenStat (Version 6.1, 2002). Soil characteristics were subjected to a one-way analysis of variance in a randomised block design with treatments as main factor, followed by a Tukey test when significant differences (P≤0.05) were indicated. Log-trans-formed relative abundances of the selected FAMEs were analysed with principal component analysis (PCA) and redundancy analysis (RDA) with Monte Carlo permutation tests (CANOCO 4.0, Microcomputer Power, Ithaca, USA). The position in the field (block) and 17 soil characteristics were used as environmental variables in RDA. Community similarities were graphed in ordination plots with scaling focused on inter-sample differences (Jongman et al.1987).
Results
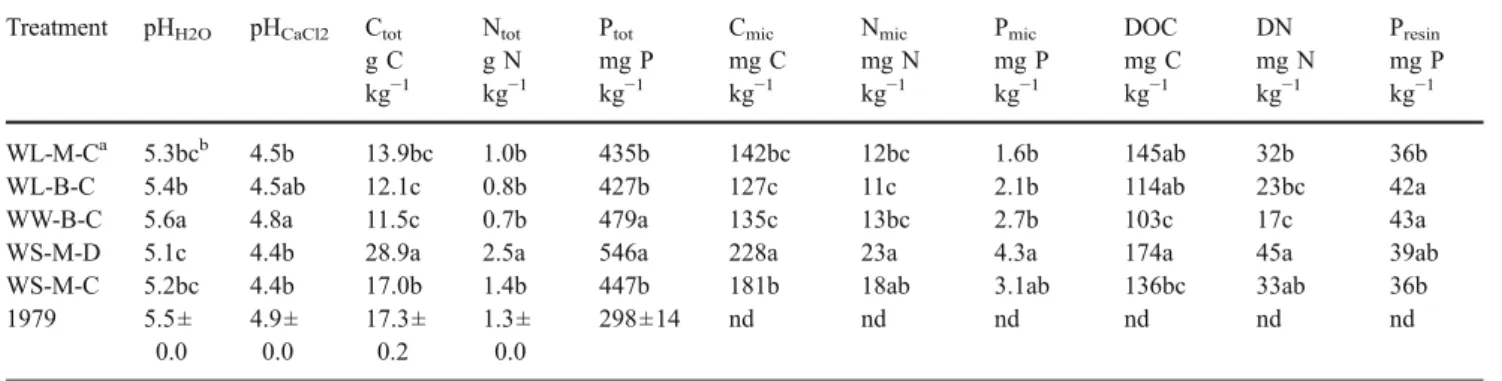
Soil pH, total, microbial and extractable C, N and P The different management strategies resulted in changes in soil pH of up to 0.5 units (Table2). Acidification compared to initial soil pH values was observed in all rotations that included a legume (lupin or subclover), while the pH was unchanged after 26 years of continuous wheat cropping (WW-B-C). Total, microbial and extractable C, N and P were all highest in the wheat–subclover rotation with direct drill and mulching (WS-M-D). Lowest values of total, microbial and extractable C and N were observed in wheat– lupin and wheat–wheat rotations. Compared to concen-trations in 1979, total P had increased in all treatments by
Table 2 Treatment effects on soil pH and total, microbial and extractable C, N and P in the top 5 cm
Treatment pHH2O pHCaCl2 Ctot Ntot Ptot Cmic Nmic Pmic DOC DN Presin
g C kg−1 g N kg−1 mg P kg−1 mg C kg−1 mg N kg−1 mg P kg−1 mg C kg−1 mg N kg−1 mg P kg−1 WL-M-Ca 5.3bcb 4.5b 13.9bc 1.0b 435b 142bc 12bc 1.6b 145ab 32b 36b WL-B-C 5.4b 4.5ab 12.1c 0.8b 427b 127c 11c 2.1b 114ab 23bc 42a WW-B-C 5.6a 4.8a 11.5c 0.7b 479a 135c 13bc 2.7b 103c 17c 43a WS-M-D 5.1c 4.4b 28.9a 2.5a 546a 228a 23a 4.3a 174a 45a 39ab WS-M-C 5.2bc 4.4b 17.0b 1.4b 447b 181b 18ab 3.1ab 136bc 33ab 36b 1979 5.5± 0.0 4.9± 0.0 17.3± 0.2 1.3± 0.0 298±14 nd nd nd nd nd nd
Values at the beginning of the trial in 1979 (mean ± standard deviation) are shown for comparison. nd Not determined
a
Treatment abbreviations indicate the rotation (WL wheat–lupin, WW wheat–wheat, WS wheat–subclover), stubble management (M mulching, B burning) and tillage (C 3 cultivations, D direct drill)
bWithin columns, means followed by the same letter are not significantly different (P=0.05) by Tukey’s multiple comparison test
Table 3 Treatment effects on inorganic and organic P pools in the top 5 cm as determined by the ignition method and NaOH–EDTA extraction, respectively
Treatment Ignition method NaOH–EDTA extraction
Pia Po Pt Pi Po Pt
mg P kg−1soil
WL-M-Cb 214bc 134c 348bc 209b 75c 284bc
WL-B-C 216b 118d 334c 209b 64d 273c
WW-B-C 243a 126cd 370b 232a 67cd 299b
WS-M-D 257a 191a 448a 235a 112a 347a
WS-M-C 197b 150b 348bc 195b 86b 281bc
1979 85±1 143±4 228±4 84±1 81±6 165±5
Values at the beginning of the trial in 1979 (mean ± standard deviation) are shown for comparison.
aPi Inorganic P, Po organic P, Pt total P b
Treatment abbreviations indicate the rotation (WL wheat–lupin, WW wheat–wheat, WS wheat–subclover), stubble management (M mulching, B burning) and tillage (C 3 cultivations, D direct drill)
c
130–250 mg P kg−1, with the greatest increase in treatments
WS–M-D and WW-B-C. Resin-extractable P ranged be-tween 36 and 43 mg P kg−1. Microbial P was highest in WS-M-D with 4.3 mg P kg−1 and lowest in wheat–lupin and wheat–wheat rotations with 1.6–2.7 mg P kg−1.
Soil P pools by wet chemistry and31P NMR spectroscopy Similar treatment effects on extractable inorganic, organic and total P were found by the ignition method and NaOH– EDTA extraction (Table 3). Inorganic P was higher in treatments WS-M-D and WW-B-C than in the other three
treatments, while organic P was highest in WS-M-D and lowest in the two treatments with stubble burning. Similar amounts of inorganic P were extracted with both methods (NaOH–EDTA Pi=0.92×H2SO4-extractable Pi+7.88, r2=
0.98, p<0.001). However, NaOH–EDTA extracted signif-icantly less organic P than the ignition method (NaOH– EDTA Po=0.62×H2SO4-extractable Po−8.58, r2=0.91, p<
0.001). The proportion of total soil P extracted with NaOH– EDTA ranged from 61 to 67% for samples taken in 2005, while it was lower (54%) in 1979 before the onset of P fertilisation. As much as 46% of total P, therefore, remained uncharacterised by NaOH–EDTA extraction.
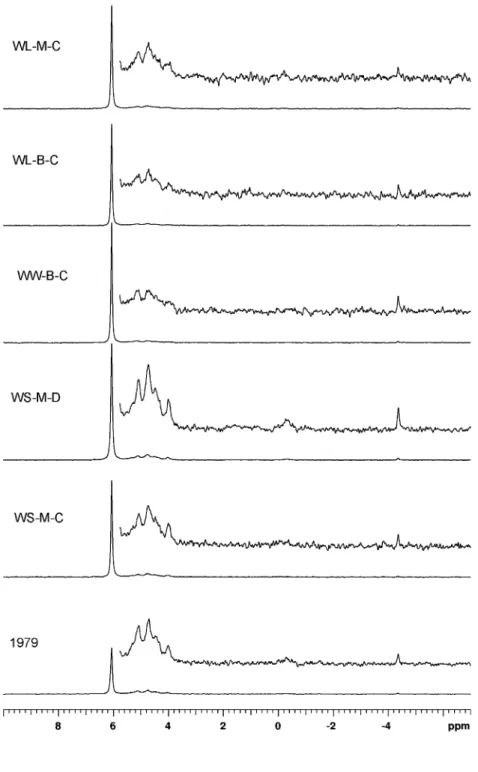
Fig. 1 31P NMR spectra of NaOH–EDTA extracts of top-soil (0–5 cm). The vertical scale has been increased by a factor of 12 in the inset spectra
The 31P-NMR spectra obtained on the initial sample from 1979 and one sample from each treatment after 26 years of differential management are shown in Fig.1. Based on a previous study of peak assignment (Turner et al.
2003b), the four main regions were assigned to orthophos-phate (7 to 5.7 ppm), monoesters (5.7 to 3.4 ppm), diesters (0.2 to−1.0 ppm) and pyrophosphate (−4 to −4.6 ppm). No peaks were detected in the regions assigned to polyphos-phate (−20 ppm) or phosphonates (20 to 23 ppm).
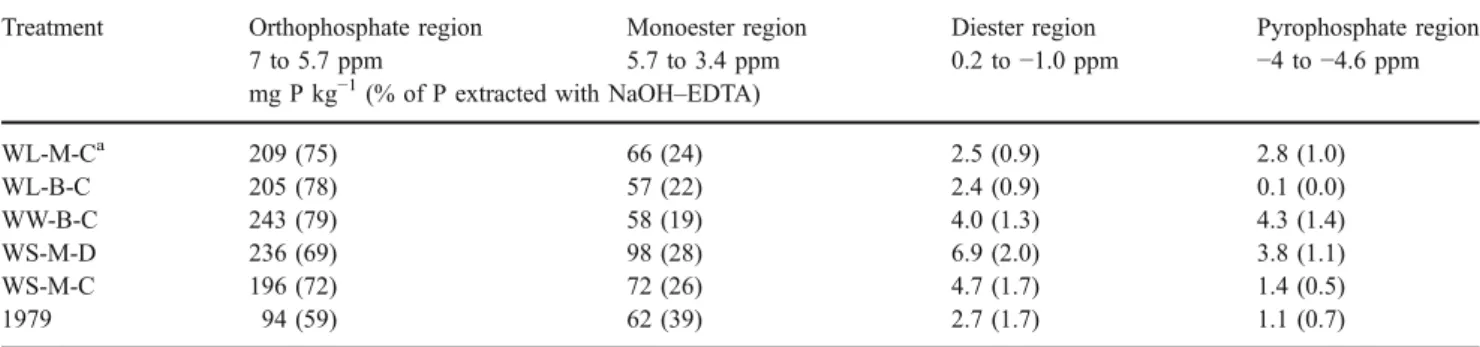
Integration of the peak area in the four main regions (Table4) showed that the proportion of orthophosphate in the extract increased from 59% in 1979 to between 69 and 79% after 26 years of annual P fertilisation. The amount of inorganic P in the NaOH–EDTA extracts as determined by colorimetry was closely related to the amount of orthophos-phate as determined by NMR spectroscopy, but was slightly lower [Pi by colorimetry (in mg P kg−1 )=1.04×orthophos-phate by NMR (in mg P kg−1)−13.33, r2=1.00, p<0.001]. The majority of organic P was in the monoester region (19– 39% of extracted P). The diester and pyrophosphate regions each contained only up to 2% of extracted P. Thus, the
greatest treatment effects on organic and condensed forms of P were seen in the monoester region, both in relative proportions and absolute amounts of P in the extracts.
Whereas colorimetry only provides information about total amounts of inorganic and organic P, NMR spectros-copy can detect changes in P forms. In the present study, the same resonances were found in all samples. The treatment in which organic P had accumulated (WS-M-D) showed an increase in the height of all peaks compared to the sample collected in 1979. Similarly, the loss of organic P in treatments WL-B-C and WW-B-C was reflected in a decrease in the height of peaks in the monoester and diester region. As quantitative rather than qualitative changes were seen and due to the high cost of NMR analyses and limited running time of the machine, samples from the other two field reps were not analysed by NMR.
Among the cations extracted with NaOH–EDTA, the Al concentration was similar for all treatments, while concen-trations of Ca, Fe and Mn were highest in treatment WS-M-D and generally lowest in wheat–lupin and wheat–wheat rotations (data not shown).
Table 4 Amount (in mg P kg−1) and relative proportion of P (in % of extracted P) in different ppm regions as determined by solution31P NMR Treatment Orthophosphate region Monoester region Diester region Pyrophosphate region
7 to 5.7 ppm 5.7 to 3.4 ppm 0.2 to−1.0 ppm −4 to −4.6 ppm mg P kg−1(% of P extracted with NaOH–EDTA)
WL-M-Ca 209 (75) 66 (24) 2.5 (0.9) 2.8 (1.0) WL-B-C 205 (78) 57 (22) 2.4 (0.9) 0.1 (0.0) WW-B-C 243 (79) 58 (19) 4.0 (1.3) 4.3 (1.4) WS-M-D 236 (69) 98 (28) 6.9 (2.0) 3.8 (1.1) WS-M-C 196 (72) 72 (26) 4.7 (1.7) 1.4 (0.5) 1979 94 (59) 62 (39) 2.7 (1.7) 1.1 (0.7)
aTreatment abbreviations indicate the rotation (WL wheat–lupin, WW wheat–wheat, WS wheat–subclover), stubble management (M mulching, B
burning) and tillage (C 3 cultivations, D direct drill)
Table 5 Treatment effects on absolute values and relative abundances of selected indicator fatty acids in the top 5 cm
Treatment Total fatty acids (μg g−1soil) Relative abundance of fatty acids (wt%) Ratio of fungi to bacteria Fungi Bacteria Gram-negative Gram-positive
WL-M-Ca 37.9abb 11.8ns 88.2ns 14.4bc 45.5ns 0.14ns WL-B-C 32.2b 9.8ns 90.2ns 13.9c 46.7ns 0.11ns WW-B-C 31.8b 8.0ns 92.0ns 20.1a 44.2ns 0.09ns WS-M-D 41.4a 10.4ns 89.6ns 16.9b 45.9ns 0.12ns WS-M-C 39.4ab 11.3ns 88.7ns 16.5bc 45.3ns 0.13ns ns Not significant
aTreatment abbreviations indicate the rotation (WL wheat–lupin, WW wheat–wheat, WS wheat–subclover), stubble management (M mulching, B
burning) and tillage (C 3 cultivations, D direct drill)
Microbial community composition
Treatment effects on the total amount and relative abun-dances of selected signature FAMEs are shown in Table5. The sum of all extracted signature fatty acids was highest in treatment WS-M-D and lowest in the two treatments with stubble burning. Relative abundances of fungi, bacteria and Gram-positive bacteria were similar in all treatments, while the relative abundance of Gram-negative bacteria was highest in WW-B-C and lowest in the two wheat–lupin rotations. The ratio of fungal to bacterial FAMEs was similar in all treatments, ranging from 0.09 to 0.14.
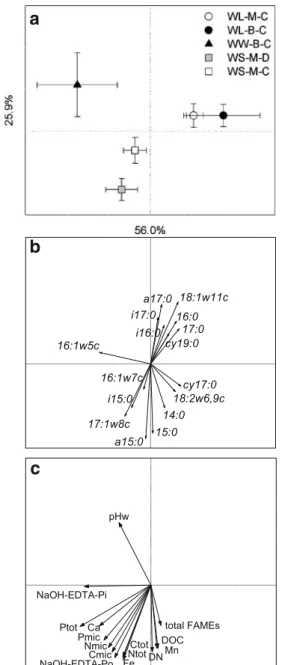
PCA of the relative abundances of the 16 signature fatty acids separated the five treatments primarily according to crop rotation, with the first and second axis explaining 50.2 and 24.6% of the total variation (data not shown). Ordination plots of PCA and RDA showed a similar pattern, with a higher percentage of total variation explained by the first two axes in RDA (Fig.2a). Microbial communities were similar in the two wheat–lupin rotations with either mulching or burning of stubble, while those in the two wheat–subclover rotations with direct drill or conventional cultivation differed from each other. The microbial community in the wheat–wheat rotation was different from those in the other four treatments.
Compared to the other treatments, treatment WW-B-C was characterised by a greater abundance of 16:1ω5c and lower abundances of 18:2ω6,9c, cy17:0 and 14:0 (Fig.2b). The separation of WS-M-D and WS-M-C was related to abundances of a range of fatty acids, e.g. greater abundan-ces of i15:0, 16:1ω7c and 17:1ω8c in WS-M-D and greater abundances of 18:1ω11c and other fatty acids in WS-M-C. The microbial community composition was significantly correlated to all environmental variables except resin-extractable P, NaOH-EDTA-resin-extractable Al and the position in the field (Fig. 2c). The separation of the microbial community composition in WW-B-C from the other treatments was related mainly to high pH and high NaOH-EDTA-extractable inorganic P. The microbial com-munities in wheat–lupin and wheat–subclover rotations were separated from each other through their differences in environmental variables such as microbial C, N and P, NaOH-EDTA-extractable organic P, and total C, N and P.
Discussion
Soil pH and C, N and P pools
Changes in soil pH were in agreement with an earlier study in the same experiment that had found a decrease in soil pH in all treatments during the first 8 years, followed by an
increase in pH in WW-B-C only (Heenan and Taylor1995). The acidifying effect of legumes has been described before (Slattery et al. 1998).
Microbial C, N and P as well as extractable C and N were all highest in treatment WS-M-D, which also had the
14:0 i15:0 a15:0 15:0 i16:0 16:1w7c 16:1w5c 16:0 i17:0 a17:0 17:1w8c cy17:0 17:0 18:2w6,9c 18:1w11c cy19:0
b
pHw Ctot Ntot Ptot Cmic Nmic Pmic DOC DN NaOH-EDTA-Pi NaOH-EDTA-Po Ca Fe Mn total FAMEsc
a
Fig. 2 Ordination plots of the microbial community composition in the five treatments generated by redundancy analysis using log-transformed relative abundances of 16 signature fatty acids and 18 environmental variables, showing a treatments (mean of three replicates, bidirectional standard deviation and % of variation explained by each axis shown), b signature fatty acids and c environmental variables that were significantly correlated to the microbial community composition by FAME analysis as generated by Monte Carlo permutation test. In b and c, the direction and length of arrows indicates the correlation with the community composition of the treatments as shown in a
highest amounts of total C, N and P, and were thus closely related to total C (r≥0.73, p<0.001). Amounts of microbial C and N were within the range typical for arable soils (Dalal 1998), while amounts of microbial P were in the lower range of values published for cropped soils (Oberson and Joner2005). Concentrations of resin-extractable P were high and not yield-limiting for annual crops (Cantarella et al. 1998), which can be explained by 26 years of continuous P fertilisation. Thus, the higher annual wheat grain yield during the first 24 years of the trial in the wheat–lupin and wheat–subclover rotations (3.7–4.0 tons ha−1) compared to continuous wheat (2.2 tons ha−1) can be attributed, at least partly, to improved nitrogen supply in rotations including legumes (Bünemann et al.2006).
The increase in total P in all treatments compared to 1979 confirmed the measured change in total P in the top 20 cm during the first 24 years of the trial (Bünemann et al.
2006). Compared to initial values, extractable inorganic P had increased in all treatments by 110–150 mg P kg−1. This confirms the findings of a previous study on soil samples collected between 1979 and 2003, which showed that the increase in total P as a result of P fertilisation was almost completely reflected in the increase in inorganic P (Bünemann et al.2006).
In the present study, the ignition method and extraction with NaOH–EDTA gave similar estimates of extractable inorganic P, while on a range of soils from semi-arid sites in the USA, NaOH–EDTA extraction recovered on average only 31% of inorganic P determined by ignition (Turner et al. 2003a). In accordance with Turner et al. (2003a), NaOH–EDTA extracted about 63% of organic P as determined by the ignition method. A potential overesti-mation of soil organic P by the ignition method due to changes in the solubility of inorganic P during ignition has been noted before, especially in highly weathered soils (Condron et al. 1990b). However, the main cause for the discrepancy is likely to be that a substantial proportion of soil organic P is insoluble in NaOH–EDTA. The fact that NMR found slightly higher amounts of inorganic P in the extracts than colorimetry may be due to the fact that some
monoester P compounds resonate in the region assigned to orthophosphate, or that some organic P compounds are hydrolysed during sample preparation and acquisition.
For all samples, the 31P NMR spectra indicated that monoester P was by far the most abundant form of organic P. This is consistent with previous soil P NMR studies (e.g. Condron et al.1990a; Turner et al.2003c). The absence of polyphosphate and phosphonates in the present study is in agreement with spectra obtained on NaOH–EDTA extracts of semi-arid arable soils in the USA (Turner et al.2003a), while in soils under permanent pasture in the UK, up to 2 and 3% of extracted P was detected as polyphosphate and phosphonate, respectively (Turner et al.2003c).
In addition to changes observed in the orthophosphate region, management affected both the amount and the proportion of monoester P (Table 4). However, no differ-ences in the relative sizes of the peaks within the monoester region were apparent (Fig. 1), suggesting that the same types of monoester P molecules were present in similar proportions in all samples. The large changes in amounts of P in the monoester region and small changes in the diester region appear to be in contrast to the interpretation of Turner et al (2003c) that the majority of P in the monoester region is protected from biological degradation through reactions with clays, metals and organic matter. A compi-lation of 31P NMR studies on tropical soils also pointed towards preferential mineralisation of phosphate diesters (Nziguheba and Bünemann 2005), and Condron et al. (1990a) observed the disappearance of diester P upon cultivation. However, in the present study, major changes in organic P amounts compared to 1979 were reflected in an accumulation of monoester P rather than a depletion of diester P, and the ratio of diester to monoester P was not related to the amount of organic P in the sample.
Microbial community composition
The multivariate analysis of all selected fatty acids separated the samples according to the treatments (Fig. 2a), while groups of indicator fatty acids did not
74.0% 15.8% 14:0 i15:0 a15:0 15:0 i16:0 16:1w7c 16:1w5c 16:0 i17:0 a17:0 17:1w8c cy17:0 17:0 18:2w6,9c 18:1w11c cy19:0 Ortho-P Monoester-P Diester-P Pyro-P WL-B-C WL-M-C WW-B-C WS-M-D WS-M-C
Fig. 3 Ordination plot of the microbial community composi-tion in the five treatments (in block 5 only) generated by redundancy analysis using log-transformed relative abundances of 16 signature fatty acids and 4 environmental variables (the amount of P in 4 NMR regions). Percentages indicate the % of variation explained by each axis
show clear treatment effects, except for a significant increase in the proportion of Gram-negative bacteria in WW-B-C compared to all other treatments (Table 5). The ordination plot of fatty acids based on RDA (Fig. 2b) illustrates that the different fatty acids indicative of a group of microorganisms such as Gram-positive bacteria (a15:0, i15:0, 16:0, i16:0, i17:0) can point in opposite directions. As a result, the sum of the five fatty acids is similar in all treatments. The multivariate analysis is, thus, more sensi-tive to detect treatment differences because it compares the relative abundances of the individual fatty acids among treatments.
Our study showed an overriding effect of crop rotation on the composition of the microbial community, most likely as a result of differences in type and amount of plant residue inputs and root exudates. This is illustrated by the separation of wheat–subclover and wheat–lupin rotations as a result of differences in environmental variables such as total C and N (Fig. 2a, c). Tillage also affected the community composition, but was not related to a decrease in the fungal fatty acid (18:2ω6,9c) as observed in another study (Pankhurst et al.2002).
A relationship between P forms and microbial community composition?
Forms of P in soil, in particular organic and condensed forms, may originate directly from plant inputs such as leaves, seeds and roots or may be derived from micro-organisms. To investigate a possible relationship between the microbial community composition and soil P forms, redundancy analysis was performed with the FAME data from block 5, using P forms as determined by solution31P NMR as environmental variables (Fig.3). The amount of P in the different NMR regions was significantly correlated to the microbial community composition by FAME analysis. Negative correlations were observed between monoester P and cy17:0 and 18:1w11c and between diester P and 16:0. This would suggest that these forms of P are not dominant in microbial communities with large proportions of these particular fatty acids. More meaningful may be the positive correlation between the amount of pyrophosphate and the fatty acids 16:1ω5c and 17:1ω8c, which may indicate storage of P in condensed forms in microbial communities with large proportions of these fatty acids.
The microbial P pool in the present study was small (Table 2), but could, due to its continuing turnover, contribute significant amounts of microbially synthesised organic P compounds over time. However, larger differ-ences in the microbial community composition and soil P forms than in the present study as well as the absence of plant residue addition will be required to elucidate the role of microorganisms in the synthesis of soil organic P.
Conclusions
Long-term management strategies with regards to crop rotation, stubble management and tillage affected the investigated soil characteristics to different degrees. Crop rotation had an overriding effect on soil organic and microbial C, N and P, with stable or increasing contents during 26 years in wheat–subclover rotations, and decreas-ing contents in wheat–lupin and wheat–wheat rotations. Stubble burning in particular led to losses of soil organic matter. The same forms of P as determined by solution31P NMR occurred in all treatments, but in different amounts. In particular, major peaks in the monoester regions were greatly enhanced in the treatment with an accumulation of soil organic matter. These forms of soil organic P could be of plant or microbial origin. The microbial community composition was primarily differentiated by crop rotation and secondly by tillage treatments. A potential linkage of soil P forms and the microbial community composition needs to be investigated further.
Acknowledgements This work was carried out within the project ‘Biological cycling of P in agricultural soils in Southern Australia’ funded by the Grain Research and Development Corporation. We are very grateful to NSW Agriculture for maintaining the field experiment and giving us access to fresh and archived samples. Many thanks to Rebecca Stonor for excellent support in the laboratory, Bruce Hawke for FAME analysis on the GC, and Jason Kirby for ICP analysis.
References
Bünemann EK, Bossio DA, Smithson PC, Frossard E, Oberson A (2004) Microbial community composition and substrate use in a highly weathered soil as affected by crop rotation and P fertilization. Soil Biol Biochem 36:889–901
Bünemann EK, Heenan DP, Marschner P, McNeill AM (2006) Long-term effects of crop rotation, stubble management and tillage on soil phosphorus dynamics. Aust J Soil Res 44:611–618 Cade-Menun BJ, Preston CM (1996) A comparison of soil extraction
procedures for P-31 NMR spectroscopy. Soil Sci 161:770–785 Cantarella H, van Raij B, Quaggio JA (1998) Soil and plant analyses
for lime and fertilizer recommendations in Brazil. Commun Soil Sci Plant Anal 29:1691–1706
Chan KY, Heenan DP (1993) Surface hydraulic properties of a Red Earth under continuous cropping with different management practices. Aust J Soil Res 31:13–24
Chan KY, Heenan DP, Oates A (2002) Soil carbon fractions and relationship to soil quality under different tillage and stubble management. Soil Till Res 63:133–139
Condron LM, Frossard E, Tiessen H, Newman RH, Stewart JWB (1990a) Chemical nature of organic phosphorus in cultivated and uncultivated soils under different environmental conditions. J Soil Sci 41:41–50
Condron LM, Moir JO, Tiessen H, Stewart JWB (1990b) Critical evaluation of methods for determining total organic phosphorus in tropical soils. Soil Sci Soc Am J 54:1261–1266
Dalal RC (1998) Soil microbial biomass—what do the numbers really mean? Aust J Exp Agric 38:649–665
Drenovsky RE, Elliott GN, Graham KJ, Scow KM (2004) Compar-ison of phospholipid fatty acid (PLFA) and total soil fatty acid methyl esters (TSFAME) for characterizing soil microbial communities. Soil Biol Biochem 36:1793–1800
FAO/ISRIC/ISSS (1998) World reference base for soil resources. FAO, Rome
Frostegård A, Bååth E, Tunlid A (1993) Shifts in the structure of soil microbial communities in limed forests as revealed by phospho-lipid fatty acid analysis. Soil Biol Biochem 25:723–730 Heenan DP, Chan KY (1992) The long term effects of rotation, tillage
and stubble management on soil mineral nitrogen supply to wheat. Aust J Soil Res 30:977–988
Heenan DP, Taylor AC (1995) Soil pH decline in relation to rotation, tillage, stubble retention and nitrogen fertilizer in SE Australia. Soil Use Manage 11:4–9
Heenan DP, Taylor AC, Cullis BR, Lill WJ (1994) Long-term effects of rotation, tillage and stubble management on wheat production in southern NSW. Aust J Agric Res 45:93–117
Heenan DP, Taylor AC, Chan KY, McGhie WJ, Collins D, Lill WJ (2000) The impact of long-term rotation, tillage and stubble management on lupin (Lupinus angustifolius) productivity. Field Crops Res 67:11–23
Heenan DP, Chan KY, Knight PG (2004) Long-term impact of rotation, tillage and stubble management on the loss of soil organic carbon and nitrogen from a Chromic Luvisol. Soil Till Res 76:59–68
Jongman RHG, ter Braak CJF, van Tongeren OFR (1987) Data analysis in community and landscape ecology. Pudoc, Wageningen, The Netherlands
Kögel-Knabner I (2006) Chemical structure of organic N and organic P in soil. In: Nannipieri P, Smalla K (eds) Nucleic acids and proteins in soil. Springer, Berlin, pp 23–48
Kouno K, Tuchiya Y, Ando T (1995) Measurement of soil microbial biomass phosphorus by an anion exchange membrane method. Soil Biol Biochem 27:1353–1357
Kuo S (1996) Phosphorus. In: Sparks DL (ed) Methods of soil analysis. Part 3. Chemical methods. SSSA/ASA, Madison, WI, pp 869–919 Magid J, Tiessen H, Condron LM (1996) Dynamics of organic
phosphorus in soils under natural and agricultural ecosystems. In: Piccolo A (ed) Humic substances in terrestrial ecosystems. Elsevier, Amsterdam, pp 429–466
Makarov MI, Haumaier L, Zech W, Marfenina OE, Lysak LV (2005) Can 31P NMR spectroscopy be used to indicate the origins of soil organic phosphates? Soil Biol Biochem 37:15–25
Murphy J, Riley JP (1962) A modified single solution method for the determination of phosphate in natural waters. Anal Chim Acta 27:31–36
Northcote KH (1979) A factual key for recognition of Australian soils. Rellim Technical Publications, Glenside, SA
Nziguheba G, Bünemann EK (2005) Organic phosphorus dynamics in tropical agroecosystems. In: Turner BL, Frossard E, Baldwin D (eds) Organic phosphorus in the environment. CABI, Wallingford, UK, pp 243–268
Oberson A, Joner EJ (2005) Microbial turnover of phosphorus in soil. In: Turner BL, Frossard E, Baldwin D (eds) Organic phosphorus in the environment. CABI, Wallingford, Oxon, UK, pp 133–164 Ohno R, Zibilske LM (1991) Determination of low concentrations of phosphorus in soil extracts using malachite green. Soil Sci Soc Am J 55:892–895
Pankhurst CE, Yu S, Hawke BG, Harch BD (2001) Capacity of fatty acid profiles and substrate utilization patterns to describe differ-ences in soil microbial communities associated with increased salinity or alkalinity at three locations in South Australia. Biol Fertil Soils 33:204–217
Pankhurst CE, Kirkby CA, Hawke BG, Harch BD (2002) Impact of a change in tillage and crop residue management practice on soil chemical and microbiological properties in a cereal-producing red duplex soil in NSW, Australia. Biol Fertil Soils 35:189–196 Saunders WMH, Williams EG (1955) Observations on the determi-nation of total organic phosphorus in soils. J Soil Sci 6:254–267 Slattery WJ, Edwards DG, Bell LC, Coventry DR, Helyar KR (1998) Soil acidification and the carbon cycle in a cropping soil of north-eastern Victoria. Aust J Soil Res 36:273–290
Turner BL, Cade-Menum BJ, Westermann DT (2003a) Organic phosphorus composition and potential bioavailability in semi-arid arable soils of the western United States. Soil Sci Soc Am J 67:1168–1179
Turner BL, Mahieu N, Condron LM (2003b) Phosphorus-31 nuclear magnetic resonance spectral assignments of phosphorus com-pounds in soil NaOH–EDTA extracts. Soil Sci Soc Am J 67:497– 510
Turner BL, Mahieu N, Condron LM (2003c) The phosphorus composition of temperate pasture soils determined by NaOH– EDTA extraction and solution 31P NMR spectroscopy. Org Geochem 34:1199–1210
Vance ED, Brookes PC, Jenkinson DS (1987) An extraction method for measuring soil microbial biomass C. Soil Biol Biochem 19:703–707
Wardle DA (1992) A comparative assessment of factors which influence microbial biomass carbon and nitrogen levels in soil. Biol Rev 67:321–358
Zak DR, Pregitzer KS, Curtis PS, Holmes WE (2000) Atmospheric CO2 and the composition and function of soil microbial communities. Ecol Appl 10:47–59