Investigation of 6T@SWCNT by Cs-Corrected Transmission Electron
Microscopy
B. Bártová,* S. Lazar,**,*** G.A. Botton***, M. Milko,**** and C. Hébert*
* LSME, École Polytechnique Fédérale de Lausanne, CH-1015 Lausanne, Switzerland ** FEI Electron Optics, 5600 KA Eindhoven, The Netherlands
*** Canadian Centre for Electron Microscopy, McMaster Univ., Hamilton, ON, Canada L8S 4M1 **** Atomistic Modeling and Design of Materials, University of Leoben, A-8700 Leoben, Austria Conjugated rigid rod molecules are extensively studied for their optical and semiconducting properties. Since their size is suitable for the inclusion in SWCNTs, they are optimal candidates molecules to obtain hybrid systems emitting in the visible spectral range [1]. Such hybrids systems are called peapods where the nanotube is the “pod” and the inserted molecule the “pea”. Successful encapsulation of molecules into nanotubes has been previously reported on many occasions using fullerenes or fullerenes derivative as the pea molecule [2].
Here we present the encapsulation of thiophene oligomer α-sexithiophene (6T) (the pea molecule) inside SWCNTs (the pod). The synthesis of the peapods was based on the sublimation of the
oligothiophenes in a sealed quartz tube at 10-3 Torr. Extensive washing of the resulting peapods was
performed in order to remove non-encapsulated molecules. The peapods where then sonicated in DMF or toluene and a drop of the solution was dispersed on a holey carbon film.
The most direct technique being able to visualize the microstructure of nanotubes with encapsulated molecule is high-resolution transmission electron microscopy (HRTEM). A field emission TEM (FEI Titan 80-300 Cubed) equipped with a post-specimen aberration corrector was operated at 80 kV so as to minimize the knock-on damage of the nanostructure. HRTEM images proved the successful encapsulation of 6T molecules inside the SWCNT. All the results were compared with image simulations based on standard multislice procedure. For image simulations, we used a (15,0) nanotube with two 6T molecules accommodated inside the tube in two possible configurations. The HRTEM images (e.g. Figure 1) revealed that the 6T molecules are accommodated along the sidewall of the nanotube. In some cases the molecules are bent/twisted inside the nanotube and continue alongside both sidewalls. When present, the molecules do not fill the entire tube. It is also observed that the diameter of the tubes is occasionally modified (Figure 1). The occurrences where only one single molecule is present inside the tube are rather rare. Comparisons with calculated images (Figure 2) were used to determine the location and orientation of the molecule within the tube. Comparison of the experimental images with calculations suggests that it should be possible to determine whether the molecules are either in standing or in lying position and whether the molecules are twisted due to the confinement within the tube.
References
[1] Vostrowsky, O. & Hirsch, A. Molecular peapods as supramolecular carbon allotropes.
Angew. Chem.-Int. Edit. 43, 2326-2329 (2004).
[2] Kataura, H. et al. High-yield fullerene encapsulation in single-wall carbon nanotubes. Synth.
Met. 121, 1195-1196 (2001)
Microsc Microanal 15(Suppl 2), 2009 Copyright 2009 Microscopy Society of America doi: 10.1017/S1431927609098080
1334
https://doi.org/10.1017/S1431927609098080
[3] This research was supported by the NanoSci-ERA project NaPhoD.
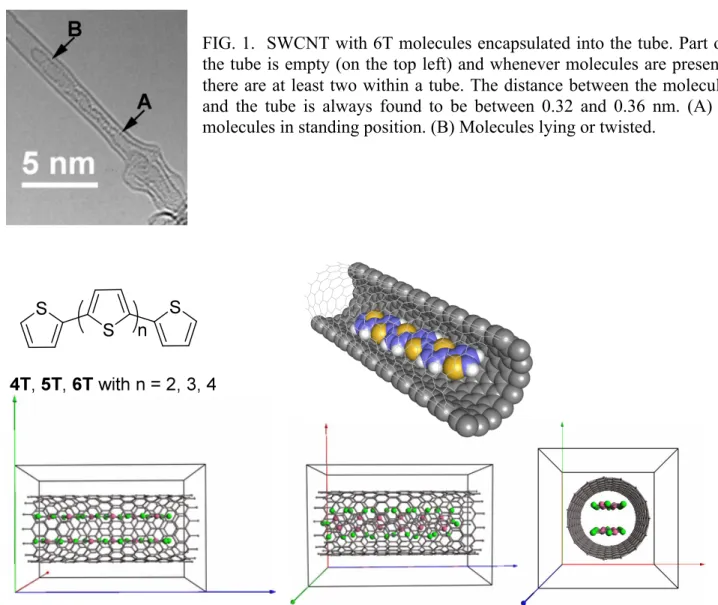
FIG. 1. SWCNT with 6T molecules encapsulated into the tube. Part of the tube is empty (on the top left) and whenever molecules are present, there are at least two within a tube. The distance between the molecule and the tube is always found to be between 0.32 and 0.36 nm. (A) 2 molecules in standing position. (B) Molecules lying or twisted.
FIG. 2. Formula of the 6T molecule and 3D model of the 6T molecule lying inside the SWCNT (top left and right respectively). Bottom row: Model used for the image simulation. Left: “standing” molecules, middle: “lying” molecules and right “parallel along the tube”.
FIG 3. Calculated focal series using the JEMS program by P. Stadelmann. Top: for the molecule in standing position; bottom for the molecule in lying position. Simulations were made with constant thickness of 2 nm and defocus step of 1 nm.
Microsc Microanal 15(Suppl 2), 2009 1335
https://doi.org/10.1017/S1431927609098080