HAL Id: hal-00316343
https://hal.archives-ouvertes.fr/hal-00316343
Submitted on 1 Jan 1998
HAL is a multi-disciplinary open access
archive for the deposit and dissemination of sci-entific research documents, whether they are pub-lished or not. The documents may come from teaching and research institutions in France or abroad, or from public or private research centers.
L’archive ouverte pluridisciplinaire HAL, est destinée au dépôt et à la diffusion de documents scientifiques de niveau recherche, publiés ou non, émanant des établissements d’enseignement et de recherche français ou étrangers, des laboratoires publics ou privés.
The spatial relationship between active regions and
coronal holes and the occurrence of intense geomagnetic
storms throughout the solar activity cycle
S. Bravo, J. A. L. Cruz-Abeyro, D. Rojas
To cite this version:
S. Bravo, J. A. L. Cruz-Abeyro, D. Rojas. The spatial relationship between active regions and coronal holes and the occurrence of intense geomagnetic storms throughout the solar activity cycle. Annales Geophysicae, European Geosciences Union, 1998, 16 (1), pp.49-54. �hal-00316343�
The spatial relationship between active regions and coronal holes
and the occurrence of intense geomagnetic storms throughout
the solar activity cycle
S. Bravo, J. A. L. Cruz-Abeyro, D. Rojas
Instituto de GeofõÂsica, Universidad Nacional AutoÂnoma de MeÂxico, CoyoacaÂn D.F., 04510, MeÂxico Received: 4 February 1997 / Revised: 20 June 1997 / Accepted: 4 July 1997
Abstract. We study the annual frequency of occurrence of intense geomagnetic storms (Dst < )100 nT) throughout the solar activity cycle for the last three cycles and ®nd that it shows dierent structures. In cycles 20 and 22 it peaks during the ascending phase, near sunspot maximum. During cycle 21, however, there is one peak in the ascending phase and a second, higher, peak in the descending phase separated by a minimum of storm occurrence during 1980, the sunspot maximum. We compare the solar cycle distribution of storms with the corresponding evolution of coronal mass ejections and ¯ares. We ®nd that, as the frequency of occurrence of coronal mass ejections seems to follow very closely the evolution of the sunspot number, it does not reproduce the storm pro®les. The temporal distribution of ¯ares varies from that of sunspots and is more in agreement with the distribution of intense geomagnetic storms, but ¯ares show a maximum at every sunspot maximum and cannot then explain the small number of intense storms in 1980. In a previous study we demon-strated that, in most cases, the occurrence of intense geomagnetic storms is associated with a ¯aring event in an active region located near a coronal hole. In this work we study the spatial relationship between active regions and coronal holes for solar cycles 21 and 22 and ®nd that it also shows dierent temporal evolution in each cycle in accordance with the occurrence of strong geomagnetic storms; although there were many active regions during 1980, most of the time they were far from coronal holes. We analyse in detail the situation for the intense geomagnetic storms in 1980 and show that, in every case, they were associated with a ¯are in one of the few active regions adjacent to a coronal hole.
Introduction
The solar cycle distribution of the frequency of occur-rence of intense geomagnetic storms (IGSs) was studied by Gonzalez et al., (1990), who de®ned intense storms as those when Dstmax< )100 nT. They found that IGS
distribution is not in agreement with the evolution of the sunspot number. Figure 1 shows the yearly number of IGSs (bars) from 1965 to 1994 (cycles 20, 21 and 22) and the corresponding yearly sunspot numbers (dots) ob-tained from the Solar Geophysical Data. We can see that in cycles 20 and 22 the maximum frequency of IGSs occurred at about sunspot maximum. In cycle 21, however, the frequency of IGSs has a peak during the ascending phase of the cycle, then a minimum at sunspot maximum, and then a higher peak in the declining phase. Although the occurrence of an IGS is, no doubt, associated with solar activity, there is no general agreement on the particular kind of solar events that can produce them. Fast and large coronal mass ejections (CMEs), ¯ares, and the eruption of prominences have been invoked by dierent authors (see review by Joselyn, 1995). In previous works we have shown that most of the IGSs can be associated with eruptive events (¯ares or prominence eruptions) occurring near a coronal hole near the solar central meridian (Bravo and Rivera, 1994; Bravo, 1997). In this work we shall study the solar cycle evolution of active regions near coronal holes and compare them with the distribution of IGSs. A com-parison with the solar cycle evolution of CMEs and ¯ares will be presented as well.
The solar cycle evolution of coronal mass ejections Recently it has been claimed by some authors that the origin of the interplanetary disturbances leading to IGSs are large and fast CMEs (e.g. Gosling, 1993). If this is so, we would expect some similarity between the solar
Correspondence to: S. Bravo [email protected]
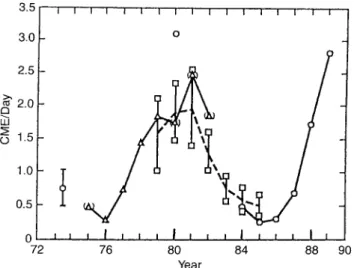
cycle distribution of IGSs and CMEs. Webb and Howard (1994) have studied the frequency of occurrence of CMEs over the solar cycle from 1973 to 1989, covering sunspot cycle 21 and the ascending phase and maximum of cycle 22. For this analysis they used the Skylab, SMM, Solwind and Helios data. Their results are shown in Fig. 2. We can see that the frequency of occurrence of CMEs is not similar to the distribution of IGSs for cycle 21. CMEs also peaked at sunspot maximum (see also Howard et al., 1986) while, as shown already, IGSs had a minimum during this period. The result is the same when considering only the ``major'' CMEs (lower squares in Fig. 2), which also peaked in 1980. Although Webb and Howard (1994) present CME data for only one and a half cycles, they conclude that CMEs tend to track the sunspot cycle in
both amplitude and phase. If this is so, then the comparison between CMEs and IGS will look like that of Fig. 1 and, like sunspots, they will not be well correlated with IGSs either.
The solar cycle distribution of ¯ares
A more traditional approach associates solar ¯ares with the interplanetary disturbances responsible for IGSs. Figure 3 shows the annual number of grouped solar ¯ares from 1965 to 1994 (cycles 20, 21, and 22) obtained from Solar Geophysical Data. The term ``grouped'' means that observations of the same event by dierent sites were lumped together and counted as one. We can see that the distribution of ¯ares diers from that of sunspots. A comparison of the histograms of Fig. 1 and 3 shows that the correspondence between the occurrence of ¯ares and IGSs is better than that of sunspots in the activity cycles 20 and 22. In cycle 20 the number of ¯ares also had a maximum in 1967 and another in 1970, as IGSs did; in cycle 22 both histograms show a peak in 1989, and more or less similar lower values in 1990 and 1991. For cycle 21, however, the ¯are number had a peak during 1979 and 1980 (the sunspot maximum) when the occurrence of IGSs had a minimum.
Solar cycle evolution of active regions and coronal holes From an analysis of the 10 IGSs that occurred between 1978 and 1979, combining interplanetary scintillation (IPS) tracking of interplanetary disturbances and solar eruptive event observations, we found that in most of the cases IGSs were associated with the occurrence of a ¯are or the eruption of a prominence near a coronal hole, near the solar central meridian (Bravo and Rivera, 1994). The same result was found independently by Gonzalez and Tsurutani (1994) and Gonzalez et al. (1996). According to this, the spatial relation between
Fig. 1. Annual number of IGSs (bars) from 1965 to 1994, corre-sponding to solar cycles 20, 21 and 22. Yearly sunspot numbers are also shown as dots. Both sets of data were obtained from Solar Geophysical Data
Fig. 2. Rate of occurrence of CMEs over the solar cycle from 1973 to 1989. The data correspond to coronagraphs on Skylab and SMM (circles), and P78-1 (squares) satellites, and to the Helios 1 and 2 photometers (triangles). Two Solwind (P78-1) rates are given, one for all CMEs and a lower one for only ``major'' CMEs (from Webb and Howard, 1994)
Fig. 3. Annual number of grouped (active region) solar ¯ares from 1965 to 1994 taken from Solar Geophysical Data
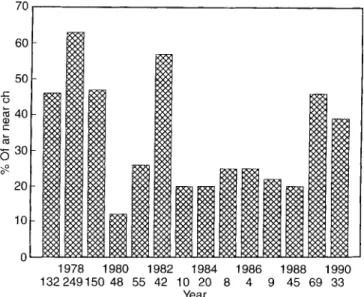
active regions and coronal holes should also be a determinant of the geoeectiveness of a solar eruptive event. Coronal hole sizes and positions change through-out the sunspot cycle. During the minimum there are large coronal holes concentrated over the Sun's poles, possibly with a low-latitude extension. As the activity cycle progresses, polar coronal holes grow smaller and mid and low-latitude coronal holes start to appear, entering the active region zone. The tracking of coronal hole evolution is rather new and maps of them exist only from 1977, the ascending phase of cycle 21. To see if the combined evolution of coronal holes and active regions aects, in general, the occurrence of IGSs, we study the spatial relation between active regions and coronal holes from 1977 to 1990, covering the maxima of sunspot cycles 21 and 22, to compare with the frequency of occurrence of IGSs. The coronal hole maps were obtained from McIntosh (private communication), Solar Geophysical Data, and the catalogue of Stewart et al. (1985). No coronal hole information was available after 1990. The active regions were obtained from Solar Geophysical Data. Figure 4 shows the annual percent-age of active regions whose centres were within an angular distance of 20° from a coronal hole border. Very small active regions (less than 10° of extension) were not considered, so a distance of 20° or less implies that both structures are nearly adjacent.
We see that the percentage of active regions near coronal holes also shows dierent evolving patterns during cycles 21 and 22, in a similar way to that presented by IGSs. In cycle 21 the annual percentage of active regions near coronal holes also has a maximum in 1978, a minimum in 1980, and another maximum in 1982, in agreement with the occurrence of IGSs. In cycle 22, the number of active regions near coronal holes has a peak during the year of sunspot maximum, as does the number of IGSs. To illustrate the situation described in
Fig. 4. Percentage of active regions within an angular distance of 20 degrees from a coronal hole border for the period 1977±1990, covering the maxima of cycles 21 and 22 (1980 and 1989, respectively). The annual number of active regions is given below each year
Fig. 5. Carrington rotation maps 1668 (May 1978), 1695 (May 1980), and 1712 (August 1981), corresponding to the sunspot maximum of cycle 21, and 1822 (November 1989), corresponding to the sunspot maximum of cycle 22, showing the corresponding coronal holes (white) and active regions (dashed). The circle in the Carrington rotation 1695 indicates the source region of the interplanetary disturbance that caused the 25 May IGS. The position of the solar central meridian at the day of the solar event is indicated at the top of the map
Fig. 4, the Carrington rotation maps 1668 (May 1978), 1695 (May 1980), 1712 (August 1981), and 1822 (November 1989), showing the corresponding coronal holes (white) and active regions of importance 3 or higher (hatched), are drawn in Fig. 5. The ®rst three correspond to years around the maximum of sunspot cycle 21 and the fourth to the maximum of cycle 22. We see that in May 1978 most of the active regions were near mid-latitude coronal holes, but this was not the case in May 1980. During the sunspot maximum, active regions were concentrated towards the equator, while coronal holes remained mainly at mid-latitudes, so losing their proximity. Although during 1980 many ¯ares took place (see Fig. 3), they were not very frequently in an suitable position to be associated with important geomagnetic eects because most of the active regions were far from coronal holes. The follow-ing year coronal holes came closer to the equator, lyfollow-ing now very close to active regions and so favouring the possibility that ¯ares would occur near a coronal hole and so be associated with strong geomagnetic eects. The spatial relationship between active regions and coronal holes for the maximum of cycle 22 is illustrated in Fig. 5 for Carrington rotation 1822, corresponding to November 1989. We see that, in this case, there was a close spatial relation between coronal holes and active regions. Then, a higher proportion of the many ¯ares in this year should have occurred near a coronal hole and so a large number of IGSs should have been produced during this year, as actually happened (see Fig. 1). Notice that the percentage of active regions near holes and the number of IGSs cannot be directly related because the occurrence of a ¯are in the active region near the hole, when both structures are near the solar central meridian, is necessary to produce an IGSs. A high percentage of active regions near holes and a high number of ¯ares will lead to a high number of IGSs, while either a small number of active regions near holes, or a small number of ¯ares will lead to a small number of IGSs.
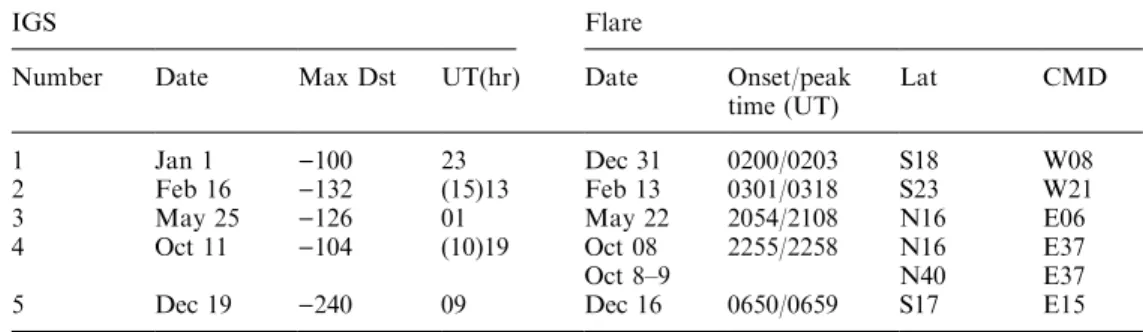
To give particular examples, we analyse in detail the intense geomagnetic storms of 1980. Table 1 shows the data for the 5 IGSs in 1980 including the maximum value of the hourly Dst index. For each one of them, a ¯are of importance 1 or more near the solar central meridian can be associated. These ¯ares are also listed in Table 1. In some cases, more than one ¯are can be associated with the IGS, but, as all occur in the same active region at about the same time, we only quoted
one. One of the 1980 IGSs (number 3) corresponds to solar Carrington rotation 1695, which is shown in Fig. 5. The circle in this ®gure contains the active region where the ¯are took place and, as can be seen, a coronal hole is adjacent to that active region. The position of the solar central meridian at the time of the solar event is indicated at the top of the map. We see that the activity associated with the IGS was in the only active region that was beside a coronal hole in that solar rotation and when both structures were near the solar central meridian. Figure 6 shows the solar source regions of the interplanetary disturbances that caused the other four IGSs. The position of the solar central meridian at the time of the solar events is indicated at the top of each map. We see that the situation is the same in each event. The ¯are(s) associated with the IGS occurred in an active region adjacent to a coronal hole near the solar central meridian. The circle in each map shows these associated structures and we can see that no more holes in those solar rotations were beside an active region. It is interesting to mention that for number 4 event, the eruption of a ®lament was also associated. This ®lament erupted at some time between the 8th and the 9th of October and its position is indicated on the correspond-ing map. Lookcorrespond-ing at the onset time of the storms and associated ¯ares we ®nd time delays ranging from 44 to 74 h. This is due to the fact that the interplanetary disturbances associated with the ¯ares, which actually are the ones causing the IGS, travel at dierent velocities between the Sun and the Earth.
Conclusions and discussion
The analysis presented here lends further support to the ®ndings that most of intense geomagnetic storms are associated with eruptive solar events near coronal holes. The results strongly suggest that the combined evolution of coronal holes and active regions throughout the solar cycle is a very important factor in determining the annual frequency distribution of intense geomagnetic storms. Although the observational evidence supports the occurrence of a ¯are near a coronal hole as the solar source of the interplanetary disturbance causing most of the intense geomagnetic storms, the physical connection between these two processes is not clear. It may be that in these cases the plasma ejected from the ¯are site can reach the interplanetary medium due to the nearness of the open ®eld lines of the coronal hole, and that such
Table 1. Intense geomagnetic storms in 1980 and associated ¯ares
IGS Flare
Number Date Max Dst UT(hr) Date Onset/peak
time (UT) Lat CMD
1 Jan 1 )100 23 Dec 31 0200/0203 S18 W08
2 Feb 16 )132 (15)13 Feb 13 0301/0318 S23 W21
3 May 25 )126 01 May 22 2054/2108 N16 E06
4 Oct 11 )104 (10)19 Oct 08 2255/2258 N16 E37
Oct 8±9 N40 E37
5 Dec 19 )240 09 Dec 16 0650/0659 S17 E15
plasma constitutes, or generates, the interplanetary disturbance causing the IGS. But it is also possible that the ¯are material itself does not leave the ¯are's region,
but the ¯aring process produces an eect on the overlying coronal plasma and ®eld which in turn gives rise to a geoeective interplanetary disturbance. Anoth-er possibility is that the ¯are is only a consequence of some kind of large-scale reorganisation of the coronal plasma and magnetic ®eld involving ®eld line reconnex-ion. This process, when occurring near a coronal hole, leads to a potentially geoeective solar wind distur-bance. There is a general agreement that a CME is always involved in every major interplanetary distur-bance, and it has been shown that most of CMEs are not associated with ¯ares (e.g. Webb and Howard, 1994). It could be possible that those CMEs that are associated with ¯ares and occur near a coronal hole can be particularly geoeective. However, no clear dierence between these CMEs and the rest of them can be observed (see for instance the results of the general Solwind/Helios survey in Sheeley et al., 1985). Flare-associated CMEs are not necessarily wide or fast, and they certainly cannot be the ``major'' ones shown in Fig. 2, because their frequencies do not coincide with that of IGSs. More solar, interplanetary, and geomag-netic correlated observations are still needed, as well as more models of the phenomenology of eruptive solar events, in order to understand why an IGS is associated with the occurrence of a ¯are near a coronal hole.
Finally we want to comment on the possibility of a solar contribution to a 22-y cycle in geomagnetic activity. In the two cycles analysed we showed that the dierent frequency of occurrence of IGSs was due to a dierent evolution of solar coronal holes and active regions around each maximum. We have pointed out that the maximum strength of the Sun's polar magnetic ®eld and the minimum inclination of the heliomagnetic equator are dierent in odd and even cycles and suggested that these dierences could be explained with the presence of an inclined relic ®eld in the Sun (Bravo and Stewart, 1994). It has been observed for many cycles now that the galactic cosmic ray intensity recorded at Earth presents dierent evolution patterns in odd and even cycles. We have shown that these patterns followed very closely the evolution of a polar coronal hole size during the last two cycles (Bravo and Cruz-Abeyro, 1995, 1996), which suggests that polar holes evolve dierently in odd and even cycles. If this is the case, it could be expected that the general evolution of coronal holes, from polar to low-latitude positions, also presents dierent patterns in odd and even cycles, causing odd and even cycle dierences in geomagnetic activity, in particular in the distribution of strong geomagnetic storms.
Dierences in the geomagnetic activity in odd and even cycles were ®rst recognised by Chernosky (1966) and they have been attributed to the dierent polarity of the general solar magnetic ®eld in both kinds of cycles. Recently Cliver et al. (1996) have presented new evidence concerning the 22-y geomagnetic cycle using the aa index and focusing on the activity during the declining phase of the 11-y solar cycle, which is higher during even cycles. They claim that this 22-y variation is not attributable only to the Russell-McPherron eect
Fig. 6. Carrington rotation maps showing the solar source regions (circles) of the interplanetary disturbances that caused four of the 5 IGSs in 1980: January 1, February 16, October 11, and December 19. The position of the solar central meridian at the day of the solar events is indicated at the top of each ma
(Russell and McPherron, 1973) in conjunction with the Rosenberg-Coleman polarity eect (Rosenberg and Coleman, 1969), but also to an intrinsic 22-y solar variation (other than the polarity reversal). Russell and McPherron (1973) argued that, because of the inclina-tion of the solar equator to the ecliptic plane, the reversal of the solar dipole magnetic ®eld at the maximum of each sunspot cycle will result, on average, in more favourable solar wind-magnetosphere coupling for the second half of even cycles and ®rst half of odd cycles (for more details see Ponyavin, 1992; Cliver et al., 1996). Here we have presented the evolution of IGSs for only three cycles, and for just one odd cycle (cycle 19), and we have analysed the spatial relation between active regions and coronal holes in only two cycles. Therefore we cannot claim that there is a general 22-y cycle in the distribution of the annual frequency of IGSs, nor that there is a systematic dierence of the spatial relation between coronal holes and active regions in even and odd cycles. Although the similarity between the distri-butions of IGSs in cycles 20 and 22 and the recognition that the polar coronal holes evolve dierently in odd and even cycles suggest that this could be the case, we must wait for the evidence of more sunspot cycles.
Finally, we want to comment on the fact that some IGSs have been associated with ®lament eruptions and not with ¯ares. Thus, a similar study as the one presented here must be done with ®lament eruptions in order to better understand the frequency of occurrence of IGSs throughout the solar cycle.
Acknowledgements. We thank P. S. McIntosh for providing us with the coronal hole maps. This study was partially supported by DGAPA Project IN-103996 and CONACyT Project 3139T.
Topical Editor R. Schwenn thanks G. K. Rangarajan and another referee for their help in evaluating this paper.
References
Bravo, S., The forecasting of intense geomagnetic storms, Geo®s. Int., 36, 127, 1997.
Bravo, S. and A. L. Rivera, The solar causes of major geomagnetic storms, Ann. Geophysicae, 12, 113, 1994.
Bravo, S. and G. A. Stewart, The inclination of the heliomagnetic equator and the presence of an inclined relic ®eld in the Sun, Astrophys. J., 446, 431, 1994.
Bravo, S. and J. A. L. Cruz-Abeyro, Galactic cosmic ray intensity at Earth and polar coronal hole area, in Proc. 24th Int. Cosmic Ray Conf., 3, 538, 1995.
Bravo, S. and J. A. L. Cruz-Abeyro, The 22-y-modulation of galactic cosmic rays and its relation to coronal holes, Geophys. Res. Lett., 23, 613, 1996.
Chernosky, E. J., Double sunspot-cycle variation in terrestrial magnetic activity, 1884±1963, J. Geophys. Res., 71, 965, 1966. Cliver, E. W., V. Boriako, and K. H. Bounar, The 22-y cycle of
geomagnetic and solar wind activity. J. Geophys. Res., 101, 27091, 1996.
Gonzalez, W. D. and B. T. Tsurutani, Interplanetary magneto-spheric coupling from ISEE-3, in Solar Terrestrial Energy Program, Eds D. N. Baker, V. O. Papitashvili and M. J. Teague Pergamon 1994, p. 197.
Gonzalez, W. D., I. C. Gonzalez, and B. T. Tsurutani, Dual-peak solar cycle distribution of intense geomagnetic storms, Planet. Space Sci., 38, 181, 1990.
Gonzalez, W. D., B. T. Tsurutani, P. S. McIntosh, and A. L. Cla de Gonzalez, Coronal hole-active region- current sheet (CHARCS) association with intense interplanetary and geomagnetic activ-ity, Geophys. Res. Lett., 23, 2577, 1996.
Gosling, J. T., The solar ¯are myth, J. Geophys. Res, 98, 18937, 1993.
Howard, R. A., N. R. Sheeley Jr., D. J. Michels, and M. J. Koomen, The solar cycle dependence of coronal mass ejections, in The Sun and the heliosphere in three dimensions, Ed. R.G. Marsden, D. Reidel, Dordrecht, 1986, p. 107.
Joselyn, J. A., Geomagnetic forecasting: the state of the art, Rev. Geophys., 33, 383, 1995.
Ponyavin, D. I., Reconstruction of the IMF polarity in some recurrent high velocity solar wind streams, in Proceedings of the First Soltip Symposium, vol 2, Eds. by S. Fischer and M. Vandas, p. 182, Academy of Science, Prague, Czech, 1992. Rosenberg, R. L. and P. J. Coleman, Heliographic latitude
dependence of the dominant polarity of the interplanetary magnetic ®eld, J. Geophys. Res, 74, 5611, 1969.
Russell, C. T. and R. L. McPherron, Semiannual variation of geomagnetic activity, J. Geophys. Res., 78, 92, 1973.
Sheeley, Jr. N. R., R. A. Howard, M. J. Koomen, D. J. Michels, R. Schwenn, K. H. Muhlhauser, and H. Rosenbauer, Coronal mass ejections and interplanetary shocks, J. Geophys. Res., 90, 163, 1985.
Stewart, R. T., H. M. C. Evson, and L. H. Heisler, Culgoora catalogue of solar radio noise storms, 1973 to 1984, Proc. ASA, 6, 231, 1985.
Webb, D. F. and R. A. Howard, The solar cycle variation of coronal mass ejections and solar wind mass ¯ux, J. Geophys. Res., 99, 4201, 1994.