HAL Id: hal-00125264
https://hal-insu.archives-ouvertes.fr/hal-00125264
Submitted on 23 Jul 2007HAL is a multi-disciplinary open access archive for the deposit and dissemination of sci-entific research documents, whether they are pub-lished or not. The documents may come from teaching and research institutions in France or abroad, or from public or private research centers.
L’archive ouverte pluridisciplinaire HAL, est destinée au dépôt et à la diffusion de documents scientifiques de niveau recherche, publiés ou non, émanant des établissements d’enseignement et de recherche français ou étrangers, des laboratoires publics ou privés.
surface.
Alain Burgisser, Bruno Scaillet
To cite this version:
Alain Burgisser, Bruno Scaillet. Redox evolution of a degassing magma rising to the surface.. Nature, Nature Publishing Group, 2007, 445, pp.194-205. �10.1038/nature05509�. �hal-00125264�
Redox evolution of a degassing magma rising to the surface
Alain Burgisser and Bruno Scaillet [email protected]
ISTO-CNRS, 1a rue de la Férollerie, 45071 Orléans cedex 2, France
main text : 1828 words abstract : 279 Words 29 references
3 figures, 1 table
Supplementary Information
Volatiles carried by magmas, either dissolved or exsolved, exert a fundamental role on a variety of geological phenomena such as magma dynamics1-5 or the composition of Earth’s atmosphere6. In particular, the redox state of volcanic gases emanating at the Earth surface is widely believed to mirror that of their magma source, and thought to have exerted a first order control on the secular evolution of atmospheric oxygen6-7. However, fO2 estimates retrieved from lava or gas chemistry may differ by as much as one log unit8-10, the reason of such a difference remaining obscure. Here, by using a coupled chemical-physical model of conduit flow, we show that the redox state evolution of an ascending magma, and thus of its coexisting gas phase, is strongly dependent on both the composition and amount of gas in the reservoir. Magmas with no sulphur show a systematic fO2 increase during ascent, by as much as
2 log units. Magmas with sulphur show also a change of redox state during ascent, but the direction of change depends on the initial fO2 in the reservoir. Our calculations closely reproduce the H2S/SO2 ratios of volcanic gases observed at convergent settings, yet the difference between fO2 in the reservoir and that at the exit of the volcanic conduit may be as much as 1.5 log unit. This fO2 evolution provides one explanation for the apparent conflict documented between lava and gas based fO2 estimates. We thus conclude that the redox state of erupted magmas is not necessarily a good proxy of the redox state of the gases they emit. Our findings may require re-evaluation of current models aimed at quantifying the role of magmatic volatiles on geological processes.
Recent studies have investigated the role of redox equilibria during volatile exsolution but the solution of the numerical problem requires fixing either iron or sulphur redox states11: as a result, the effect of decompression on oxygen fugacity (fO2) cannot be evaluated. In
the present work, we relax such an assumption by taking advantage of the fact that the solubility laws of key volatile species other than H2O and CO2 have been recently
determined, in particular that of H2, SO2, and H2S 12,13. In this work we considered gas
phases in the system H-O-S, with 6 species (H2O, H2, SO2, H2S, S2, and O2) in which the
following redox equilibria occur:
H2 + ½ O2 = H2O (1)
H2S + ½ O2 = H2O + ½ S2 (2)
Standard thermodynamic considerations14,15 show that once total pressure, P, temperature, T, and two additional intensive parameters such as water and hydrogen fugacities (fH2O
and fH2) are known, the fugacities of all remaining species (fH2S, fO2, fS2, fSO2) are fixed
and the gas phase composition in the H-O-S system is fully determined. Each species i in the gas has a mole fraction mi :
Σmi = 1
The gas phase is modelled as an ideal mixture of non-ideal gases, a valid approximation in the pressure range considered here. Departure from ideal behaviour of end-member species is accounted for by the fugacity coefficient γi which is fixed by P and T16. The total weight
fraction of each species (wTi) is the sum of its exsolved part (wgi) and its dissolved part:
wTi = wgi + ai (γimiP)bi
where ai and bi are solubility constants experimentally determined (Table 1). We use a
homogeneous, one-dimensional conduit flow model5 to simulate magma ascent under closed system and equilibrium conditions. Magma rises in a cylindrical conduit at constant mass flux and volatile exsolution affects the flow through changes in buoyancy and viscosity (cf. Supplementary Information). Calculations are performed by first fixing P, T,
fH2O fH2, and the amount of gas in the reservoir. The model seeks first the equilibrium
distribution of each volatile species between gas and melt prior to ascent. Then, at each next lower pressure, mass conservation requires that total amounts of each element (O, H, and S) remain constant. Using this constraint, the model calculates the equilibrium distribution of volatile species, which in turn affects ascent dynamics.
Redox equilibrium during magma ascent involving dissolved iron can be written such as:
The importance of such a reaction will be dictated by the initial amount of dissolved iron oxides. It is currently not possible to include iron as a species into our thermodynamic model because the activities of FeO and Fe2O3 are not known. We thus
simulated the redox effect of iron by using an empirical model17. Runs under typical storage conditions of arc rhyolites (≤1 wt% total iron and fO2 between NNO-1 and
NNO+1, fO2 being referenced to the solid buffer Ni-NiO, such that NNO+1 means an fO2
one order of magnitude higher than NNO) show that reaction (4) partly buffers changes in
fO2 when little gas is present in the reservoir (<0.2 unit log without changing the redox
trend during ascent, see SI). In contrast, in iron-rich liquids such as basalts, the buffering capacity of iron species will be higher. Thus our results primarily apply to magmas in which the residual melt is rhyolitic, as commonly observed in arc settings. We did not consider the role of iron in crystals because the role of solid buffers as a first order mechanism controlling redox state during magma ascent can be ruled out on kinetic grounds. The lattice diffusion processes that this mechanism requires are exceedingly slow compared to those in gas or liquid phases. Similarly, for simplicity we have not investigated the role of CO2 since detailed petrologic studies of silicic magmas in arcs
show them to have little or no CO2 under pre-eruptive conditions18. In general, however,
introduction of CO2 will lower fH2O and thus drives our calculated values toward lower fO2 via equilibrium (1). Our assumption of equilibrium implies that the model might not
capture the chemical evolution of the gas within rapidly decompressed magmas such as in Plinian eruptions, in which the contrasted diffusive kinetics of volatile species may inhibit attainment of equilibrium. Both H2O and H2 are, however, fast diffusing species relative to
CO2 and S-bearing ones18,19. Thus, if physical fractionation of volatile species arises during
ascent, the gas phase composition will be driven toward the system H-O (C and S species remain in the melt, such as documented for S for the 1991 Pinatubo eruption20), which will
exert a dominant control on the redox state of escaping gases. Our model represents thus a fundamental end-member case toward which magmas, notably those intermediate to silicic in arc settings, tend to evolve.
We have explored the following range of starting conditions typical of silicic arc magmas21,22: an initial pressure from 2000 to 3000 bars, fO2 from NNO+2 to NNO-0.5,
bulk iron contents (FeO*) up to 3 wt%, bulk water contents up to 10.4 wt% and bulk sulphur contents up to 3 wt%, the two latter parameters being adjusted by varying the amount of excess gas in the reservoir (up to 5 wt%23). The conduit radius was fixed at 5 m for all runs. Temperature has been fixed to 825°C, i.e. typical of rhyolite magmas21, and melt density to 2140 kg/m3, though different choices will not affect the trends observed.
Runs are constrained to reach atmospheric pressure at the vent, which yields initial ascent rates between 0.7 and 12 m/s. Because degassing occurs in equilibrium, changes in chemistry as a function of pressure occur regardless of ascent speed. In all cases, the simulations are carried down to atmospheric pressure though it can be anticipated that the last increments of fO2 change we compute might not be reached owing either to the
inhibiting effect of viscosity at low water content24 or to gas loss once a permeability threshold is reached such that the system becomes open to gas25.
We first consider the S- and Fe-free case. All simulations performed showed essentially identical behaviour in terms of redox state evolution, i.e. the fO2 of the magma
increases during ascent, the magnitude of increase being more or less dampened by the amount of free gas present in the reservoir. A representative example is shown on Figure 1, corresponding to a magma initially stored at 2000 bars, at an fO2 of NNO-0.2, with a melt
H2O content of 5.46 wt% and for excess gas contents of 0.1, 1, and 5 wt%. The simulations
show that the magnitude of fO2 change increases when the amount of excess gas decreases,
We now explore the case of sulphur-bearing rhyolite magma with 1 wt.% of total iron and stored at 2000 bar, illustrating our calculations with three different initial fO2 but
similar initial dissolved sulphur contents (ca. 200-250 ppm). A magma starting at an fO2 of
NNO-0.5 displays a continuous increase in its fO2 as it ascends, except in the last few
hundred bars where a reversal in fO2 toward reduction occurs (Fig. 2). The magnitude of
change is strongly dependent on the amount of gas initially present in the reservoir. At low gas content (0.1 wt%), the fO2 rises by 0.7 log unit relative to starting conditions. With 5
wt% gas, the magma has a redox state nearly constant up to a pressure of 100 bars. When the starting fO2 in the reservoir is at NNO (Fig. 2), the magma undergoes oxidation only
for gas-poor conditions (0.1 wt%). Higher amounts of gas in the reservoir impart a reducing trend in the fO2 evolution during ascent, the final fO2 differing by almost one log
unit from the initial value for an initial gas content of 5 wt%. When the initial fO2 in the
reservoir is at NNO+1.5, the magma undergoes a significant reduction during ascent regardless of its initial gas content (Fig. 2). In this case, the drop in fO2 may exceed 1.5 log
units at near atmospheric conditions for gas rich conditions.
The change in fO2 during decompression is accompanied by dramatic changes in
gas phase composition (Fig. 3). Our calculated H2S/SO2 ratios fall in the range 0.1-10,
which is comparable to that of volcanic gases measured at convergent settings for silicic to intermediate magmas26 (Fig. 3). Clearly, a variety of H2S/SO2 ratio can be produced from
magmas having common initial redox states but different amounts of gases. Conversely, a given H2S/SO2 ratio may be produced from a wide range of starting redox conditions. For
instance a H2S/SO2 ratio of about one can be produced from a magma initially stored at
NNO+1.5 with 5 wt% gas, or from a magma initially at NNO-0.5 with 0.1 wt% gas (Fig. 3a). Thus, anticipating the H2S/SO2 ratio of gases emanating from a given reservoir would
reservoir and the depth at which gas and melt are physically separated. Although such a rich behaviour precludes a simple explanation for each trend calculated, a sensitivity analysis of our model suggests that water exsolution plays an important role in oxidizing the system, and that, on the other hand, the complex pressure dependence of the redox equilibria (1)-(3) contribute to the reducing trends. Our findings have thus obvious implications for the use of volcanic gases as a monitoring tool of volcanic activity. They also illustrate the important role of sulphur. Magmas poor in sulphur or in which reactions involving sulphur are kinetically inhibited are likely to undergo a significant increase in their redox state during ascent.
The above results show that the redox state that magma records at depth does not necessarily mirror that of its escaping gases, in particular when they are released from levels shallower than the main reservoir. Thus, from a broader perspective, our findings have implications for our understanding on how past volcanic activity may have impacted Earth’s atmosphere. Current models of the evolution of atmospheric oxygen implicitly assume that the redox state of magmatic rocks can be taken as equal to that of their outgassed products6,7. Our calculations show that, for silicic magmas, this assumption holds true only under a restricted set of conditions (for instance a magma starting at NNO-0.5 with 1 wt% gas, Fig. 2). Oxidized silicic magmas are particularly prone to redox change during ascent. A recent study10 has stressed the difference in fO2 retrieved from
volcanic gas11 and volcanic glass12 at Kilauea volcano: the basaltic glass, which is fully
degassed, records an fO2 lower by 1.2 log unit than the gases. Although our model is
calibrated on Fe-poor liquids, its predictions are qualitatively in accord with such an observation which suggests that even for basaltic magmas in non-arc settings, redox
change during degassing may occur27. The corollary is that the iron redox state of a magma may significantly differ from its source, in contrast to conventional wisdom28. Altogether,
this suggests that equating the redox state and composition of present day volcanic gases to those emitted in the geologic past6 may not be a correct assumption.
References
1. Wilson, L., Sparks, R.S.J. & Walker, G.P.L. Explosive volcanic eruptions. IV. The control of magma properties and conduit geometry on eruption column behavior.
Geophys. J.R. Astron. Soc. 63, 117-148 (1980)
2. Papale, P. Strain-induced magma fragmentation in explosive eruptions. Nature 397, 425-428 (1999).
3. Huppert, H.E. & Woods, A.W. The role of volatiles in magma chamber dynamics.
Nature 420, 493-495 (2002).
4. Gonnerman, H.M. & Manga, M. Explosive volcanism may not be an inevitable consequence of magma fragmentation. Nature 426, 432-435 (2003).
5. Burgisser, A. & Gardner, J. Experimental constraints on degassing and permeability in volcanic conduit flow. Bull. Volc. 67, 42-56 (2005).
6. Holland, H.D. Volcanic gases, black smokers and the great oxidation event. Geochim.
Cosmochim. Acta 66, 3811-3826 (2002).
7. Kasting, J.F., Eggler, D.H. & Raeburn, S.P. Mantle redox evolution and the oxidation state of the atmosphere. J. Geol. 101, 245-257 (1993).
8. Gerlach, T.M. Comment on paper « Morphology and compositions of spinel in Pu’u’O’o lava (1996-1998), Kilauea volcano, Hawaii’-enigmatic discrepancies between lava and gas-based fO2 determinations of Pu’u’O’o lava, J. Volcanol. Geotherm. Res.
134, 241-244 (2004).
9. Gerlach, T.M. Oxygen buffering of Kilauea volcanic gases and the oxygen fugacity of Kilauea basalt. Geochim. Cosmochim. Acta 57, 795-814 (1993).
10. Roeder, P.L., Thornber, C. Proustovetov, A. & Grant, A. Morphology and composition of spinel in Pu’u’O’o lava (1996-1998), Kilauea volcano, Hawaii. J. Volcanol.
11. Moretti, R. & Papale, P. On the oxidation state and volatile behavior in multicomponent gas-melt equilibria. Chem. Geol. 213, 265-280 (2004)
12. Clemente, B., Scaillet, B. & Pichavant, M. The solubility of sulphur in hydrous rhyolitic melts. J. Petrol. 45, 2171-2196 (2004).
13. Gaillard, F., Schmidt, B. Mackwell, S. & McCammon, C. Rate of hydrogen–iron redox exchange in silicate melts and glasses. Geochim Cosmochim. Acta 67, 2427-2441 (2003).
14. Holloway, J.R. Thermodynamic modelling of geological materials: minerals, fluids and melts. Reviews in Mineralogy (eds. Carmichael, I.S.E. & Eugster, H.P.) 17, 211-233 (Mineralogical Society of America, Book Crafters, Chelsea, MI, 1987).
15. Scaillet, B. & Pichavant, M. Role of fO2 on fluid saturation in basalts. Nature, doi
10/1038 (2004)
16. Shi, P.F. & Saxena, F.K. Thermodynamic modeling of the C-H-O-S fluid system. Amer.
Mineral. 77, 1038-1049 (1992).
17. Kress, V.C., & Carmichael, I.S.E. The compressibility of silicate liquids containing Fe2O3 and the effect of composition, temperature, oxygen fugacity and pressure on their redox states. Contrib. Mineral. Petrol. 108, 82-92 (1991).
18. Wallace, P. Volatiles in subduction zone magmas: concentrations and fluxes based on melt inclusion and volcanic gas data. J. Volcanol. Geotherm. Res. 140, 217-240 (2004). 19. Watson, E.B. (1994). Diffusion in volatile-bearing magmas. In Carroll, M.R. &
Holloway, J.R (eds), Volatiles in magmas, Rev. Mineral. 30, 371-412.
20. Westrich, H.R. & Gerlach, T.M. Magmatic gas source for the stratospheric SO2 cloud
from the June 15, 1991 eruption of Mount Pinatubo. Geology 20, 867-870 (1992). 21. Scaillet, B. & Pichavant, M. Experimental constraints on volatile abundances in arc
magmas and their implications fro degassing processes, in Volcanic degassing, C. Oppenheimer, D. Pyle & J. Barclay (eds.) Geol. Soc. Spec. Pub. 213, 23-52 (2003)
22. Scaillet, B., Luhr, J. & Carroll, M.R. Petrological and volcanological constraints on volcanic sulfur emissions to the atmosphere. In Volcanism and the Earth’s Atmosphere, A. Robock & C. Oppenheimer (eds.), Geophys. Monog. 139, 11-40 (2003).
23. Wallace, P., Anderson, A.T. & Davis, A.M. Quantification of pre-eruptive exsolved gas contents in silicic magmas. Nature 377, 612-616 (1995).
24. Gardner, J.E., Hilton, M. & Carroll, M.R. Bubble growth in highly viscous silicate melts during continuous decompression from high pressure, Geochim. Cosmochim. Acta 64, 1473-1483 (2000).
25. Eichelberger, J.C., Carrigan, C.R., Westrich, H.R. & Price, R.H. Non explosive silicic volcanism. Nature 323, 598-602 (1986).
26. Symonds, R.B., Rose, W.I., Bluth, G.J.S., and Gerlach, T.M. Volcanic-gas studies: methods, results, and applications, in: Carroll, M.R., and Holloway, J.R. (eds) Volatiles in magmas, Reviews in Mineralogy, v. 30, p. 1-66 (1994).
27. Mathez, E.A. Influence of degassing on oxidation states of basaltic magmas. Nature 310, 371-375 (1984).
28. Carmichael, I.S.E. The redox states of basic and silicic magmas: a reflexion of their source regions. Contrib. Mineral. Petrol. 106, 129-141 (1991).
29. Holtz, F., Behrens, H., Dingwell, D.B. & Johannes, W. H2O solubility in haplogranitic
melts: compositional, pressure and temperature dependence. Am. Mineral. 80, 94-108 (1995).
Supplementary Information is linked to the online version of the paper at www.nature.com/nature
Acknowledgements
We thank M. Rutherford, P. Wallace, and an anonymous reviewer for critical comments that helped us to improve our model. A.B. acknowledges support from the Swiss National Science Foundation.
Authors Information
Reprints and permissions information is available at www.nature.com/reprints. The authors declare no competing financial interests and contributed equally to this work. Correspondence and requests for materials should be addressed to A.B. ([email protected])
Figure Captions
Figure 1: Fundamental relationship between magma ascent and magma redox state, for a rhyolite magma coexisting with a H-O gas. From gas content and composition at depth, the coupled model of conduit flow calculates the evolution of the physical and chemical conditions of the ascending magma. The effect of equilibrium degassing is a systematic increase in fO2 (referenced to the NNO buffer) with shallower pressure.
Representative cases for 3 initial values of exsolved volatiles with an fH2 initially
fixed at 10 bar.
Figure 2: Fundamental relationship between magma ascent and magma redox state, for a rhyolite magma coexisting with a H-O-S gas. Effect of initial redox state on its evolution during decompression. Representative cases for 3 starting values of exsolved volatiles with an fH2O initially fixed at 1000 bar. Initial redox state was
achieved by varying fH2 (∆NNO-0.5: fH2 = 10, ∆NNO+0: fH2 = 5.38, ∆NNO-1.5: fH2 = 1).
Figure 3: Evolution of the composition of an H-O-S gas phase during ascent of a rhyolite magma. A) Effect of the initial redox state on the ratio H2S/SO2 for 3 starting values
of fO2, each with three different gas contents (same initial conditions as in Fig. 2).
Natural range observed on active volcanoes in convergent settings26, and range calculated by phase equilibra experiments21 are also shown. B) Evolution of the gas composition for a magma oxidized at depth (∆NNO+1.5, 0.1 wt% gas). C) Evolution of the gas composition for a magma reduced at depth (∆NNO-0.5, 0.1 wt% gas). Contents of O2 are too low (<10 ppm) to be displayed
Table 1: Solubility constants species ai bi H2O 1.063 10-3 0.5399 H2 3.400 10-7 1.2800 SO2 1.632 10-10 1.3789 H2S 8.239 10-6 0.5145 O2 0 -S2 0 -
The ai and bi parameters were determined by fitting experimental
solubility data of corresponding species to an empirical equation of the form wi = ai fi bi. We have used data from ref . 12 for sulphur
1
10
100
1000
-0.5
0
0.5
1
1.5
2
0.1
1
5
Pressure (bar)
∆
N
N
O
Initial content
of gas (wt.%)
FIGURE 1
1
10
100
1000
-1-0.5
0
0.5
1
0.1
1
5
Pressure (bar)
∆ NNO
Initial content
of gas (wt.%)
FIGURE 2
252 ppm S
198 ppm S
1
10
100
1000
Pressure (bar)
0.1
1
5
Initial gas
content (wt.%)
∆NNO-0.5
∆NNO
1
10
100
0.1
1000
∆NNO+1.5
1
10
100 1000
Pressure (bar)
H
2S
SO
2H
2O
H
2∆NNO+1.5
S
2molar fraction
1
10
100 1000
Pressure (bar)
H
2S
SO
2H
2O
H
2∆NNO-0.5
S
2FIGURE 3
B
Measured volcanic gases
Calculated volatile compositions
10
-41
10
-310
-210
-110
-5molar fraction
C
10
-41
10
-310
-210
-110
-5the relationship between the ascent of magma and its redox state. The chemistry formulation is based on that of Clemente et al. (2004), whereas the physical part is based on Burgisser and Gardner (2005). The gas phase is composed of n species, each with a molar fraction mi:
1 1 =
∑
= n i i m (1)Conversion between molar fraction and weight fraction is:
∑
= j j j i i i M m M m x (2)where Mi are molecular weights of each species. The total weight fraction of each
species (wTi) is the sum of its exsolved part and its dissolved part:
( )
bi i i i gT Ti w x a f w = + (3)where wgT is total gas weight fraction, ai and bi are solubility constants determined
experimentally (Table 1), and fi is species fugacity. We assume the gas phase is an
ideal mixture of non-ideal gases, which yields the following expression for fugacities:
P m
fi =γi i (4)
where P is total pressure, and coefficients γi are calculated at each pressure step
following Shi and Saxena (1992). Using (2) and (4), (3) can be written as:
(
bi i i i j j i i gT Ti a mP M m M m w w = + γ)
∑
(5) System H-OThe gas phase is composed of 3 species (H2O, H2, and O2) that are in
equilibrium at all times:
(
)(
) ( )
1/2 2 1 2 2 1 − − = fH O fH fO K (6)where K1 is an equilibrium constant calculated according to Robie et al. (1979).
Replacing the fugacities by their expressions in (4) yields:
(
)(
) (
)
1/2 2 2 1 2 2 2 2 1 − − = m m m P K γH O H O γH H γO O (7)Initially, wgT and fH2 are set at a given pressure and temperature at depth. The
molar composition of the gas phase can be determined by using (4) to calculate mH2,
(1) and (7) to calculate mO2, and (1) to calculate mH2O. When decompression occurs,
mass conservation requires that total amounts of oxygen and hydrogen of the system remain constant. Total weight percents of atomic oxygen (wTO) and atomic hydrogen
(wTH) can be determined from initial gas composition by using:
⎟⎟ ⎠ ⎞ ⎜⎜ ⎝ ⎛ + = 2 2 2 2 2 O TO O H O TH O TO M W M w M w (8a)
⎠
⎝ H2O H2
and replacing the total amount of each species wTi in (8) by their expressions in (5):
(
)
∑
∑
+ + = j j O gT O H b O H O H O H j j O H gT O TO M m m w M P m a M m m w M w H O 2 2 2 2 2 2 2 2 γ (9a)(
)
(
)
2 2 2 2 2 2 2 2 2 2 2 2 2 H b H H H j j H gT O H b O H O H O H j j O H gT H TH M P m a M m m w M P m a M m m w M w γ H O γ H + + + =∑
∑
(9b)When total pressure decreases, the molar fractions (mH2O, mH2, and mO2) and
the total amount of volatiles exsolved (wgT) are constrained by mass conservation,
chemical equilibrium, and solubility laws embedded in the four equations (1), (7), (9a), and (9b). Using (1) and (7), mH2O and mH2 can be expressed as a function of mO2:
(
)
1 2 2 2 1 2 2 2 1 1 − ⎟ ⎟ ⎠ ⎞ ⎜ ⎜ ⎝ ⎛ + − = P m K m m O O H O H O O H γ γ γ O H O H m m m 2 =1− 2 − 2 (10)Combining (9a) and (9b) as to eliminate wgT and using (10) yields an
expression for mO2 that we solved with an iterative procedure to find its roots:
= + − − ) ( 2 ) 1 ( 2 2 O H2O O2 TO O H TH m m M w m M w
(
)
(
)
⎟⎟ ⎠ ⎞ ⎜⎜ ⎝ ⎛ + − − + − 2 2 2 2 2 2 2 2 2 2 2 2 2 1 1 1 ) 1 ( 2 2 O O H O O H b O H O H O H O H b H H H m m m M P m a m M P m a γ H γ H O (11) Because mH2O is on the order of 10-1 and mO2 is usually <10-10, it is essential tocarry all calculations with sufficient numerical precision. We used a precision of 20 digits, which ensured that errors on mO2 values were <0.1% when mO2>10-17.
System H-O-S
The gas phase is composed of 6 species (H2O, H2, O2, S2, H2S and SO2) that
are in equilibrium at all times:
(
)(
) ( )
1/2 2 1 2 2 1 − − = fH O fH fO K(
)( ) ( )
1 2 2 / 1 2 2 2 − − = fSO fS fO K(
)(
) ( ) (
)
1 2 2 / 1 2 2 / 1 2 2 3 − − = fH S fO fS fH O K (12)where K1, K2, and K3 are equilibrium constants (Ohomoto and Kerrick, 1977; Robie et
al., 1979). The total weight percents of atomic oxygen (wTO), atomic hydrogen (wTH),
and atomic sulfur (wTS) are given by:
⎟⎟ ⎠ ⎞ ⎜⎜ ⎝ ⎛ + + = 2 2 2 2 2 2 2 2 SO TSO O TO O H O TH O TO M w M w M w M w
⎠ ⎝ H2O H2 H2S ⎟⎟ ⎠ ⎞ ⎜⎜ ⎝ ⎛ + + = 2 2 2 2 2 2 2 SO TSO S H S TH S TS S TS M w M w M w M w (13)
Like the H-O system, the resolution is carried out in two steps. First, wgT, fH2O
and fH2 are set at depth so that the composition of the gas phase and the total amounts
of each element could be determined. Second, each time pressure decreases, mass conservation (1) and (13), chemical equilibrium (12), and solubility laws (5) are used jointly to solve for the seven unknowns (molar fractions mi and the total gas weight
fraction wgT).
Effects of Iron
When there is iron dissolved in the melt, the following redox reaction occurs:
3 2 2 2 1 O Fe O FeO+ = (14)
It is currently not possible to include the redox effects of iron into our thermodynamic model because the activities of FeO and Fe2O3 dissolved into a
rhyolitic melt are not known. It is, however, possible to simulate such effects by using an empirical model that links, at constant temperature, the molar ratio of FeO and Fe2O3 to the oxygen fugacity (Kress and Carmichael, 1991):
( )
T P h T P f m d c T b fO a m m KC KC k k k KC KC KC KC FeO O Fe 2 2 3 2 ln ln ⎟⎟= + + + + + ⎠ ⎞ ⎜⎜ ⎝ ⎛∑
(15)where k is one of (FeO*, Al2O3, CaO, Na2O, and K2O), mk is the total molar fraction
of these species, and aKC, bKC, cKC, dKC k, fKC, hKC are constants given in Kress and
Carmichael (1991). We calculated the redox effect of iron in the H-O-S system by using (15) and keeping track of the total amounts of Fe (wTFe), oxygen in the FeO and
Fe2O3 form (wTO(Fe)), and oxygen in the O2, H2O, and SO2 form (wTO).
Because the relation (14) contains the total molar fraction of several oxides and our mass balance (13) is in weight fraction, conversions between the two units are needed, and the total composition of the melt should be known. Thus, we fixed the total weight fraction of 9 major oxides of a typical rhyolite (in wt%: SiO2=77.44,
Al2O3=12.88, TiO2=0.07, CaO=0.6, Na2O=4.14, K2O=4.76, MgO=0.03, MnO=0.05,
P2O5=0.03). These initial values add up to 100%, and need to be corrected to take in
account the amounts of volatiles and iron. For each run, initial quantities of FeO* (wTFeO*), wgT, fH2O and fH2 are set at depth. Using the same procedure as described in
“H-O-S system”, total amounts of sulphur, hydrogen, and oxygen in the O2, H2O, and
SO2 form can be calculated. The initial amount of oxygen in the FeO and Fe2O3 form
is not known and should be determined using the empirical equation (14). Thus, the initial quantities of the 9 major oxides are normalized so that the 9 oxides, plus the volatiles species (wTO, wTS , wTH ), plus the total iron (wTFeO*) add up to 100%. Then
the total molar fraction of FeO*, Al2O3, CaO, Na2O, and K2O are calculated using:
∑
j Mj
The total amounts of iron and oxygen fixed by the iron can be expressed as:
3 2 2 Fe O FeO Fe m m m = + (17a) 3 2 ) (Fe FeO 3 Fe O O m m m = + (17b)
From (15), we define that
KC m m FeO O Fe2 3 = (18) Combining (17)-(18), we get: KC KC m mOFe Fe 2 1 3 1 ) ( + + = (19) Using Fe FeO TFeO TFe M M w
w = * and the conversion (16) for w
TFe and wTO(Fe) yields
the total amount of oxygen fixed by the iron:
KC KC M w M w Fe TFe O Fe TO 2 1 3 1 ) ( + + = (20)
The mass balance can now be rigorously carried out by adding the 9 oxides, the volatiles species (wTO, wTS, and wTH), the total iron (wTFe) and the oxygen fixed by
the iron (wTO(Fe)). The total molar fractions mk can be updated using (16) and are used
in (15) for the rest of the simulation. Because the system is closed, all the quantities involved in the mass balance, except wTO and wTO(Fe), are considered constant. The
reaction (14) imposes an exchange of oxygen between that locked in the Fe-bearing species and that involved in the H-O-S redox reactions. The sum wTO + wTO(Fe) =
wTO(Total), however, remains constant. Thus, using (20), the total amount of “free”
oxygen wTO can be related to fO2:
KC KC M m M m w w j j j O Fe Total TO TO 2 1 3 1 ) ( + + − =
∑
(21)The numerical resolution of (21) needs to be coupled with that of the H-O-S system. For each pressure step, solving for the redox equilibrium of the volatile species (equations (1), (5), (12) and (13)) yields an fO2 . This fugacity is used in (21)
to obtain a new amount of “free” oxygen. The redox equilibrium of the volatile species is solved again with the updated wTO, and the process is conducted iteratively
until desired precision (<10-5 % on wTO) is reached. An under-relaxation factor of 0.1
is applied to the updated wTO to ensure convergence in 20 to 30 iterations.
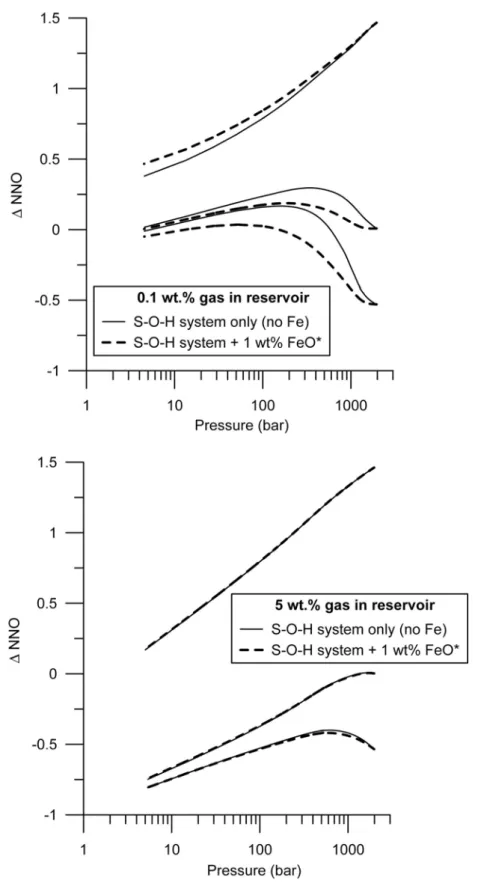
Runs with 1 wt% of total iron under typical storage conditions of arc rhyolites (fO2 between NNO-0.5 and NNO+1.5) show that the buffering capacity of iron is
limited to less than 0.2 unit log compared to the S-O-H system when little gas is present in the reservoir, and becomes insignificant when more gas is present in the reservoir (Fig. SI-1). Under such storage conditions, iron does not change the redox
when the reservoir hosts a large amount of gas.
Figure SI-1: Effect of dissolved iron on the redox evolution of an ascending rhyolite. Stippled lines are runs with 1 wt.% total iron (FeO*) and solid lines are runs with no iron. Upper graph runs start with 0.1 wt.% gas at depth and lower graph runs start with 5 wt% gas at depth.
momentum conservation, the pressure evolution with depth (dP/dz) is given by: 2 2 2 8 0.0025 v r r v g dz d v dz dP ρ ρ µ ρ − − − = (22)
where v is magma velocity, ρ is magma density, r is conduit radius, and g is gravity. The viscosity µ is calculated with the relationship by Hess and Dingwell (1996) for the melt and correcting for the effect of bubbles using the relationship by Dobran (1992). We note that using instead the relationship by Jaupart and Allègre (1991) for the effect of bubbles on viscosity did not change the trends caused by variations in volatile chemistry. Magma bulk density is:
l gT g gT w w ρ ρ ρ − + = 1 1 (23) where ρg is gas density from perfect gas law, and ρl is melt density. Replacing the
derivative of (23) into (22) and rearranging gives:
1 2 2 1 0025 . 0 8 1 − ⎥ ⎦ ⎤ ⎢ ⎣ ⎡ − ⎥ ⎥ ⎦ ⎤ ⎢ ⎢ ⎣ ⎡ − − − ⎟ ⎟ ⎠ ⎞ ⎜ ⎜ ⎝ ⎛ ⎟⎟ ⎠ ⎞ ⎜⎜ ⎝ ⎛ − − = P Aw v r r v g dz dw dz dM M w A dz dP gT gT l g gT ρ µ ρ ρ ρ (24) with
(
)
2 2 1 − ⎟⎟ ⎠ ⎞ ⎜⎜ ⎝ ⎛ − + = l g gT gT g w w v A ρ ρ ρwhere M is the average molar mass of the gas phase:
∑
= = n i i iM x M 1 (25) Above fragmentation (gas volume fraction >0.75), the viscosity is that of adusty gas (Dobran, 1992), and degassing continues.
Equation (24) is solved using a fourth-order Runge-Kutta algorithm with adjustable distance step. At each pressure step, the gas composition is calculated for the system considered (H-O or H-O-S). The terms dM/dz and dwgT/dz in (24) are
evaluated implicitly, which can be justified by the fact that they are always several orders of magnitude smaller than inertia and viscous terms. Boundary condition is either atmospheric pressure at the vent, or initial velocity at depth. In the former case, a run starts with an initial guess for the velocity at depth, and the pressure is solved for until vent is reached. Initial velocity is then changed until upper boundary condition is satisfied. Because degassing occurs in equilibrium, changes in chemistry as a function of pressure are identical for the two cases.
References
Burgisser, A., and Gardner, J.E. (2005) Experimental constraints on degassing and permeability in volcanic conduit flow, Bulletin of Volcanology, v.67, p. 42-56.
Clemente, B., Scaillet, B. & Pichavant, M. The solubility of sulphur in hydrous rhyolitic melts. J. Petrol. 45, 2171-2196 (2004).
Geothermal Research, v.49, p. 285-311.
Hess, K-U., and Dingwell, D.B. (1996) Viscosities of hydrous leucogranitic melts: A non-Arrhenian model, American Mineralogist, v.81, p. 1297-1300.
Jaupart C, and Allègre C (1991) Gas content, eruption rate and instabilities of eruption regime in silicic volcanoes, Earth Planet Sci Lett 102:413-429
Kress, V.C., and Carmichael, I.S.E. (1991) The compressibility of silicate liquids containing Fe2O3 and the effect of composition, temperature, oxygen fugacity and pressure on their redox states, Contributions to Mineralogy and Petrology, v.108, p. 82-92.
Ohomoto, H., and Kerrick, D.M. (1977) Devolatilisation equilibria in graphitic systems, American Journal of Science, v.277, p. 1013-1044.
Robie, R.A., Hemingway, B.S., and Fisher, J.R. (1979) Thermodynamic properties of minerals and related substances at 298.15 K and 1 bar (105 Pa) pressure and at higher temperatures, US Geological Survey Bulletin 1452.
Shi, P.F. & Saxena, F.K. (1992) Thermodynamic modeling of the C-H-O-S fluid system. Amer. Mineral. 77, 1038-1049.