HAL Id: hal-03210362
https://hal.archives-ouvertes.fr/hal-03210362
Submitted on 28 Apr 2021
HAL is a multi-disciplinary open access
archive for the deposit and dissemination of
sci-entific research documents, whether they are
pub-lished or not. The documents may come from
teaching and research institutions in France or
abroad, or from public or private research centers.
L’archive ouverte pluridisciplinaire HAL, est
destinée au dépôt et à la diffusion de documents
scientifiques de niveau recherche, publiés ou non,
émanant des établissements d’enseignement et de
recherche français ou étrangers, des laboratoires
publics ou privés.
Broadband Multi-wavelength Properties of M87 during
the 2017 Event Horizon Telescope Campaign
J.C. Algaba, J. Anczarski, K. Asada, M. Baloković, S. Chandra, Y.-Z. Cui,
A.D. Falcone, C. Goddi, K. Hada, D. Haggard, et al.
To cite this version:
J.C. Algaba, J. Anczarski, K. Asada, M. Baloković, S. Chandra, et al.. Broadband Multi-wavelength
Properties of M87 during the 2017 Event Horizon Telescope Campaign. Astrophys.J.Lett., 2021, 911
(1), pp.L11. �10.3847/2041-8213/abef71�. �hal-03210362�
Broadband Multi-wavelength Properties of M87 during the
2017 Event Horizon Telescope Campaign
Abstract
In 2017, the Event Horizon Telescope(EHT) Collaboration succeeded in capturing the first direct image of the center of the M87 galaxy. The asymmetric ring morphology and size are consistent with theoretical expectations for a weakly accreting supermassive black hole of mass ∼6.5 × 10⁹Me. The EHTC also partnered with several international facilities in space and on the ground, to arrange an extensive, quasi-simultaneous multi-wavelength campaign. This Letter presents the results and analysis of this campaign, as well as the multi-wavelength data as a legacy data repository. We captured M87 in a historically low state, and the coreflux dominates over HST-1 at high energies, making it possible to combine core flux constraints with the more spatially precise very long baseline interferometry data. We present the most complete simultaneous multi-wavelength spectrum of the active nucleus to date, and discuss the complexity and caveats of combining data from different spatial scales into one broadband spectrum. We apply two heuristic, isotropic leptonic single-zone models to provide insight into the basic source properties, but conclude that a structured jet is necessary to explain M87’s spectrum. We can exclude that the simultaneousγ-ray emission is produced via inverse Compton emission in the same region producing the
© 2021. The Author(s). Published by the American Astronomical Society.
J. C. Algaba1 , J. Anczarski2 , K. Asada3, M. Baloković4,5 , S. Chandra6 , Y.-Z. Cui7,8 , A. D. Falcone9 , M. Giroletti10 , C. Goddi11,12 , K. Hada7,8 , D. Haggard13,14 , S. Jorstad15,16 , A. Kaur9 , T. Kawashima17 , G. Keating18 , J.-Y. Kim19,20 , M. Kino21,22 , S. Komossa20 , E. V. Kravchenko10,23,24 , T. P. Krichbaum20 , S.-S. Lee19 , R.-S. Lu (路如森)20,25,26
, M. Lucchini27, S. Markoff27,28 , J. Neilsen2 , M. A. Nowak29 , J. Park30,31,244 , G. Principe10,32,33 , V. Ramakrishnan34 , M. T. Reynolds35 , M. Sasada21,36 , S. S. Savchenko37,38 , K. E. Williamson15
(The Event Horizon Telescope Collaboration) (The Fermi Large Area Telescope Collaboration)
(H.E.S.S. Collaboration) (MAGIC Collaboration) (VERITAS Collaboration)
(EAVN Collaboration)
(See the end matter for the full list of authors including corresponding authors for the partner facilities.)
Received 2020 December 25; revised 2021 March 14; accepted 2021 March 16; published 2021 April 14
239
NASA Hubble Fellowship Program, Einstein Fellow.
240
Now at University of Innsbruck.
241
Also at Port d’Informació Científica (PIC) E-08193 Bellaterra (Barcelona), Spain.
242
Also at Dipartimento di Fisica, Università di Trieste, I-34127 Trieste, Italy.
243
Also at INAF Trieste and Dept. of Physics and Astronomy, University of Bologna.
244
EACOA Fellow.
245
UKRI Stephen Hawking Fellow.
246
For questions concerning EHT results contact ehtcollaboration@ gmail.com.
*H.E.S.S. corresponding author. For questions concerning H.E.S.S. results [email protected].
†MAGIC corresponding author. For questions concerning MAGIC results
‡VERITAS corresponding author. For questions concerning VERITAS results
[email protected],[email protected].
Original content from this work may be used under the terms of theCreative Commons Attribution 3.0 licence. Any further distribution of this work must maintain attribution to the author(s) and the title of the work, journal citation and DOI.
EHT mm-band emission, and further conclude that theγ-rays can only be produced in the inner jets (inward of HST-1) if there are strongly particle-dominated regions. Direct synchrotron emission from accelerated protons and secondaries cannot yet be excluded.
Key words: Active galactic nuclei – Radio cores – Low-luminosity active galactic nuclei – High energy astrophysics– Astrophysical black holes – Accretion
1. Introduction
M87 is the most prominent elliptical galaxy within the Virgo Cluster, located just 16.8± 0.8 Mpc away (Blakeslee et al.2009; Bird et al. 2010; Cantiello et al. 2018, and see also EHT Collaboration et al. 2019f). As one of our closest active galactic
nuclei (AGNs), M87 also harbors the first example of an extragalactic jet to have been noticed by astronomers(Curtis1918),
well before these jets were understood to be a likely signature of black hole accretion. By now this famous one-sided jet has been well-studied in almost every wave band from radio(down to sub-parsec scales; e.g., Reid et al.1989; Junor et al.1999; Hada et al.
2011; Mertens et al.2016; Kim et al.2018b; Walker et al.2018),
optical(e.g., Biretta et al.1999; Perlman et al.2011), X-ray (e.g.,
Marshall et al.2002; Snios et al.2019), and γ-rays (e.g., Abdo et al. 2009a; Abramowski et al. 2012; MAGIC Collaboration et al.
2020). Extending over 60 kpc in length, the jet shows a system of
multiple knot-like features, including an active feature HST-1 at a projected distance of∼70 pc from the core, potentially marking the end of the black hole’s sphere of gravitational influence (Asada & Nakamura 2012). In contrast, the weakly accreting supermassive
black hole(SMBH) in the center of our own Milky Way galaxy, Sgr A*, does not show obvious signs of extended jets, although theory predicts that such outflows should be formed (e.g., Dibi et al.2012; Mościbrodzka et al.2014; Davelaar et al.2018). The
conditions under which such jets are launched is one of the enduring questions in astrophysics today (e.g., Blandford & Znajek1977; Blandford & Payne1982; Sikora & Begelman2013).
In 2019 April, the Event Horizon Telescope(EHT) Collabora-tion presented thefirst direct image of an SMBH “shadow” in the center of M87 (EHT Collaboration et al. 2019a, 2019b,
2019c, 2019d, 2019e, 2019f). The key result in these papers
was the detection of an asymmetric ring(crescent) of light around a darker circle, due to the presence of an event horizon, along with detailed explanations of all the ingredients necessary to obtain, analyze, and interpret this rich data set. The ring itself stems from a convolution of the light produced near the last unstable photon orbit, as it travels through the geometry of the production region with radiative transfer in the surrounding plasma, and further experiences bending and redshifting due to the effects of general relativity (GR). Photons that orbit, sometimes multiple times before escaping, trace out a sharp feature revealing the shape of the spacetime metric, the so-called“photon ring”. From the size of the measured, blurry ring and three different modeling approaches (see EHT Collaboration et al. 2019e), the EHT Collaboration
(EHTC) calibrated for these multiple effects, to derive a mass for M87’s SMBH of (6.5 ± 0.7) × 109Me.
One of the primary contributions to the∼10% systematic error on this mass is due to uncertainties in the underlying accretion properties. As detailed in EHT Collaboration et al.(2019d) and Porth
et al.(2019), the EHTC ran over 45 high-resolution simulations over
a range of possible physical parameters in, e.g., spin, magneticfield configuration, and electron thermodynamics, using several different
GR magnetohydrodynamic(GRMHD) codes. These outputs were then coupled to GR ray-tracing codes, to generate∼60,000 images captured at different times during the simulation runs, which were verified in Gold et al. (2020). While the photon ring remains
relatively robust to changes in spin, in part because of the small viewing angle(see, e.g., Johannsen & Psaltis2010), the spreading of
the light around this feature strongly depends on the plasma properties near the event horizon, introducing significant degeneracy. For instance, a smaller black hole produces a smaller photon ring, but in some emission models there is extended surrounding emission leading to a largerfinal blurry ring. Similarly, a larger black hole with significant emission produced along the line of sight will appear to have emission within the photon ring, and when convolved produces the appearance of a smaller blurry ring. The error in calibrating from a given image to a unique black hole mass is therefore a combination of image reconstruction limits, as well as our current level of uncertainty about the plasma properties and emission geometry very close to the black hole.
However, it is important to note that even in these first analyses, several of the models could already be ruled out using complementary information from observations with facilities at other wavelengths. For instance, the estimated minimum power in the jets, Pjet 10
42
erg s−1, from prior and recent multi-wavelength studies (e.g., Reynolds et al. 1996; Stawarz et al.
2006; de Gasperin et al.2012; Prieto et al. 2016), was already
enough to rule out about half of the initial pool of models, including all models with zero spin. Furthermore, the X-ray fluxes from quasi-simultaneous observations with the Chandra X-ray Observatory and NuSTAR provided another benchmark that disfavored several models based on preliminary estimates of X-ray emission from the simulations. However, detailedfitting of these and other precision data sets were beyond the focus of thefirst round of papers and GRMHD model sophistication.
The current cutting edge in modeling accreting black holes, whether via GRMHD simulations or semi-analytical methods, focuses on introducing more physically self-consistent, reliable treatments of the radiating particles(electrons or electron-positron pairs). In particular, key questions remain about how the bulk plasma properties dictate the efficiency of heating, how many thermal particles are accelerated into a nonthermal population, and the dependence of nonthermal properties such as spectral index on plasma properties such as turbulence, magnetization, etc. (see, e.g., treatments in Howes2010; Ressler et al.2015; Mościbrodzka et al.2016; Ball et al.2018; Anantua et al.2020).
To test the newest generation of models, it is important to have extensive, quasi-simultaneous or at least contemporaneous multi-wavelength monitoring of several AGNs, providing both spectral and imaging data (and ideally polarization where available) over a wide range of physical scales. These types of campaigns have been limited by the difficulty in obtaining time on multiple facilities and by scheduling challenges, so often data are combined from different epochs. However, the variability
timescales for even SMBHs such as M87’s are short enough (days to months) that combining data sets from different periods can skew modeling results for sensitive quantities such as radiating particle properties.
This Letter intends to be thefirst of a series, presenting the substantive multi-wavelength campaigns carried out by the EHT Multi-Wavelength Science Working Group(MWL WG), including EHTC members and partner facilities, for both our primary sources M87 and Sgr A*, as well as many other targets and calibrators such as 3C 279, 3C 273, OJ 287, Cen A, NGC 1052, NRAO 530, and J1924−2914. These legacy papers are meant to be companion papers to the EHT publications, and will be used for the detailed modeling efforts to come, both from the EHTC Theory and Simulations WG as well as from other groups. They serve as a resource for the entire community, to enable the best possible modeling outcomes and a benchmark for theory. Here we present the results from the 2017 EHT campaign on M87, combining very long baseline interferometry (VLBI) imaging and spectral index maps at longer wavelengths, with spectral data from sub-millimeter (submm) through TeV γ-rays (covering more than 17 decades in frequency).
In Section 2 we describe these observations, including images(a compilation of MWL images in one panel is shown in a later section), spectral energy distributions (SEDs) and, where relevant, lightcurves and comparisons to prior observations. In Section3we present a compiled SED together with a table of fluxes. We also fit this SED with a few phenomenological models and discuss the consequences for the emission geometry and high-energy properties. In Section4we give our conclusions. All datafiles and products are available for download, as described in Section 3.2.
2. Observations and Data Reduction
In Figure1we give a schematic overview of the 2017 MWL campaign coverage on M87. In the following subsections we
provide detailed descriptions of the observations, data proces-sing procedures, and band-specific analyses. To aid readability, all tabulated data are collected in AppendixA.
2.1. Radio Data
In this subsection we describe the observations and data reduction of radio/mm data obtained with various VLBI facilities and connected interferometers. Especially regarding VLBI data, here we introduce the term“radio core” to represent the innermost part of the radio jet. A radio core in a VLBI jet
Figure 1.Instrument coverage summary of the 2017 M87 MWL campaign, covering MJD range 57833–57893. (Made with the MWLGen software by J. Farah.)
Figure 2.Radio lightcurves of the M87 core in 2017 at multiple frequencies. The top and bottom panels are for connected interferometers and VLBI, respectively. The corresponding beam sizes are indicated in TableA1. KVN data at 22 and 43 GHz are not shown here since KVN captures the data from the shortest baselines of EAVN.
image is conventionally defined as the most compact (often unresolved or partially resolved) feature seen at the apparent base of the radio jet in a given map (e.g., Lobanov 1998; Marscher 2008). For this reason, different angular resolutions
by different VLBI instruments/frequencies, together with the frequency-dependent synchrotron optical depth (Marcaide & Shapiro1984; Lobanov1998), can make the identification of a
radio core not exactly the same for each observation. See also Section 3.2for related discussions.
2.1.1. EVN 1.7 GHz
M87 was observed with the European VLBI Network(EVN) at 1.7 GHz on 2017 May 9. The observations were made as part of a long-term EVN monitoring program of activity in HST-1, located at a projected distance of ∼70 pc from the core (Cheung et al. 2007; Chang et al. 2010; Giroletti et al. 2012; Hada et al.2015). A total of eight stations joined a 10 hr long
session with baselines ranging from 600 km to 10 200 km, yielding a maximum angular resolution of∼3 mas at 1.7 GHz. The data were recorded at 1 Gbps with dual-polarization(a total
bandwidth of 256 MHz, 16 MHz× 8 subbands for each
polarization), and the correlation was performed at the Joint Institute for VLBI ERIC(JIVE). Automated data flagging and initial amplitude and phase calibration were also carried out at JIVE using dedicated pipeline scripts. This step was followed by frequency averaging within each spectral band(IF) and in time to 8 s. The final image was produced using the Difmap software(Shepherd1997) after several iterations of phase and
amplitude self-calibration (see Giroletti et al. 2012, for more detail). Here we provide the peak flux of the radio core (see Figure2and TableA1) and a large-scale jet image (presented
in Section 3), while a dedicated analysis on the HST-1
kinematics will be presented in a separate paper.
2.1.2. HSA 8, 15, and 24 GHz
M87 was observed with the High Sensitivity Array(HSA) at 8.4, 15, and 24 GHz on 2017 May 15, 16 and 20, respectively, which are roughly a month after the EHT-2017 observations. Each session was made with a 12 hr long continuous track and the phased Very Large Array and Effelsberg 100 m antenna participated in the observations along with the 10 stations of the NRAO Very Long Baseline Array (VLBA). The data were recorded at 2 Gbps with dual-polarization (a total bandwidth of 512 MHz, 32 MHz× 8 subbands for each polarization), and the correlation was done with the VLBA correlator in Socorro(Deller et al.2011). The initial data calibration was performed using the
NRAO Astronomical Image Processing System (AIPS; Grei-sen2003) based on the standard VLBI data reduction procedures
(Crossley et al.2012; Walker2014). Similar to other VLBI data,
images were created using the Difmap software with iterative phase/amplitude self-calibration.
A detailed study of the parsec-scale structure of the M87 jet from this HSA program will be discussed in a separate paper. Here we provide a core peakflux and VLBI-scale total flux at each frequency (Table A1 in Appendix A). We adopt 10%
errors influx estimate, which is typical for HSA.
2.1.3. VERA 22 GHz
The core of M87 was frequently monitored over the entire year of 2017 at 22 GHz with the VLBI Exploration of Radio Astrometry(VERA; Kobayashi et al.2003), as part of a regular
monitoring program of a sample of γ-ray bright AGNs (Nagai et al. 2013). A total of 17 epochs were obtained in 2017 (see
Figure2and TableA1in AppendixA). During each session, M87
was observed for 10–30 minutes with an allocated bandwidth of 16 MHz, sufficient to detect the bright core and create its light curves. All the data were analyzed in the standard VERA data reduction procedures(see Nagai et al.2013; Hada et al.2014, for more details). Note that VERA can recover only part of the extended jet emission due to the lack of short baselines, so the total fluxes of VERA listed in Table A1 in Appendix A
significantly underestimate the actual total jet fluxes.
2.1.4. EAVN/KaVA 22 and 43 GHz
Since 2013 a joint network of the Korean VLBI Network (KVN) and VERA (KaVA; Niinuma et al.2014) has regularly
been monitoring M87 to trace the structural evolution of the pc-scale jet(Hada et al. 2017; Park et al. 2019). From 2017, the
network was expanded to the East Asian VLBI Network (EAVN; Wajima et al.2016; Asada et al.2017; An et al.2018)
by adding more stations from East Asia, enhancing the array sensitivity and angular resolution. Between 2017 March and May, EAVN densely monitored M87 for a total of 14 epochs (five at 22 GHz, nine at 43 GHz; see Figure2and TableA1in Appendix A). The default array configurations were KaVA
+Tianma+Nanshan+Hitachi at 22 GHz and KaVA+Tianma at 43 GHz, respectively, while occasionally a few more stations (Sejong, Kashima, and Nobeyama) additionally joined if they were available. In addition, we also had four more sessions with KaVA alone(2+2 at 22/43 GHz) in 2017 January–February.
Each of the KaVA/EAVN sessions was made in a 5–7 hr continuous run at a data recording rate of 1 Gbps (2-bit sampling, a total bandwidth of 256 MHz was divided into 32 MHz× 8 IFs). All the data were correlated at the Daejeon hardware correlator installed at KASI. All the EAVN data were calibrated in the standard manner of VLBI data reduction procedures. We used the AIPS software package for the initial calibration of visibility amplitude, bandpass, and phase calibration. The imaging/CLEAN (Högbom 1974) and
self-calibration were performed with the Difmap software. In Section3we present one of the 22 GHz EAVN images(taken in 2017 March 18) where the KaVA, Tianma—65 m, Nanshan —26 m, and Hitachi—32 m radio telescopes participated.
2.1.5. KVN 22, 43, 86, and 129 GHz
The KVN regularly observes M87 at frequencies of 22, 43, 86, and 129 GHz simultaneously via the interferometric Monitoring ofγ-ray Bright Active galactic nuclei (iMOGABA) program, starting in 2012 December and lasting until 2020 January. The total bandwidth of the observations at each frequency band is 64 MHz and the typical beam sizes of the observations are 6.1× 3.1 mas at 22 GHz, 2.8 × 1.6 mas at 43 GHz, 1.5× 0.8 mas at 86 GHz, and 1.1 × 0.5 mas at 129 GHz. Details of the scheduling, observations, data reduction including frequency phase transfer technique, analysis(i.e., imaging and model-fitting), and early results for M87 are shown in Lee et al. (2016) and Kim et al. (2018a).
Despite the limited coverage of baselines and capability of the array to image the extended jet structure in M87, the flux density of the compact core can be rather reliably measured (Kim et al.2018a). We extract the core flux densities at the four
between 2017 March and December at seven epochs. While typicalflux density uncertainties at 22–86 GHz are of order of ∼10%, residual phase rotations and larger thermal noise at 129 GHz often lead to uncertainties of∼30%. Accordingly, we adopt these uncertainties for all KVN observing epochs in this Letter.
2.1.6. VLBA 24 and 43 GHz
M87 was observed with the VLBA at central frequencies of 24 and 43 GHz on 2017 May 5. These observations were carried out in the framework of the long-term monitoring program toward M87, which was initiated in 2006 (Walker et al. 2018) and lasted until 2020. For the 2017 session, the
total on-source time amounts to about 1.7 hr at 24 GHz and 6 hr at 43 GHz. The sources OJ 287 and 3C 279 were observed to use as fringe finders and bandpass calibrators. In each band, eight 32 MHz wide frequency channels were recorded in both right and left circular polarization at a rate of 2 Gbps, and correlated with the VLBA software correlator in Socorro. The initial data reduction was conducted within AIPS following the standard calibration procedures for VLBI data. Deconvolution and self-calibration algorithms, implemented in Difmap, were used for phase and amplitude calibration and for constructing the final images. Amplitude calibration accuracy of 10% is adopted for both frequencies.
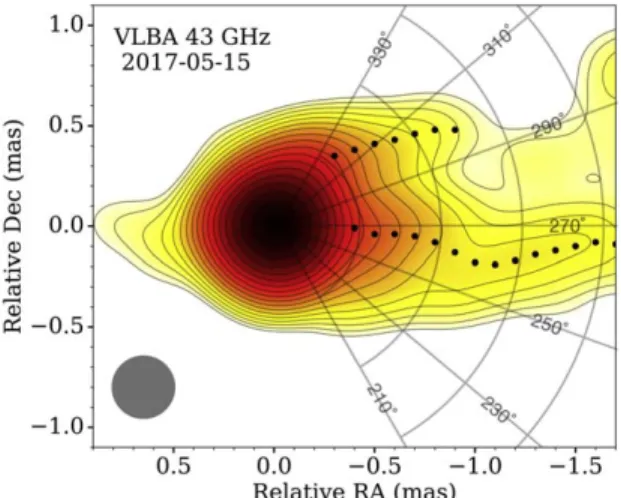
The resulting total intensity 43 GHz image of M87 is presented in Section 3, with the details given in TableA1 in
Appendix A. The synthesized beam size amounts to
0.76× 0.40 mas at the position angle (PA) of the major axis of −8° at 24 GHz, and 0.41 × 0.23 mas at PA = 0° at 43 GHz. We note that these observations were used for the study of a linear polarization structure toward the M87 core, details of which can be found in a separate paper(Kravchenko et al.2020).
2.1.7. GMVA 86 GHz
M87 was observed by the Global Millimeter-VLBI-Array (GMVA; Boccardi et al.2017) on 2017 March 30 (project code
MA 009). In total, 14 stations participated in the observations: VLBA(eight stations; without HN and SC), 100 m Green Bank Telescope, IRAM 30 m, Effelsberg 100 m, Yebes, Onsala, and Metsahovi. The observation was performed in full-track mode for a total of 14 hr. Nearby bright sources 3C 279 and 3C 273
were observed as calibrator targets. The raw data were correlated by using the DiFX correlator (Deller et al.
2011).247 Further post-processing was performed using the AIPSsoftware package, following typical VLBI data reduction procedures (see, e.g., Martí-Vidal et al. 2012). After the
calibration, the data were frequency-averaged across the whole subchannels and IFs, and exported outside AIPS for imaging with the Difmap software. Within Difmap, the data were further time-averaged for 10 s, followed byflagging of outlying data points(e.g., scans with too low amplitudes due to pointing errors). Afterward, CLEAN and phase self-calibrations were iteratively performed near the peak of the intensity, but avoiding CLEANing of the faint counterjet side at the early stage. When no more significant flux remained for further CLEAN steps, afirst amplitude self-calibration was performed using the entire time coverage as the solution interval, in order to find average station gain amplitude corrections. A similar procedure was repeated with progressively shorter self-calibration solution intervals, and thefinal image was exported outside Difmap when the shortest possible solution interval was reached and no more significant emission was visible in the dirty map compared to the off-source rms levels.
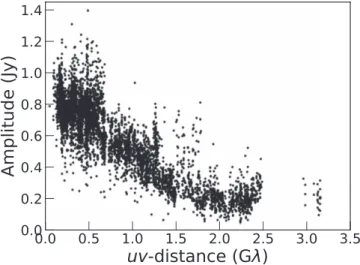
Calibrated visibilities are shown in Figure3, and the CLEAN image is given in Section3. We note that thefinal image has an rms noise level of∼0.5 mJy beam−1. This noise level is a factor of a few higher than other 86 GHz images of M87 from previous observations, which were made with similar array configuration as the 2017 session (see Hada et al. 2016; Kim et al.2018b).
Therefore, we refer to this image as tentative, and it only reveals the compact core and faint base of the jet, mainly due to poor weather conditions during the observations. We consider an error budget of 30% for theflux estimate. The peak flux density on the resultant image amounts to ∼0.52 Jy beam−1 for the synthesized beam of 0.243× 0.066 mas at PA = −9°.3 (see TableA1in AppendixAfor other details). We note that the peak flux density as well as the flux, integrated over the core region, are comparable to their historical values(Hada et al.2016; Kim et al.2018b), except for the 2009 May epoch, when the GMVA
observations revealed about two times brighter core region in both intensity and integratedflux (Kim et al.2018b).
2.1.8. Atacama Large Millimeter/submillimeter Array (ALMA) 221 GHz
The observations at Band 6 with phased-ALMA(Matthews et al.2018) were conducted as part of the 2017 EHT campaign
(Goddi et al. 2019). The VLBI observations were carried out
while the array was in its most compact configurations (with longest baselines <0.5 km). The spectral setup at Band 6 includes four spectral windows(SPWs) of 1875 MHz, two in the lower and two in the upper sideband, correlated with 240 channels per SPW (corresponding to a spectral resolution of 7.8125 MHz). The central frequencies at this band are 213.1, 215.1, 227.1, and 229.1 GHz. Details about the ALMA observations and a full description of the data processing and calibration can be found in Goddi et al.(2019).
Imaging was performed with the Common Astronomy Software Applications(CASA; McMullin et al.2007) package
using the task tclean. Only phased antennas were used to produce the final images (with baselines <360 m), yielding
Figure 3. Visibility amplitude vs. uv-distance plot of GMVA data on 2017 March 30. In this display the visibilities are binned in 30 s intervals for clarity.
247
We use the correlator at the Max-Planck-Institut für Radioastronomie (MPIfR) in Bonn, Germany.
synthesized beam sizes in the range 1 0–2 4 (depending on the observing band and date). We produced 256 × 256 pixel maps, with a cell size of 0 2 yielding a field of view of 51″ × 51″.
The main observational and imaging parameters are summarized in Table A1 in Appendix A. For each data set and corresponding image, the table reports the flux-density values of the central compact core and the overall flux, including the extended jet. In order to isolate the core emission from the jet, we compute the sum of the central nine pixels of
the model (CLEAN component) map (an area of 3 × 3
pixels);248 the contribution from the jet is accounted for by also summing the clean components along the jet. The extended emission accounts for less than 20% of the total emission at 1.3 mm. The large-scale jet image is presented in Section 3. Details about the imaging and flux extraction methods can be found in Goddi et al.(2021).
2.1.9. Submillimeter Array(SMA) 230 GHz
The long term 1.3 mm band (230 GHz) flux density light-curve for M87 shown in Figure 2 was obtained at the SMA near the summit of Maunakea(Hawaii). M87 is included in an ongoing monitoring program at the SMA to determine flux densities for compact extragalactic radio sources that can be used as calibrators at mm wavelengths (Gurwell et al. 2007).
Available potential calibrators are occasionally observed for 3–5 minutes, and the measured source signal strength calibrated against known standards, typically solar system objects (Titan, Uranus, Neptune, or Callisto). Data from this program are updated regularly and are available at the SMA Observer Center website (SMAOC249). Data were primarily obtained in a compact configuration (with baselines extending from 10 to 75 m) though a small number were obtained at longer baselines up to 210 m. The effective spatial resolution, therefore, was generally around 3″. The flux density was obtained by vector averaging of the calibrated visibilities from each observation.
Observations of M87 were additionally conducted as part of the 2017 EHT campaign, with the SMA running in phased-array mode, operating at 230 GHz. All observations were conducted while the array was in compact configuration, with the interferometer operating in dual-polarization mode. The SMA correlator produces four separate but contiguous 2 GHz spectral windows per sideband, resulting in frequency coverage of 208–216 and 224–232 GHz. Data were both bandpass and amplitude calibrated using 3C 279, with flux calibration performed using either Callisto, Ganymede, or Titan. Due in part to poor phase stability at the time of observations, phase calibration is done through self-calibration of the M87 data itself, assuming a point-source model. Data are then imaged and deconvolved using the CLEAN algorithm.
A summary of the measurements made from these data are shown in Table A1in AppendixA, along with measurements taken within a month of these observations from the SMAOC data mentioned above. The reported core flux for M87 is the flux measured in the center of the cleaned map. Combined images of all data show the same jet-like structure seen in the
ALMA image in Figure13, although recovery of the flux for individual days through imaging is limited by a lack of(u, v)-coverage within individual tracks. Therefore, we estimate the totalflux by measuring the mean flux density of all baselines within a (u, v)-angle of 110° ± 5°, as these baselines are not expected to resolve the jet and central region.
2.2. Optical and Ultraviolet(UV) Data
We performed optical and UV observations of M87 with the Neil Gehrels Swift Observatory during the EHT campaign, and have also analyzed contemporaneous archival observations from the Hubble Space Telescope(HST).
2.2.1. UV/Optical Telescope (UVOT) Observations
The Neil Gehrels Swift Observatory(Gehrels et al.2004) is
equipped with UVOT (Roming et al. 2005), as well as with
X-ray imaging optics(see Section 2.3.4below). We retrieved UVOT optical and UV data from the NASA High-Energy
Astrophysics Archive Research Center (HEASARC) and
reduced them with v6.26.1 of the HEASOFT software250and CALDB v20170922. The observations were performed from 2017 March 22 to April 20 in six bands, v(5458 Å), b(4392 Å), u(3465 Å), uvw1(2600 Å), uvm2(2246 Å), and uvw2(1928 Å), with 24 measurements in each band, and effective filter wavelengths as given in Poole et al.(2008). The reduction of
the data followed the standard prescriptions of the instrument team at the University of Leicester.251We checked the UVOT observations for small-scale sensitivity issues and found that none of our observations are affected by bad charge-coupled device (CCD) pixels. In 2020 November the Swift team released new UVOT calibrationfiles, along with coefficients of the flux density correction as a function of time, for data reduced with the previous version of CALDB. For our observations the coefficients of the flux density correction (multiplicative factors) are very close to 1: 0.974 ± 0.001 (for the optical filters), 0.947 ± 0.001 (uvw1), 0.964 ± 0.001 (uvm2), and 0.958 ± 0.001 (uvw2). We have used these coefficients to correct our measurements for the UVOT sensitivity change.252
We performed aperture photometry for each individual observation using the tool UVOTSOURCE, with a circular aperture of a radius of 5″ centered on the sky coordinates of M87 and detection significance σ 5. This aperture includes the M87 core, the knot HST-1, and some emission from the extended jet, which we cannot separate due to the size of the UVOT point-spread function (PSF; ∼2 5). Since there is contamination from the bright host galaxy surrounding the core of M87, we measure the background level in three circular regions, each of 30″ radius in a source-free area located outside the host galaxy radius(see below). We used the count-rate to magnitude andflux density conversion provided by Breeveld et al. (2011) and retained only those measurements with
magnitude errors ofσmag< 0.2. This calibration of the UVOT broadband filters (Breeveld et al. 2011) includes additional
calibration sources with a wider range of colors with respect to the one reported by Poole et al.(2008).
248
An alternative method is provided by taking the integratedflux within the synthesized full width at half maximum(FWHM) size centered at the phase-center in each cleaned image, which provides consistent values with those obtained from the model cleaning components.
249
http://sma1.sma.hawaii.edu/callist/callist.html
250
NASA High-Energy Astrophysics Archive Research Center HEASOFT packagehttps://heasarc.gsfc.nasa.gov/docs/software/heasoft/.
251https://www.swift.ac.uk/analysis/uvot/ 252
To estimate the contributions of the host galaxy to the derivedflux densities, we modeled the UVOT images. First we combined individual images using the tool UVOTIMSUM to produce a stacked image in each filter. Ordinarily, this would have allowed us to obtain the best signal-to-noise ratio (S/N) for modeling. However, since the source was not centered in the different images at the same CCD position, the area of intersection between the images was too small. Hence, even in the outer regions theflux from the galaxy was still significant. Therefore, we made a set of models using individual images and then found a mean model for each band after a mask of background objects was used to exclude all objects(except for M87 itself). Since a unified mask was used, the images have the same pixels included and excluded from the analysis, so no bias is introduced.
After this procedure, the decomposition process was run for each image using a model consisting of three components: the core region, jet, and host galaxy. The core region includes the core and knot HST-1, which was modeled by a point source, while the jet wasfitted by a highly elliptical Gaussian. The galaxy was modeled by a Sérsic function: I R( ) =Ieexp(-bn[(R Re)1 n -1]), where n is the Sérsic parameter, bn= 2n − 1/3, Re is the half-light radius, and Ieis the intensity at Re. All three structural features can be seen in the combined image in the uvw1 band presented in Figure13. A point source model for the core+ HST-1 region was convolved with the PSF determined for each filter using several isolated non-saturated stars in a number of images. The parameters of each PSF were averaged over stars and images. Before the decomposition, the images were normalized to a one-second exposure to make them uniform. The program imfit (Erwin2015)
was employed to perform decomposition for each image. Each model parameter for a givenfilter corresponds to the median value averaged over all images using the best-fit image parameters (according to χ2), with >2σ outliers removed (number of outliers for eachfilter 4).
TableA2in AppendixAlists the derived median values of the Sérsic model n-parameter and its uncertainty for different bands. The uncertainty corresponds to a scatter of models among the individual images. The derived values of the Sérsic n-parameter show a dependence on wavelength that is caused by a difference in the stellar population and, probably, the scattered light from the core, which is blue, leading to higher n-values for blue filters. Note that there is significant scatter among values of the n-parameter reported in the literature, from n= 2.4 (Vika et al.2012) to n = 3.0 (D’Onofrio2001), n = 6.1
(Ferrarese et al.2006), n = 6.9 (Graham & Driver2007), and
n= 11.8 (Kormendy et al.2009).
TableA2in AppendixAalso gives the derived values of the effective radius of the galaxy in different bands, Re, ellipticity, ò, and PA, Φ, of the major axis of the galaxy calculated counter clockwise from north. Figure 4 shows an example of a comparison between the mean observed surface brightness profile along the semimajor axis of the host galaxy and the results of the modeling. The mean observed profile is obtained by azimuthally averaging along a set of concentric ellipses with the ellipticity and PA equal to those of the host galaxy.
According to our X-ray data analysis(see Section2.3.3), the
hydrogen column density corresponding to absorption in both our Galaxy and near M87 is equal to NH=0.050-+0.002´10
0.003 22 cm−2, while there is evidence from our X-ray data for additional X-ray absorption within the central 1″ around M87 with a column density of0.12-+0.040.05´1022cm−2. However, this latter value is most likely variable since much lower values of NH for M87 were detected previously, e.g., NH≈ 0.01 × 1022cm−2 (Sabra et al. 2003) based on UV spectroscopy.
Therefore, as discussed in Prieto et al.(2016) we assume that
the additional X-ray absorber is dust-free and employ the extinction curve (RV= 3.1) and the extinction value (EB−V= 0.022) given by Schlegel et al. (1998) along with the formalism provided by Cardelli et al.(1989) to derive the Figure 4.Mean surface brightness in uvw1 band as a function of the semimajor
axes of concentric ellipses with ellipticity and PA equal to those of the host galaxy; the red, blue, and green curves show the core+ HST-1, jet, and host galaxy profiles, respectively; the solid black curve represents the observed flux, and the black dotted curve gives the totalflux of the model; all of the curves show the average profiles over all images in this band.
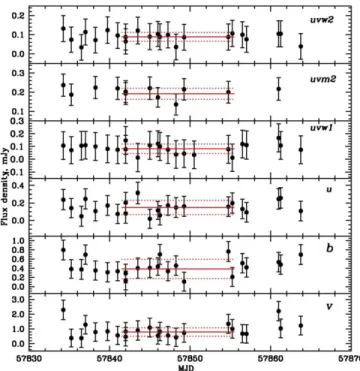
Figure 5.Optical and UV light curves of the core region of M87 in all six UVOTfilters; the red lines show the average flux density in each filter during the EHT campaign and their standard deviations(red dotted lines) along with the time and duration of the campaign.
extinction values in different bands, which are listed in TableA2in AppendixA.
Tables A3andA4in AppendixAgiveflux densities of the core region of M87 corrected for the host galaxy contamination and extinction in optical and UV bands, respectively. Figure 5
shows light curves of the core region during the campaign. According to TableA2in AppendixAand as can be seen from Figure5the standard deviation of Fcoreaveraged over the EHT campaign is significantly less than the uncertainty of an individual measurement in all filters. The uncertainty is dominated by that of the host galaxy decomposition, which is added (in quadrature) to the photometric uncertainty of each measurement. Therefore, based on the UVOT observations we cannot detect variability in the core region of M87 during the EHT campaign, which is consistent with apparently a low activity state of both the core and HST-1 knot. Based on these results we have calculated the UVOT spectral index of the core region during the EHT campaign using the average values of theflux density in the UVOT bands as S ∝ ν− α, which results in α = 1.88 ± 0.55. Although α has a significant error, most likely connected with large uncertainties in the host galaxy decomposition in different bands, the spectral index is consistent with the optical/UV spectral index of the core of M87 reported by Perlman et al. (2011). This indicates that the
core dominates the innermost region of M87 at UV/optical wavelengths during the campaign.
2.2.2. HST Observations
We have downloaded HST images of M87 from the HST archive obtained on 2017 April 7, 12, and 17 with the Wide Field Camera 3 (WFC3) camera in two wide bands, F275W and F606W(ID5o30010, ID5o30020, ID5o31010, ID5o31020, ID5o32010, and ID5o32020). We used fully calibrated and dither combined images. The image obtained on 2017 April 12 in the F606W filter is a part of a composite of M87 multi-wavelength images presented in Section3. The decomposition of the HST images was made using the same imfit package as for the images obtained with the UVOT (Section 2.2.1). The
substantially higher spatial resolution of the HST images (1 pixel is 0 04), however, led to a somewhat different approach. First, we masked out the jet on the images: the HST images reveal its very complex structure, which cannot be approxi-mated with a simple analytical model, as was the case for the low-resolution UVOT images. We also masked out knot HST-1
and the core, which are clearly resolved in the HST images (Figure6). Second, we used a more complex model for the host
galaxy: a sum of two Sérsic models (instead of one as in the case of the UVOT images), which gave us significantly better residual (observations—model) maps. Finally, we used the HST library of PSF images provided at the HST website253to model the PSF in eachfilter. Figure6shows the resulting map of M87 on 2017 April 11 in F606Wfilter, with the host galaxy subtracted.
The decomposition analysis was limited to the central region of the images(16″ × 16″), since the main goal of the process was to subtract the host galaxy flux before the aperture photometry of the core and HST-1. Fitting the full image of the galaxy would have required a more complex model to have comparable quality of thefit for the central regions (see, e.g., Huang et al. 2013). After subtracting the best-fit model from
the images, we performed the aperture photometry with a radius of 0 4 tofind the flux densities from the core and HST-1 in each band. imfit allows one to perform a bootstrap method to derive estimates of uncertainties of the decomposition parameters. For each image, the program was run 100 times, each with same number of random pixels involved in the decomposition process. For each decomposition, a residual FITSfile was constructed containing only the core and HST-1 (100 cases for each band and date). For each such residual file, we performed the aperture photometry with a radius of 0 4 and calculated the standard deviation offlux density measurements of the core and HST-1 over different decompositions. This standard deviation was added in quadrature to the uncertainty of the photometry from the decomposition of the original image in each band and date. Table A5 in Appendix A gives flux densities of the core and HST-1, measured in two different bands and at epochs contemporaneous with the EHT observa-tions. Theflux densities are corrected for the extinction in the same manner as described in Section2.2.1.
According to TableA5in AppendixAthe core shows a slight increase influx density over 10 days, while knot HST-1 has a constant flux density. We have estimated optical/UV spectral indices of the core and HST-1, which are 1.44± 0.09 and 0.60± 0.02, respectively (the spectral index is defined in the same way as in Section2.2.1). These are in good agreement with
those given by Perlman et al.(2011), ∼1.5 for the core and ∼0.5
for HST-1, which confirm a flatter spectral index of HST-1 with respect to that of the core at UV/optical wavelengths.
To determine the activity state of M87 during the 2017 campaign, we have constructed light curves of the core and HST-1 in two bands, F275W(from 1999 to 2017) and F606W (from 2002 to 2017). During the period 1999 to 2010 different instruments were used at HST: UV observations were per-formed with STIS/F250QTZ λeff= 2365 Å, ACS/F220W λeff= 2255.5 Å, and ACS/F250W λeff= 2716 Å (e.g., Madrid
2009). We have used the UV measurements presented in
Madrid(2009) and translated them into WFC3/F275W using
spectral indices reported by Perlman et al. (2011), who
observed M87 in four UV/optical bands during the same period. In addition, Madrid(2009) performed photometry with
an aperture of radius 0 25, so that to construct a uniform UV lightcurve, we have recalculated our measurements in F275W band using the same aperture. For the optical lightcurve in F606W band, we have used measurements provided by
Figure 6.HST image of M87 in F606Wfilter with host galaxy subtracted; the core and HST-1 are designated, the distance between the features is 0 86± 0 04.
253
Perlman et al. (2011) obtained with Advanced Camera for
Surveys (ACS)/F606W and Wide Field Camera 2 (WFC2)/ F606W. Since λeffof these instruments in F606W band is the same as for WFC3/F606W and photometry was performed with the same aperture of radius 0 4, no corrections to the measurements have been applied. Figure7shows the historical UV/optical light curves of M87. Independent of the filter used, HST-1 was in its lowest brightness state ever observed during the EHT campaign. Although the core was in its lowest brightness state at optical wavelengths in 2017, the better-sampled UV lightcurve suggests that the core was in an average quiescent state.
2.3. X-Ray Observations
2.3.1. Chandra
We requested Director’s Discretionary Time (DDT) obser-vations of M87 with the Chandra X-ray Observatory to coordinate with the EHT campaign. The source was observed
with Advanced CCD Imaging Spectrometer(ACIS)-S for 13.1 ks starting on 2017 April 11 23:46:58 UT(ObsID 20034) and again starting on 2017 April 14 02:00:28 UT(ObsID 20035). In order to perform spatially resolved spectral and variability analysis(see Section2.3.3), we also analyzed several archival
Chandra observations. Following Wong et al. (2017), for
constraints on the intra-cluster medium (ICM), we included ObsIDs 352, 3717, and 2707, which were acquired on 2000 July 29, 2002 July 5, and 2004 July 6 and have good exposures of 37.7 ks, 98.7 ks, and 20.6 ks, respectively.
The Chandra observations were processed using standard data reduction procedures in CIAO v4.9.254 We focused on extracting spectra from the core, the knot HST-1, and the outer jet, along with instrumental responsefiles for spectral analysis. We took positions for the core and HST-1 from Perlman & Wilson (2005). For the core, we used a circular source
extraction region with a radius of 0 4 centered on M87 (the
approximate FWHM of 0 8 is quoted in Table A8 in
Appendix A). The core background region is a half annulus
centered on M87 with inner and outer radii of 2″ and 3 5, respectively; we excluded the half of the annulus that is on the same side of the core as the extended X-ray jet. For HST-1, we used a similar circular source region, but for the background annulus we excluded ∼90° wedges containing the core on one side and the extended jet on the other. For the jet itself, we used a 19 5× 3″ rectangular source region centered on the jet, with 19 5× 1 5 rectangular regions on either side. To illustrate the relative brightness and vari-ability of the core and HST-1, we show their lightcurves(1 ks bins) in Figure8. Sun et al.(2018) presented a Chandra study
spanning∼8 yr from 2002 to 2010 with coverage of the core and HST-1 in low and high states(see their Figure 3). In their study, the coreflux drops as low as ∼10−12erg s−1cm−2 (the average is ∼4 × 10⁻¹²erg s−1cm−2). In the 2017 Chandra observations, the unabsorbed core flux in the 0.3–7 keV band is 3× 10⁻¹²erg s−1cm−2, and the absorbed flux is 2× 10⁻¹²erg s−1cm−2—hence our observations show the core below the historical mean.
Because the ICM contributes significantly to the NuSTAR background, we used a single set of extraction regions to produce the Chandra ICM spectrum and the NuSTAR spectra (circular regions of radius 45″, see Section 2.3.2 for more details). In extracting the Chandra ICM spectrum, we excluded the source regions for the core, HST-1, and the extended jet, all of whichfit well within the NuSTAR PSF (Section2.3.2).
2.3.2. NuSTAR
We also requested two DDT observations of M87 with NuSTAR (Harrison et al. 2013) to coordinate with the EHT
campaign in 2017 April. These observations are contempora-neous with the Chandra observations described in Section2.3.1, and they are summarized in TableA6in AppendixA. NuSTAR observations of M87 in 2017 February and April have been presented in Wong et al.(2017).
Raw data from NuSTAR observations were processed using standard procedures outlined in the NuSTAR data analysis software guide (Perri et al. 2017). We used data analysis
software (NuSTARDAS, version 1.8.0), distributed by HEA-SARC/HEASOFT, version 6.23. Instrumental responses were calculated based on HEASARC CALDB version 20180312.
Figure 8. Chandra X-ray lightcurve of the core of M87(black) and HST-1 (blue) in 2017 April, showing a small amount of variability between observations 20034(left panel) and 20035 (right panel).
Figure 7.Historical optical and UV light curves of M87’s core and the HST-1 knot(see also Madrid2009; Perlman et al.2011). Horizontal dashed lines
indicate the lowest flux density level of the core in the F606W (red) and F275W(black) filters, the vertical green dotted line marks the time of the EHT campaign.
254
We cleaned and filtered raw event data for South Atlantic Anomaly(SAA) passages using the nupipeline script; both minimal and maximalfiltering levels were considered, with no substantial differences in the results. We used a source extraction region that is a circle with 45″ radius, while the background region was chosen as an identical region well separated from the peak of the hard X-ray emission(which is a point source above 12 keV, per Wong et al. 2017). Note that
this does not include all of the low-energy extended emission resolved with Chandra(see Section2.3.1), nor does it subtract
it out. However, we modeled the low-energy (3 keV) X-ray and high-energy(8 keV) X-ray emission jointly, as described in Section 2.3.3. Source and background spectra were computed from the calibrated and cleaned event files using the nuproducts tool.
2.3.3. Joint Chandra and NuSTAR Spectral Analysis
Given the spatial complexity of the underlying X-ray emission, any detailed analysis of the X-ray spectrum of M87 must involve a joint treatment of Chandra and NuSTAR data. Here we discuss our strategy for this analysis.
To properly recover the intrinsic spectrum of the core in M87 up to 40–50 keV, it was necessary to either subtract or model the bright emission of the ICM. Given our interest in the core and HST-1, which are moderately bright point sources, we must correct our spectra for pileup (see Section 2.3.1). Since
this correction depends on the total count rate per pixel per frame time (Davis 2001), it must be applied without
back-ground subtraction. Thus, we chose to model the ICM spectrum.
We also needed to account for variations between different detectors and epochs. It is common practice to include a cross-normalization constant between NuSTAR’s FPMA and FPMB detectors. We opted to take the same approach when jointly modeling NuSTAR and Chandra data: we allowed additional cross-normalization constants between the Chandra spectrum and the NuSTAR spectrum. Because the archival Chandra observations we used to constrain the ICM spectrum are nearly 20 yr old(and because of Chandra’s changing effective area at soft X-ray energies due to contaminant buildup255), we allowed those data to have a different cross-normalization constant than the 2017 data.
Schematically, then, we can represent the model for the NuSTAR spectra of M87 as follows:
( ) = ´ + ´ + - + F A F B F F F NuSTAR,FPMA Chandra,ICM
Chandra,core Chandra,HST 1 Chandra,jet
and ( ) = ´ + ´ + - + F C F D F F F , NuSTAR,FPMB Chandra,ICM
Chandra,core Chandra,HST 1 Chandra,jet
where A, B, C, and D are cross-normalization constants, FChandra,ICM is the model for the Chandra ICM emission, and similar notation holds for the Chandra spectra of the core, the nearby knot HST-1, and the rest of the jet. Again, the purpose of this procedure is to use Chandra to account for all of the X-ray emission inside the NuSTAR extraction region, while
allowing for time-dependent normalization constants between missions and detectors.
With the structure of our model defined, we proceeded to select models for each of the components. The ICM has a complex physical structure and three-dimensional temperature profile. Our purpose here was not to model the cluster gas physics but to reconstruct the ICM spectrum with sufficient accuracy to model the X-ray continuum from M87 itself. Following Wong et al. (2017), we adopted a two-temperature
Astrophysical Plasma Emission Code (APEC) model (Smith
Figure 9.Chandra and NuSTAR spectra of M87. Top panel: count rate spectra from both observatories from 2017 April. Spectra have been rebinned for plotting purposes. In both panels, the Chandra spectrum of the underlying ICM is shown in green, while the NuSTAR FPMA and FPMB are shown in black and blue, respectively; the red curve is the total model spectrum for each data set. In the top panel, the spectrum of the core, HST-1, and the outer jet are shown in orange, magenta, and cyan, respectively. Bottom panel: unfolded spectra from Chandra and NuSTAR. Because the Chandra core/HST-1/jet spectra have the pileup kernel applied(Section2.3.1), they are excluded from
theflux plot.
255
et al.2001) with variable abundances (vvapec). We allowed
the Ne, Na, Mg, Al, Si, S, Ar, Ca, and Fe abundances to vary and included three Gaussian emission lines; note that this treatment differs slightly from Wong et al. (2017), who used
solar metallicities and 5 Gaussians to account for their residuals relative to the APEC models. We also included a cutoff power-law to model the low-mass X-ray binary(LMXB) emission in the extraction region with photon index Γ = 0.5 and cutoff energy Ec= 3 keV (Revnivtsev et al. 2014). This model was modified by interstellar absorption; we use the model tbnew (Wilms et al.2000) with atomic cross-sections from Verner &
Yakovlev(1995).
For the core, HST-1, and the remainder of the jet, we modeled their continuum emission using power laws(modified by the same interstellar absorption component as the ICM emission). However, inspection of the spectra in the top panel of Figure 9 revealed a steeper rollover in the soft X-ray spectrum of the core (orange) than in HST-1 or the outer jet. This is typical of ISM absorption, so we included a second tbnew component in the model for the spectrum of the core (see Wilson & Yang 2002; Perlman & Wilson2005, but also Di Matteo et al.2003). As noted above, these spectra required a
pileup correction; the “grade migration” parameter α is tied between the two contemporaneous Chandra spectra of each spatial component.
While the Chandra data effectively disentangle the spatial components of M87, the NuSTAR data are superior when it comes to constraining the photon index, given their wider energy range. But because the count rates are low, we allowed the model X-ray flux to vary between observations while assuming the photon index was constant.
Forfitting, the Chandra spectra were binned to a minimum S/N of 3 between 0.4 and 8 keV. To maximize the useful energy range of the NuSTAR data, we grouped the spectrum from each FPM to a minimum S/N of only 1.1; we also rebinned the spectra by factors of 3, 4, 5, 6, and 7 over the energy ranges 3–51 keV, 51–59 keV, 59–67 keV, 67–74.9 keV, and 74.9–79 keV, respectively (this reduces oversampling of the energy resolution; J. Steiner 2021, private communication). Because very low count rates are involved for some energy bins, we used Cash statistics(Cash 1979). Our best fit gave a
reduced Cash statistic of 1.26(a Cash statistic of 1392 for 1139 data bins and 38 free parameters). Our power-law model does not rule out possible curvature in the high-energy X-ray spectrum.
Given the possibility of complex correlations between parameters in this model, we opted to determine confidence intervals for our parameters using Markov Chain Monte Carlo (MCMC) methods. We used an implementation of the affine-invariant sampler emcee, after Goodman & Weare(2010) and
Foreman-Mackey et al.(2013), with 10 walkers for each of the
38 free parameters and let the sampler run for 20,000 steps. At present, we focus on the spectral index, flux, and ISM absorption for each of our spatial components; additional parameters shall be described below as necessary. Unless otherwise noted, quoted uncertainties represent 90% credible intervals; these generally align well with our 90% confidence intervals from directfitting.
Our results confirm our inspection of the Chandra spectrum of the core of M87: it is more highly absorbed than the rest of the jet. All components required a small absorbing column density NH=0.050-+0.0020.003 ´1022 cm−2, though this is larger
than the Galactic value from HIstudies (0.025 × 1022 cm−2; Dickey & Lockman 1990, 0.025× 1022cm−2; HI4PI Colla-boration et al.2016). The core, however, required an additional
= -+ ´
NH,excess 0.12 0.040.05 1022cm−2of intervening gas, over and above the column toward the rest of the jet. The origin of this excess absorption is not known. It was not detected by Di Matteo et al. (2003), but was mentioned by Wilson & Yang
(2002) and Perlman & Wilson (2005). If it is real, it is most
likely absorption in the galaxy M87 itself, though it is difficult to speculate on its properties without knowing more about its variability, which will be discussed in future work(J. Neilsen et al. 2021, in preparation). An alternative interpretation is that there is measurable curvature in the core spectrum at these energies.
Theflux itself is not a parameter of our fits, but it is easily calculated from the normalization of the power law. We drew 1000 samples from our chain, excluding thefirst 4000 steps to account for the burn-in period. For each sample we used the power-law photon index and normalization for each spectral component to calculate the 2–10 keV luminosity, assuming a distance of 16.8 Mpc as in EHT Collaboration et al. (2019a).
For 2017 April, we found an X-ray luminosity of (4.8 ± 0.2) × 1040erg s−1, with a photon index G =2.06-+0.070.10.
2.3.4. Swift-X-Ray Telescope(XRT)
M87 was observed using Swift-XRT from 2017 March 27 to April 20. A total of 24 observations in the photon counting mode were conducted, out of which 12 were discarded due to the fact that M87 was centered on the bad columns, which resulted from a micrometeorite impact in 2005. For the purpose of this work, we analyzed data for the remaining 12 epochs. First, all the cleaned level 3 eventfiles were generated using xrtpipeline version 0.13.5. For spectral extraction, a circular source region with a diameter of 15 pixels(35″) and an annular background region were chosen. If the source counts exceeded 0.5 cts s−1, a pile-up correction was performed. In this case, an appropriate annular region was selected as the source region for the final spectrum extraction, ensuring that the piled-up region is removed from the final extraction process. The exposure maps created by the xrtpipeline were utilized to create the Ancillary Response File (arf) for each spectrum employing the xrtmkarf command. The Response Matrix File(rmf) used in this process was later used to group all these spectral files for each epoch, using the
grpphacommand.
Figure 10.Variability in the Swift-XRT unabsorbed flux (2–10 keV) from 2017 March 27 to April 20. The Total Flux refers to the overall unabsorbed flux derived from the spectral fitting to the composite model. The net flux from only the three components, i.e., core, HST-1 and outer jet is referred to as the Flux(core+HST-1+jet), which was calculated from their respective spectralfitted parameters.
The spectral resolution of Chandra provided well-con-strained model parameters for M87 data obtained during the same time as Swift-XRT. The composite model contained a complex background model, which is a sum of the ISM, ICM, and any remaining background. All the details for this model, in addition to the details for the power-law models for the core, HST-1 and the jet, respectively, are described in the previous section. These Chandra derived parameters were used as a guide tofit the spectra obtained from Swift-XRT, freezing all parameters other than (1) the overall normalization of the power-law continuum components(spectral slopes and relative normalizations remainedfixed) and (2) the normalization of the background component, vvapec. The overall variability seen in Figure 10 contains contributions from both the power-law continuum and background component variations. The varia-bility of the background component may be an artifact of our assumptions about the cross-normalization of the Swift-XRT models relative to Chandra and NuSTAR. It could also indicate some residual systematic uncertainty in the spectral decom-position (background versus core, jet, and HST-1) that is not accounted for in our error bars. In any case, the non-ICMfluxes represent an upper limit on the core X-ray emission for our SED modeling, and so this precise decomposition does not have a significant impact on our conclusions about the SED.
The overall evolution of the lightcurve for M87 in 2017 is displayed in Figure10. We derived an overall total unabsorbed flux using the spectral fits for each epoch. We also calculated the netflux resulting from the core, HST-1, and outer jet only from these fits by removing the background model from the final fit, which helped estimate the combined flux only from these three components of M87. Both these flux values are reported in Figure 10. A day to day variability of the order of about∼5%–20% is seen during this time. However, an overall variation in the flux by about a factor of 3 was seen during 2017. Note that the spatial location of the variability can not be provided due to the lower angular resolution of Swift-XRT.
2.4.γ-Ray Data
2.4.1. Fermi-Large Area Telescope(LAT) Observations
The γ-ray emission at GeV energies from M87 was first reported in 2009, using thefirst 10 months of observations with Fermi-LAT (Abdo et al. 2009a). Fermi-LAT (Atwood et al. 2009) mainly operates in survey mode, observing the whole
sky every three hours. Connected to the EHT campaign, during the period 2017 March 22 to April 20, pointing mode observations256 of M87 have been specially performed providing additional 500 ks of data on this source, allowing the source to be effectively observed>56% of the time (w.r.t. the standard ∼48%) during the EHT campaign.
We performed a dedicated analysis of the Fermi-LAT data of M87 using 11 yr of LAT observations taken between 2008 August 4 and 2019 August 4. Similarly, we repeated the analysis using three-month time bins centered on the EHT observation period (i.e., 2017 March 1–May 31). We selected P8R3 Source class events (Bruel et al. 2018), in the energy
range between 100 MeV and 1 TeV, in a region of interest (ROI) of 20° radius centered on the M87 position. The low-energy threshold is motivated by the large uncertainties in the arrival directions of the photons below 100 MeV, leading to a
possible confusion between point-like sources and the Galactic diffuse component. See Principe et al. (2018, 2019) for a
different analysis implementation to solve this and other issues at low energies with Fermi-LAT.
The analysis (which consists of model optimization, and localization, spectrum, and variability study) was performed with Fermipy257(Wood et al.2017), a Python package that
facilitates analysis of LAT data with the Fermi Science Tools, of which the version 11-07-00 was used. The counts maps were created with a pixel size of 0°.1. All γ-rays with zenith angle larger than 95° were excluded in order to limit the contamina-tion from secondaryγ-rays from the Earth’s limb (Abdo et al.
2009b). We made a harder cut at low energies by reducing the
maximum zenith angle and by selecting event types with the best PSFs.258For energies below 300 MeV we excluded events with zenith angle larger than 85°, as well as photons from PSF0 event type, while above 300 MeV we use all event type. The P8R3_Source_V2 instrument response functions (IRFs) are used. The model used to describe the sky includes all point-like and extended LAT sources, located at a distance<25° from the source position, listed in the Fourth Fermi-LAT Source Catalog (4FGL; Abdollahi et al.2020), as well as the Galactic diffuse
and isotropic emission. For these two latter contributions, we made use of the same templates259 adopted to compile the 4FGL. For the analysis we first optimized the model for the ROI (fermipy.optimize), then we searched for the possible presence of new sources(fermipy.find_sources) and finally we re-localized the source(fermipy.localize). We investigated the possible presence of additional faint sources, not in 4FGL, by generating test statistic260 (TS) maps and we found two candidate new sources, detected at 5σ level, that we added into our model. The best-fit positions of these new sources are R.A., decl.= (184°.85, 5°.82) and (191°.99, 7°.20), with 95% confidence-level uncertainty R95= 0°.07. We left free to vary the diffuse background and the spectral parameters of the sources within 5° of our target. For the sources at a distance between 5° and 10° only the normalization was fitted, while we fixed the parameters of all the sources within the ROI at larger angular distances from our target. The spectral fit was performed over the energy range from 100 MeV to 1 TeV. To perform a study of theγ-ray emission variability of M87 we divided the Fermi-LAT data into time intervals of 4 months. For the lightcurve analysis we havefixed the photon index to the value obtained for 11 yr and left only the normalization free to vary. The 95% upper limit has been reported in each time interval with TS< 10.
The results on the 11 yr present a significant excess, TS= 1781 corresponding to a significance >40σ, centered on the position (R.A., decl.) = (187°.73± 0°.03 , 12°.36± 0°.04), compatible with the position of 4FGL J1230.8+ 1223 and associated with M87. The averaged flux for the entire period is Flux11 yr= (1.72 ± 0.12) × 10−8ph cm−2s−1. We model the spectrum of the source with a power-law function
256Fermi ToO: https://fermi.gsfc.nasa.gov/ssc/observations/timeline/too/ 090606-1-1.html.
257http://fermipy.readthedocs.io/en/latest/ 258
A measure of the quality of the direction reconstruction is used to assign events to four quartiles. Theγ-rays in Pass 8 data can be separated into four PSF event types: 0, 1, 2, 3, where PSF0 has the largest PSF and PSF3 has the best.
259
https://fermi.gsfc.nasa.gov/ssc/data/access/lat/BackgroundModels.html 260
The test statistic is the logarithmic ratio of the likelihood of a source being at a given position in a grid to the likelihood of the model without the source, TS= 2log(likelihood
likelihood
src
(dN = ´
( )
-GdE N
E E
0
0 ). The spectral best-fit results for 11 yr of
LAT data of M87 are Γ = 2.03 ± 0.03 and N0=
(1.64 ± 0.07) × 10−12(MeV cm−2s−1) for E
0= 1 GeV, which are in agreement with the 4FGL results for this source (Γ4FGL= 2.05 ± 0.04). For the three-month EHT observation period specifically (i.e., 2017 March 1–May 31), the source is detected with a significance of ;8σ (TS = 72). The spectrum obtained for the three-month period centered on the EHT observation presents a slightly harder photon index with respect to the one obtained using 11 yr, with a power-law index of Γ = 1.84 ± 0.18 and N0= (1.50 ± 0.44) × 10−12 MeV cm−2s−1. During the EHT observational period, M87 reveals a brightness level comparable to the average state of the source, with a flux (F2017= 1.58 ± 0.50 × 10⁻⁸ ph cm−2s−1) compatible with the averaged flux estimated for the entire period.
2.4.2. H.E.S.S., MAGIC, VERITAS Observations
In 1998 the first strong hint of very-high energy (VHE; E> 100 GeV) γ-ray emission from M87 was measured by the High Energy Gamma Ray Astronomy(HEGRA) Collaboration (Aharonian et al. 2003). Since 2004, the source has been
frequently monitored (Acciari et al.2009; Abramowski et al.
2012) in the VHE band with the High Energy Stereoscopic
System (H.E.S.S.; Aharonian et al. 2006a), the Major
Atmo-spheric Gamma Imaging Cherenkov (MAGIC; Albert et al.
2008; Aleksić et al. 2012; MAGIC Collaboration et al.2020)
telescopes, and the Very Energetic Radiation Imaging Tele-scope Array System (VERITAS; Acciari et al. 2008, 2010; Aliu et al. 2012; Beilicke & VERITAS Collaboration2012).
Over the course of its monitoring, M87 exhibited high VHE emission states in 2005(Aharonian et al.2006a), 2008 (Albert
et al.2008), and 2010 (Abramowski et al.2012) that lasted one
to a few days. A weak two-month VHE enhancement was also reported for 2012 (Beilicke & VERITAS Collaboration2012),
but since 2010, no major outburst has been detected in VHE γ-rays. During the observed high states the flux typically increased by factors of two to 10, while no significant spectral hardening was detected. In the following we describe the participating instruments, observations, and data analyses of the coordinated 2017 MWL campaign.
The H.E.S.S. observations presented here were performed using stereoscopic observations with the four 12 m CT1-4 telescopes (see Table A7). These observations of a total of
7.9 hr of live time were taken in so-called“wobble” mode with an offset of 0°.5 from the position of M87, allowing simultaneous background estimation. The reconstruction of the Cherenkov shower properties was done using the ImPACT maximum likelihood-based technique(Parsons & Hinton2014; Parsons et al. 2015) and hadron events were rejected with a
boosted decision tree classification (Ohm et al. 2009). The
background was estimated using the so-called “ring-back-ground model” for the signal estimation and the “reflected-background model” for the calculation of the flux and the spectrum(Aharonian et al.2006b). For the 7.9 hr of data a total
statistical significance of 3.7σ was calculated. A source with 1% of the Crab Nebula’s flux can be detected in ∼10 hr. Based on the estimated systematic uncertainties following Aharonian et al. (2006b), the systematic uncertainty of the flux has been
adopted to be 20%.
For this study MAGIC observed M87 for a total of 27.2 h after quality cuts with the standard wobble offset of 0°.4. The data were analyzed with the standard MAGIC software framework MAGIC Analysis and Reconstruction Software (MARS; Zanin et al.2013; Aleksić et al.2016). We used the
package SkyPrism, a spatial likelihood analysis, to determine the PSF in true energy(Vovk et al.2018). 6.7 hr of these data
were collected in the presence of moonlight and analyzed according to Ahnen et al. (2017). All MAGIC observations
together yielded a total significance of 4.6σ. MAGIC can detect a source with 1% of the Crab Nebula’s flux in ∼26 hr above an energy threshold of 290 GeV. A detailed description of the various sources and estimates of systematic uncertainties in the MAGIC telescopes and analysis can be found in Aleksić et al. (2016). From there we estimate a systematic flux normalization
uncertainty of 11%, a systematic uncertainty on the energy scale of 15% and a systematic uncertainty of ±0.15 on the reconstructed spectral slope for the MAGIC observations, which sums up to a total of∼30% integral flux uncertainty.
VERITAS collected 15 hr of quality-selected observations of M87 during the 2017 EHT campaign window using a 0°.5 wobble. Data were analyzed using standard analysis tools (Cogan 2007; Daniel 2008; Maier & Holder 2017) with
background-rejection cuts optimized for sources with spectral photon indices in the 2.5–3.5 range. The analysis yields an overall statistical significance of 3.8σ. In its current configura-tion, VERITAS can detect a source with aflux of 1% of the γ-ray flux of the Crab Nebula within 25 hr of observation (Park 2015). We estimate a systematic uncertainty on the
quoted photonflux of 30%.
Separate differential spectra and differential upper limits
were produced assuming a power law of the form
µ -G
dN dE E for each instrument. For the different instru-ments theγ-ray flux is measured in five independent bins per energy decade, respectively, withflux points being quoted for bins with a significance larger than 2σ. A differential upper limit at the 95% confidence level following the method described in Rolke et al.(2005) is quoted otherwise. The bin
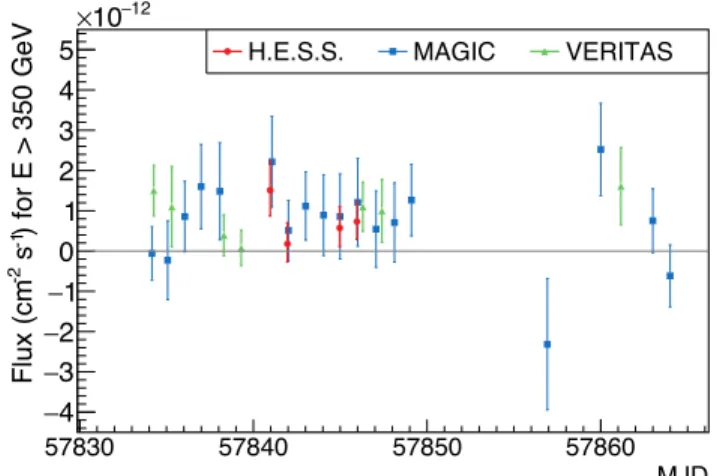
edges vary among the different Imaging Atmospheric Cher-enkov Telescope (IACT) measurements due to differences in instrumental and observational conditions. Night-wise inte-gratedflux points and upper limits were calculated for the light curves above an energy threshold of 350 GeV assuming a
Figure 11.Flux measurements of M87 above 350 GeV with 1σ uncertainties obtained with H.E.S.S., MAGIC, and VERITAS during the coordinated MWL campaign in 2017. Upper limits forflux points with a significance below 2σ are provided in TableA7in AppendixA.