HAL Id: hal-00298658
https://hal.archives-ouvertes.fr/hal-00298658
Submitted on 10 Jun 2005HAL is a multi-disciplinary open access
archive for the deposit and dissemination of sci-entific research documents, whether they are pub-lished or not. The documents may come from teaching and research institutions in France or abroad, or from public or private research centers.
L’archive ouverte pluridisciplinaire HAL, est destinée au dépôt et à la diffusion de documents scientifiques de niveau recherche, publiés ou non, émanant des établissements d’enseignement et de recherche français ou étrangers, des laboratoires publics ou privés.
Groundwater compartmentalisation: a geochemical
analysis of the structural controls on the subdivision of a
major aquifer, the Sherwood Sandstone, Merseyside, UK
E. A. Mohamed, R. H. Worden
To cite this version:
E. A. Mohamed, R. H. Worden. Groundwater compartmentalisation: a geochemical analysis of the structural controls on the subdivision of a major aquifer, the Sherwood Sandstone, Merseyside, UK. Hydrology and Earth System Sciences Discussions, European Geosciences Union, 2005, 2 (3), pp.939-970. �hal-00298658�
HESSD
2, 939–970, 2005 Groundwater com-partmentalisation E. A. Mohamed and R. H. Worden Title Page Abstract Introduction Conclusions References Tables Figures J I J I Back CloseFull Screen / Esc
Print Version Interactive Discussion
EGU
Hydrol. Earth Sys. Sci. Discuss., 2, 939–970, 2005 www.copernicus.org/EGU/hess/hessd/2/939/ SRef-ID: 1812-2116/hessd/2005-2-939 European Geosciences Union
Hydrology and Earth System Sciences Discussions
Papers published in Hydrology and Earth System Sciences Discussions are under open-access review for the journal Hydrology and Earth System Sciences
Groundwater compartmentalisation: a
geochemical analysis of the structural
controls on the subdivision of a major
aquifer, the Sherwood Sandstone,
Merseyside, UK
E. A. Mohamed and R. H. Worden
Department of Earth and Ocean Sciences, University of Liverpool, 4, Brownlow Street, Liverpool, L69 3GP, UK
Received: 19 April 2005 – Accepted: 24 May 2005 – Published: 10 June 2005 Correspondence to: E. A. Mohamed ([email protected])
HESSD
2, 939–970, 2005 Groundwater com-partmentalisation E. A. Mohamed and R. H. Worden Title Page Abstract Introduction Conclusions References Tables Figures J I J I Back CloseFull Screen / Esc
Print Version Interactive Discussion
EGU
Abstract
The study was initiated to assess the local groundwater flow, the extent of seawater invasion and the controls on recharge in the aquifer and to try to understand whether the aquifer is broken into discrete compartments. The study area is located in the northwest of England and encompasses the urban area of Liverpool and
surround-5
ing countryside and extends east-west from Liverpool to Widnes and as far north as Formby. The Irish Sea marks the western margin of the area while the Mersey estu-ary defines the southern margin. The Triassic sandstone in this area has been, and remains, an important aquifer although industrialisation and groundwater exploitation have led to significant water quality problems.
10
Maps of water table for the years 1993, 1997, 2000 and 2002 and schematic cross-sections of the water table height along the faults were prepared to trace any effect of these faults on water table height across. Studying the water table maps and cross sections revealed that: 1) there are substantial differences in water table height across some of the NNW-SSE trending faults implying that groundwater flow is strongly limited
15
by fault, 2) an anticline in the east of the area acts as a groundwater divide and 3) the water table seems to follow the topography in some places, although steep changes in water table occur across faults showings that they locally control the water table elevation. The aquifer was thus provisionally subdivided into several hydrogeological sub-basins based on water table height patterns and the occurrence of major structural
20
features (faults and a fold).
Using groundwater geochemistry data, contour maps of chloride and sulphate con-centration largely support the structural sub-division of the area into hydrogeological sub-basins. Scrutiny of groundwater geochemical data, averaged for each sub-basin, confirmed the degree of compartmentalisation and the occurrence of sealed faults. The
25
variation of the geochemical composition of the groundwater not only relates to the dif-ferent, localised geochemical processes and seawater intrusion but also relate to com-partmentalisation due to faulting. Faults have limited the degree of mixing between the
HESSD
2, 939–970, 2005 Groundwater com-partmentalisation E. A. Mohamed and R. H. Worden Title Page Abstract Introduction Conclusions References Tables Figures J I J I Back CloseFull Screen / Esc
Print Version Interactive Discussion
EGU
groundwater types thus retaining the specific characteristics of each sub-basin. Highly localised seawater intrusion is mainly controlled by low permeability fault close to the Irish Sea and Mersey estuary. There is no effectively no invasion of seawater beyond the faults that lie closest to the coastline. Freshwater recharge to the aquifer must be highly localised and will mainly occur by vertical percolation of rain and surface water
5
rather than whole aquifer-scale groundwater flow.
1. Introduction
Many coastal zones accommodate high population densities. For example 50% of the world’s population lives within 60 km of shorelines (Oude Essink, 2001). For a long time, mankind has been attracted to these areas because of the relative abundance of
10
food (e.g. fisheries and agriculture) and the presence of economic infrastructure (e.g. roads along lowland coastal regions, harbours, etc.). Due to increasing concentration of human settlements, agricultural development and economic activities, the shortage of fresh groundwater for domestic, agricultural, and industrial purposes becomes more striking in these coastal zones (Oude Essink, 2001) and groundwater aquifers are
in-15
creasingly vulnerable to different sources of pollution. Coastal aquifers within the zone of influence of mean sea level (MSL) are threatened by an accelerated rise in the global MSL. This rise in global MSL, 50 cm for the coming century as a present best-estimate, could further jeopardise vulnerable coastal aquifers. This could mean a reduction of fresh groundwater resources (Oude Essink, 2001).
20
Groundwater locally provides more than 75% of public water supply in the UK and
>35% in England and Wales as a whole. Protecting groundwater supplies is important
in industrialised areas; understanding recharge and how, and in what direction, water moves within an aquifer are important steps in developing practical strategies. The area contributing recharge to a well is the surface area that defines the location of the
25
water entering the groundwater system. Water entering the system at the water table flows to the well and is eventually discharged from the well. Therefore, much work
HESSD
2, 939–970, 2005 Groundwater com-partmentalisation E. A. Mohamed and R. H. Worden Title Page Abstract Introduction Conclusions References Tables Figures J I J I Back CloseFull Screen / Esc
Print Version Interactive Discussion
EGU
has focused on the protection of water supplies by determining the areas contributing recharge to water-supply wells and by specifying regulations to minimize the oppor-tunity for contamination of the recharge water by activities at the land surface (Reilly and Pollock, 1993). A key issue is the degree of compartmentalisation of aquifers. This issue is important since it fundamentally controls how different parts of an aquifer
5
are connected and how, and in what direction, water moves within an aquifer. Com-partmentalisation of fluid-bearing porous and permeable rocks has been the subject of great interest in the petroleum industry since understanding the degree of segmenta-tion of oil fields has a major impact on producsegmenta-tion strategies (e.g. Smalley and England, 1992, 1994; Smalley et al., 1995). Compartmentalisation broadly occurs due to a
com-10
bination of impermeable faults, interbedded permeable and impermeable rock units, lateral pinch-out of permeable sedimentary units. The degree of oilfield compartmen-talisation has been assessed using a combination of structural geology, sedimentology, fluid pressure analysis and fluid geochemical differences (e.g. Smalley and England, 1992, 1994; Smalley et al., 1995). There has been much less attention paid to the
15
occurrence of compartmentalised groundwater-bearing aquifers. While the main driver for the study of compartmentalised petroleum accumulations is the maximisation of profit, the driver for the study of the compartmentalisation of groundwater aquifers is the protection of resources and observance of ever-stricter environmental legislation.
In this study we will apply some of the approaches adopted by the petroleum industry
20
to assess the degree of compartmentalisation of a locally important aquifer in the UK: the Triassic Sherwood Sandstone. We will assess potential compartments within the aquifer using geological and water table elevation maps and and then test these initial ideas using geochemical data. The key scientific questions being addressed are:
1. Is the Sherwood Sandstone, in the Merseyside area, a “tank of sand” (an implicit
25
assumption in the hydrogeological map of Lewis et al., 1989), or is it split into separate compartments or sub-basins?
HESSD
2, 939–970, 2005 Groundwater com-partmentalisation E. A. Mohamed and R. H. Worden Title Page Abstract Introduction Conclusions References Tables Figures J I J I Back CloseFull Screen / Esc
Print Version Interactive Discussion
EGU
separate compartments or sub-basins within an aquifer?
1.1. A brief history of investigation of the Sherwood Sandstone aquifer in Merseyside
The study area is located in the industrially important and populous north west of Eng-land and encompasses the urban area of Liverpool (Fig. 1). The intensively investi-gated area extends from Widnes to Liverpool and as far north as Formby.
5
Despite the local and national importance of the Sherwood Sandstone aquifer, few previous studies substantially mentioned the roles of lithology and geological structure as controls on groundwater geochemistry.
The occurrence and movement of groundwater in the district were discussed by Stephenson (1850) including the importance of fissures and the fact that there was a
10
finite amount groundwater. He also recognized the occurrence of seawater intrusion into the freshwater aquifer. The role of regional topography as a control on groundwater contours for the Sherwood aquifer (in the east of England) was discussed by Strahan in Hull (1882). Significantly, Morton (1866) discussed the location of wells as a possible control on yield and water quality and concluded that the highest yielding wells were
15
located on faults. In contrast, Moore (1902) examined the porosity across a fault plane in the Sherwood Sandstone aquifer on the adjacent Wirral peninsula, just south of the area of interest, and concluded that porosity-reduction occurred across fault planes since they were cemented by calcite and pyrite. Also a porosity-occluding clay-rich fault gouge was found in two zones up to 0.5 m thick.
20
The Mersey Railway Tunnel, excavated through the aquifer, connects the Liverpool area to the Wirral (essentially the industrial town of Birkenhead) and it was recorded that abstraction from the tunnel led to deterioration of groundwater quality (Wedd et al., 1923).
The hydrogeology of the Sherwood Sandstone aquifer in the Merseyside and
Manch-25
ester areas was described in reports for the Geological Survey by Taylor (1957) and Land (1964). Both authors presented maps with groundwater contours. The high de-gree of faulting in the aquifer and its possible importance for internal boundaries
occur-HESSD
2, 939–970, 2005 Groundwater com-partmentalisation E. A. Mohamed and R. H. Worden Title Page Abstract Introduction Conclusions References Tables Figures J I J I Back CloseFull Screen / Esc
Print Version Interactive Discussion
EGU
ring within the Permo-Triassic aquifer was noted by University of Birmingham (1981). In an assessment of the saline intrusion into the Sherwood Sandstone aquifer it was suggested that wherever fault movement was small the effect on the transmissivity might be small depending on the nature of the fault zone (University of Birmingham, 1984). Large displacement, however, may juxtapose impermeable strata against
per-5
meable strata leading to a significant local reduction in hydraulic conductivity. Just outside of the studied area, the Roaring Meg fault has low permeability and restricts saline groundwater movement (Tellam et al., 1986). However the published synthetic hydrogeological map of the area has water table contours that ignore all faults and has seemingly been drawn on the assumption that the aquifer is not sub-divided into
10
compartments (Lewis et al., 1989).
The main objectives of this study will be focused on the role of the structural geology of the area explicitly trying to establish the impact of faults on groundwater conditions using records of water table height and geochemistry variations over the period 1993 to 2002.
15
2. Geology and physical geography
Permo-Triassic sedimentary rocks represent the principle aquifer units in the area. The regional stratigraphy is represented in Table 1 with the regional distribution of rocks at the surface given in Fig. 1a. Permo-Triassic sedimentary rocks rest unconformably over Upper Carboniferous well-indurated sandstones and mudstones that are typically
20
considered to denote the low permeability base of the aquifer. These older rock units crop out in the east and north east of the area (Fig. 1a). The Carboniferous rocks have undergone extensive burial and uplift and the sandstones have negligible permeability. In contrast the overlying Permo-Triassic sedimentary rocks have not lost all their de-positional porosity since they have not undergone cycles of extensive burial and uplift.
25
The Permo-Triassic sedimentary succession starts with the Collyhurst Sandstone For-mation, which is red to grey in colour and fine to medium grained. The
stratigraphically-HESSD
2, 939–970, 2005 Groundwater com-partmentalisation E. A. Mohamed and R. H. Worden Title Page Abstract Introduction Conclusions References Tables Figures J I J I Back CloseFull Screen / Esc
Print Version Interactive Discussion
EGU
equivalent Manchester Marl and Bold Formations conformably overlie the Collyhurst Sandstones. The Manchester Marl, which predominates in the north, is not well ex-posed in the area but boreholes showed that in the northern limit of the area of study (in the vicinity of Formby) it is composed of calcareous siltstone or shale with thin bands of fossiliferous limestone (University of Birmingham, 1984). The age-equivalent Bold
5
Formation in the southern part of the study area (Speke) is made up of fine to very fine-grained sandstones.
The major sandstone-dominated unit that represents the bulk of the aquifer in the area, the Sherwood Sandstone Group, overlies the Manchester Marl and Bold forma-tions. The base of this group is the Chester Pebble Formation. This formation is made
10
up of two units; the Lower Mottled Sandstone Unit, composed of red and brown, fine to medium grained weakly cemented sandstone, followed by the Pebble Beds Unit, com-posed of red or yellow, cross laminated, coarse to medium grained pebbly sandstones. The overlying Wilmslow Sandstone Formation is characterised by soft, fine-grained sandstones. The Ormskirk Sandstone Formation has two lithological units; a lower
15
one directly overlying the Wilmslow Formation consists of greyish-yellow to red sand-stone and upper one composed of medium and fine grained sandsand-stone.
The Upper Triassic Mercia Mudstone Formation, a major argillaceous sequence overlying the Sherwood Sandstone, is considered to be the upper low permeability boundary of the entire aquifer. It is composed of two units: the lower one being the
20
Tarporly Siltstone and the upper one being the Mercia Mudstone.
The Quaternary system represents a very short length of geological time and is characterised in the area by a restricted depositional thickness, which nevertheless is of hydrogeological significance. Thicknesses of 5 to 10 m are common, but significant parts of the area are without Quaternary cover (e.g. Liverpool, Kirkby, and Ormskirk;
25
University of Birmingham, 1984). Lithologically, these deposits dominated by glacial tills and sands followed by well-sorted sands sometimes intercalated with peat beds. River alluvium of silt, sand and clay has mainly developed in the valley of the River Alt, where the recent estuarine alluvium of sand, silt and mud occurs (University of
HESSD
2, 939–970, 2005 Groundwater com-partmentalisation E. A. Mohamed and R. H. Worden Title Page Abstract Introduction Conclusions References Tables Figures J I J I Back CloseFull Screen / Esc
Print Version Interactive Discussion
EGU
Birmingham, 1984; Tellam, 1994). 2.1. Geological structures
The structural geology of the area is dominated by a variety of faults as represented on published geological maps and cross sections from the British Geological Survey (and its predecessors) and other published work (e.g. Morton, 1866; Wedd et al., 1923;
5
Shackleton, 1953; University of Birmingham, 1984).
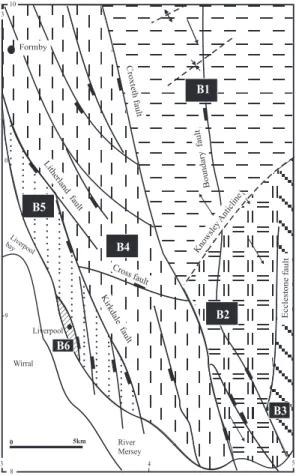
Although faults dominate the geological structure from the hydrogeological perspec-tive (Fig. 1a), there is also a subtle low amplitude fold with its axis running approxi-mately northeast to southwest. This fold is known as the Knowsley anticline (Fig. 1a) and it results in a general, low angle northwest dip over the northern part of the study
10
area and southeast dip in the vicinity of Halewood, Speke and Widnes. There are other small syn- and anti-forms to the north of the Knowsley anticline but they have a very limited effect on the general dip of the strata.
The area is intensively disrupted by numerous large faults. These generally trend north-northwest – south-southeast with some smaller east – west cross faults. The
15
faults are normal with an average 60◦ dip (Jones et al., 1938). The throws of these faults vary from a few meters to >300 m. Examples of faults with large displacements are the Boundary fault, the Croxteth fault and the Eccleston West fault (Tellam, 1983; and Fig. 1a). In the Sherwood Sandstone in the north of England, there is a cor-relation between fault zone thickness and degree of displacement with some of the
20
greatest faults in the area likely have fault zones of >1 m thickness (e.g. Beach et al., 1997; Chadwick, 1997; Cowan, 1996; Rowe and Burley, 1997). These major faults (e.g. the Croxteth fault) have been implicated in controlling the occurrence of minor shallow petroleum accumulation to the north of the study area (Kent, 1948; Lees and Taitt, 1945) with the implication that the fault zones are effectively impermeable. The
25
faults that seem to cause the greatest geological complexity occur at the boundary between the Permo-Traissic and Carboniferous rocks (University of Birmingham, 1984; and Fig. 1a). Minor faults in the Quaternary deposits have been noted by Aitken (1871),
HESSD
2, 939–970, 2005 Groundwater com-partmentalisation E. A. Mohamed and R. H. Worden Title Page Abstract Introduction Conclusions References Tables Figures J I J I Back CloseFull Screen / Esc
Print Version Interactive Discussion
EGU
Reade (1884) and Taylor (1958). Such faults are syndepositional and have no signifi-cant effect on groundwater movement.
2.2. Topography
Although the area has generally low relief, the bedrock topography is locally charac-terised by narrow, linear lows (up to about 30 m above sea level) separated by hills that
5
reach up to about 70 m above sea level (Fig. 1b). These topographic features broadly run northwest to southeast. Travelling further north, the narrow depression opens out to become a wide plane in the northwest area around Formby, the flood plain of the River Alt, with 10 m maximum elevations above sea level.
2.3. Methods
10
In this study 2500 water table height records and 250 groundwater geochemical anal-yses collected from 70 groundwater wells (Fig. 1c) have been utilised for four one year periods. These water table height data and geochemical analyses were supplied from the Environmental Agency (EA). The EA staff and Nottingham EA laboratory followed standard sampling and analytical methods measuring the groundwater chemical
com-15
position including titration, ion chromatography, atomic absorption and ICP-techniques. We concluded that automated geostatistical methods, ideal for gridded data but not suited to the irregular location of sampling points in this study (Fig. 1c), would not be used for contouring water table elevation of water geochemistry data. Instead we have use manual contouring methods to draw maps of water table elevation and
groundwa-20
HESSD
2, 939–970, 2005 Groundwater com-partmentalisation E. A. Mohamed and R. H. Worden Title Page Abstract Introduction Conclusions References Tables Figures J I J I Back CloseFull Screen / Esc
Print Version Interactive Discussion
EGU
3. Results
3.1. Groundwater height variation in space and time
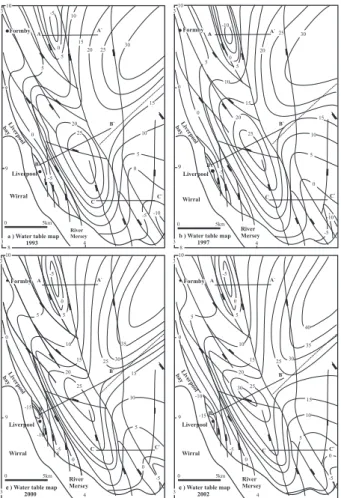
The water table height distribution maps from the years 1993, 1997, 2000 and 2002 have been drawn using available water table height data from monitoring boreholes. The water table varied from 30 m above OD to as much as 15 m below OD for the
5
years listed above. In the first instance we followed the assumptions implicit in the published regional hydrogeological map (that the aquifer was not subdivided by faults or folds into discrete compartments; Lewis et al., 1989) and freely contoured the water table across the entire area (Fig. 2). It is noteworthy that the water contours drawn in this way have a distinct, though imperfect, NNW-SSE lineation that accord to the main
10
fault pattern (Fig. 1a).
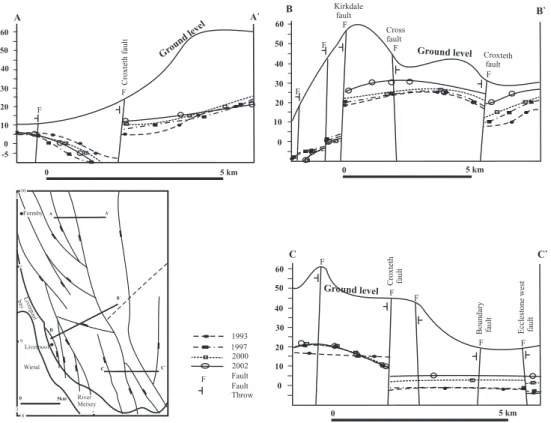
A number of schematic cross-sections representing topographic and groundwater elevation across some of the main faults in the study area were prepared to trace any effect of the faults on water table height across the fault lines (Fig. 3). These show that there are significant fluctuations of water table height across some of the faults (Fig. 3).
15
Schematic cross-sections illustrate the changes of water table height in passing from one side of a fault to another for the years 1993, 1997, 2000 and 2002. Cross-section A-A‘, which tracks across the Croxteth fault in the north, shows a very large change of the water table elevation across the main fault, where the small faults have no signif-icant effect on the water table height. Cross-section B-B‘ also traverses the Croxteth
20
fault, Litherland faults and other some small faults to the west (Fig. 3). This clearly illus-trates the dramatic change of water table height across the Croxteth and Kirkdale faults. Furthermore, cross-section A-A‘, and B-B‘ show that there is no simple relationship be-tween local topographic elevation and water table height. These observations of water table displacement across faults, especially those contrary to the topographic slope,
25
are best interpreted in terms of the faults representing low permeability zones in the aquifer that have limited the movement of groundwater. Cross-section D-D‘ traverses the Eccleston West, Boundary and Croxteth faults and other small faults in between
HESSD
2, 939–970, 2005 Groundwater com-partmentalisation E. A. Mohamed and R. H. Worden Title Page Abstract Introduction Conclusions References Tables Figures J I J I Back CloseFull Screen / Esc
Print Version Interactive Discussion
EGU
(Fig. 3). Although the water table heights follow the topographic elevations, there is a pronounced steep change of water table elevation across the fault lines implying the significant effect of faults on water table in these southern parts of the study area.
Following the analysis represented in Fig. 3, an alternative contouring scheme was used for water table height for the four years based on the assumptions that the
Crox-5
teth, Ecclestone West and linked Litherland-Kirkdale faults are all sealed to water movement. The Knowsley anticline will also act as a barrier to movement, effectively being a water table divide. On this modified basis the water table was tentatively re-contoured for the four years assuming the aquifer was compartmentalised by these geological structures (Fig. 4).
10
3.2. Groundwater geochemistry
All the groundwater geochemical data that were used in this study were assessed for charge balance using Geochemist Workbench. Groundwater analyses with a charge imbalance >5% were rejected from the data set.
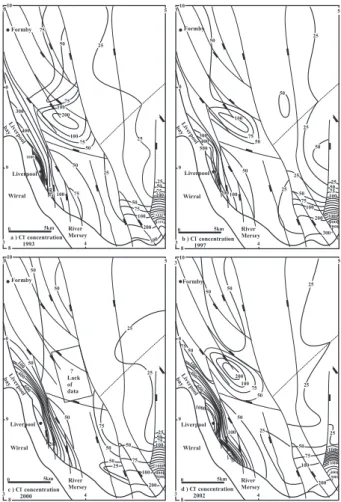
Distribution maps of the concentrations of aqueous chloride and sulphate (mg/l) from
15
the chosen four years 1993, 1997, 2000 and 2002 have been prepared (Figs. 5 and 6). These maps were contoured using the assumption that the Croxteth, Ecclestone West and linked Litherland-Kirkdale faults limited water movement and that the Knowsley anticline also acted as a barrier to movement (see Fig. 4 in contrast to Fig. 2).
As expected for groundwater in temperate climatic regions, chloride concentrations
20
are relatively low (<100 mg/l) for much of the area for most of the time (Fig. 5). However, there are notable exceptions. The coastal strip near where the Mersey channel is at its narrowest has chloride concentrations in excess of 1000 mg/l for some of the time and is elevated all of the time. Also the southeastern part of the aquifer has locally elevated chloride reaching up to 4000 mg/l. Also noteworthy is an area slightly to the
25
west of the centre of the area that has less dramatic chloride concentrations but is also locally elevated above background. The elevated groundwater salinity in some of the near-coastal regions is the result of seawater invasion of the aquifer. The details of
HESSD
2, 939–970, 2005 Groundwater com-partmentalisation E. A. Mohamed and R. H. Worden Title Page Abstract Introduction Conclusions References Tables Figures J I J I Back CloseFull Screen / Esc
Print Version Interactive Discussion
EGU
the geochemistry will be dealt with in a separate publication including the causes of the localised variation of aqueous geochemistry of the aquifer away from the coastline. Here we are most concerned with recognition of different groundwater geochemical families to assist in the appraisals of compartmentalisation rather than the details of geochemical processes in the aquifer.
5
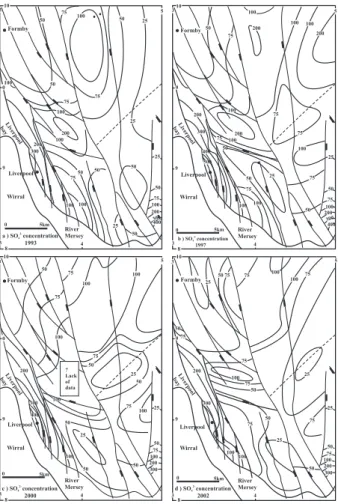
Maps of the dissolved sulphate concentrations have some similarities to the chloride maps although they are not exactly the same (Fig. 6). Sulphate is elevated in parts of the coastal strip and just to the west of the centre of the study area but it is also relatively concentrated at the northern edge of the area.
4. Discussion
10
4.1. Structural geology and water table heights
For the four years from which water table height contour maps have been prepared (Fig. 4) it is noteworthy that water table heights do not match topographic variations resulting in anomalously low and high water tables relative to the overlying land surface. The water table reaches maximum elevations in the north eastern part of the study area
15
(more than 30 m above sea level) and broadly tends to decrease toward the coastline and the Mersey estuary (Fig. 4). This reduction of the water table height towards the coast is not steady across the whole area. There are sudden changes in the water table height over very short distances. In the middle of northern area just west of the Croxteth fault where the water table drops from >5 m above sea level to as
20
much as 10 m below sea level (Figs. 1a and 4). Therefore, the Croxteth fault is a fairly well pronounced eastern margin of this part of the aquifer. To the middle of the block bounded to the east by the Croxteth fault, water table height does not follow the general reduction towards the coastline and instead rises to more than 30 m above sea level. This elevated groundwater table has a sharp western margin marked by the Kirkdale
25
HESSD
2, 939–970, 2005 Groundwater com-partmentalisation E. A. Mohamed and R. H. Worden Title Page Abstract Introduction Conclusions References Tables Figures J I J I Back CloseFull Screen / Esc
Print Version Interactive Discussion
EGU
Mersey estuary (Figs. 1a and 4). To the east of Croxteth fault, the water table elevation follows the Knowsley anticline structure (Fig. 1a). The fold axis can be recognized as a groundwater divide where the water table falls away from the fold axis. In conclusion, the water table in this part of the aquifer (east of Croxteth fault) is to a fairly large extent unrelated to the regime in the west of this fault. The block to the east of the Croxteth
5
fault can be separated by the anticline axis into northern and southern parts. In the southern part, to the east of the Eccleston west fault a very sharp and dramatic drop of water table height occurs ultimately falling to below sea level (Fig. 1a and 4). In general, the variations in the water table contours seem to be controlled by the regional fault and fold lines.
10
The previous discussion shows that at least some of the faults that dissect the re-gional Permo-Triassic aquifer and represented on the geological map (Fig. 1a) could be low permeability zones that have limited the movement of groundwater. Faults with the greatest displacement, those that have controlled the outcrop pattern most extensively, have probably got the lowest permeability values (Moor, 1902; Tellam, 1983) and so
15
will have had greatest effect on groundwater movement. On the basis of fault distribu-tion patterns and water table elevadistribu-tions, the aquifer could be subdivided into several hydrogeological sub-basins with boundaries defined largely by faults. However, the subtle regional fold (Fig. 1a) may also influence groundwater movement patterns with groundwater flow being away from the antiform axis. These sub-basins (Fig. 7) are thus
20
defined by the fold axis and the most significant faults (those that have affected water table elevation most extensively and those with the most significant impacts on geolog-ical outcrop patterns. Hydrogeologgeolog-ical sub-basin 1 (B1) occupies the area to the north of the Knowsley anticline and is bounded by Croxteth fault in the west. Sub-basin B2 lies to the south of the Knowsley anticline and is limited in the west by the southern
ex-25
tension of the Croxteth fault. Sub-basin B3 lies to the east of the Eccleston west fault. Sub-basin B4 lies between the Croxteth fault to the east and the Litherland-Kirkdale faults to the west. Sub-basin B5 has its eastern margin defined by the linked Litherland and Kirkdale faults. At this stage, the interpretation is somewhat tentative being based
HESSD
2, 939–970, 2005 Groundwater com-partmentalisation E. A. Mohamed and R. H. Worden Title Page Abstract Introduction Conclusions References Tables Figures J I J I Back CloseFull Screen / Esc
Print Version Interactive Discussion
EGU
solely on water table elevations in relation to topography and fault patterns, structural geology (faults and fold) and outcrop patterns. Independent geochemical data will now be employed to help ascertain the validity of the interpretation of compartmentalisation.
4.2. Sub-basin definition and groundwater geochemistry
The previous analysis included no water sample-based evidence of
compartmentali-5
sation of the aquifer into discrete sub-basins. Geochemical data should be capable of assessing the plausibility of the tentatively assigned sub-basins.
Chloride distribution maps for the four years (Fig. 5) reveal that the areas of very high chloride concentration (those >1000 mg/l) predominantly lie very close to the Mersey Estuary or the open sea. In the western part, the contours of chloride concentration
10
run approximately NNW-SSE and are parallel to, and bounded to the east by, the linked Litherland and Kirkdale faults. This seems to broadly concur with the definition of sub-basin B5 (Fig. 7). However, the very highest chloride concentrations in this area are constrained to an area west of a small fault near to the coast. This is also the area that has some of the lowest water table elevations (up to 15 m below sea level). This
15
area is conceivably a separate sub-basin (B6) and is likely to be defined by the fault that runs west of, and subparallel to, the linked Litherland and Kirkdale faults. In the extreme southeast of the area (near Widnes), the elevated chloride concentrations in the groundwater (locally >4000 mg/l) seem to be sharply defined. This represents the B3 sub-basin. It is possible that the locally elevated chloride concentrations are
20
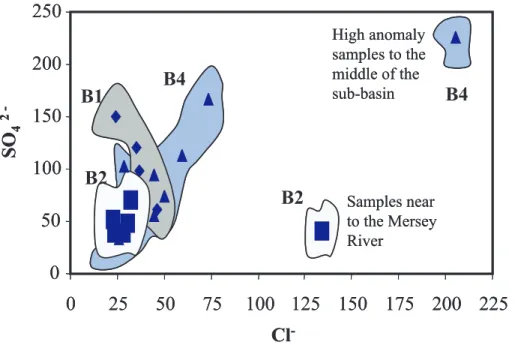
limited to the west by the Ecclestone West fault and Boundary fault (Figs. 5 and 7). Away from the coast, there are some locally elevated chloride concentration values not easily correlated with the values in neighbouring areas. In sub-basin B4 there is an area with chloride concentrations >200 mg/l that is anomalous with respect to the remainder of the sub-basin. The Croxteth fault seems to define differences in chloride
25
concentration between the tentatively assigned sub-basins B1, B2 and B4, where the Litherland-Kirkdale faults define the differences in chloride concentration between the tentatively assigned sub-basins B5 and B4.
HESSD
2, 939–970, 2005 Groundwater com-partmentalisation E. A. Mohamed and R. H. Worden Title Page Abstract Introduction Conclusions References Tables Figures J I J I Back CloseFull Screen / Esc
Print Version Interactive Discussion
EGU
The sulphate concentration contour maps have some similarities with chloride con-centration contour maps (Figs. 5 and 6). As for chloride, one of the areas with the highest sulphate concentrations lie close to the Mersey River bounded by the linked Litherland and Kirkdale faults although sulphate concentrations >300 mg/l only occur very close to the coast supporting the existence of a separate sub-basin in B5, here
5
defined by B6 using the water geochemistry data (Figs. 5 and 6). Based on the sul-phate as well as the chloride concentration data, in the extreme southeast of the area, a sub-basin B3 defined to the west by the Eccleston West fault and Boundary fault. To the middle of B4 is an area of anomalously high sulphate concentration (>200 mg/l; Fig. 6). In the north of the study area, to the east of the Croxteth fault the sulphate
con-10
centration locally rises to >200 mg/l while to the west of the Croxteth fault the sulphate concentration fall to <50 mg/l (Fig. 6). This seems to confirm that the Croxteth fault is an effective seal between discrete compartments (B1, B2 and B4). The chloride and sulphate concentration maps seem to support the Knowsley anticline as a feature that effectively separates sub-basins B1 and B2 (Figs. 5 and 6).
15
The maps of water geochemistry broadly support the notion of sub-basins although the initial sub-division of the area based on water table and the occurrence of structural geological features is not wholly confirmed. Initially assigned sub-basins B1to B5 seem to be broadly robust. An extra sub-basin to the western edge of B5 may be operative and has been labelled B6.
20
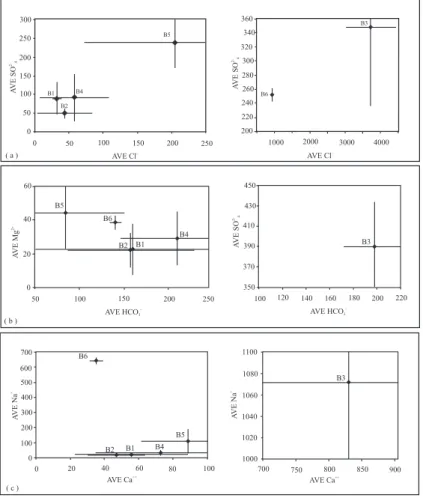
The compartmentalisation of the aquifer based on contoured maps of water table height (Fig. 4) and geochemistry (Figs. 5 and 6) can be further tested by examining individual and averaged geochemical characteristics of each of these newly defined aquifer compartments. These data have added to binary cross-plots (Figs. 8 and 9) and placed on a Piper diagram (Fig. 10). The average groundwater geochemical
pa-25
rameters from each sub-basin (Fig. 9) and the water geochemistry plotted on Piper diagram (Fig. 9) shed more light on the degree of compartmentalisation and fault seal-ing character. These figures indicate that the basins B3, B5, and B6 are completely isolated from each other and from the rest of the aquifer. Sub-basin B4 has a small
HESSD
2, 939–970, 2005 Groundwater com-partmentalisation E. A. Mohamed and R. H. Worden Title Page Abstract Introduction Conclusions References Tables Figures J I J I Back CloseFull Screen / Esc
Print Version Interactive Discussion
EGU
degree of overlap with B1 and B2 (Figs. 9a and 10) possibly suggesting that there is a limited water movement across the Croxteth fault although the notion that B4 is discrete from B1 and B2 is largely supported by the geochemical data. B4 has moder-ately elevated sulphate concentrations relative to B2 and modermoder-ately high magnesium concentration relative to B1 and B2 (Fig. 9). There is some degree of geochemical
5
overlap between groundwater samples from sub-basins B1 and B2 although there is a significant difference between the cross plotted data (Figs. 9 and 10) suggesting that the sub-basins could indeed be discrete. B1 has very low chloride and moderately low sulphate whereas B2 has moderately low chloride and very low sulphate.
5. Significance
10
Oil fields have been known to be divided into discrete fluid compartments for a number of years. The data typically used to assess the degree of compartmentalisation include fluid pressure data, fluid contact (e.g. oil-water) depths, oil geochemistry, gas geochem-istry, associated water geochemgeochem-istry, and the physical properties of petroleum (Smalley and England, 1992, 1994; Smalley et al., 1995). By analogy we have here used water
15
table height variations (equivalent to fluid pressure variations and fluid contact depths in oil fields) and water geochemistry data (equivalent to petroleum geochemistry data). This approach has proved to be very effective in determining the degree of compart-mentalisation in a near-surface aquifer. These data are typically available from aquifers in developed regions and the approach could be widely applied with only minor extra
20
expense.
The compartmentalisation in the Sherwood sandstone aquifer is primarily a result of the occurrence of a series of major faults that traverse the bedrock. The faults have vertical displacements of up to several hundred meters and probably have meter-thick zones composed of low permeability fault gouge and cataclasite resulting from
25
the ancient movements of the faults (Beach et al., 1997; Chadwick, 1997). Faults are commonly implicated in the lateral compartmentalisation of oil fields although vertical
HESSD
2, 939–970, 2005 Groundwater com-partmentalisation E. A. Mohamed and R. H. Worden Title Page Abstract Introduction Conclusions References Tables Figures J I J I Back CloseFull Screen / Esc
Print Version Interactive Discussion
EGU
compartmentalisation in oil fields can also be the result of stratification of permeable and impermeable sedimentary units, growth of diagenetically-cemented layers etc.
Why does the compartmentalisation of this coastal aquifer matter? The water table close to the coastline is, in some locations, 10 m below sea level (as a result of an-thropogenic activities). However, the landward movement of seawater in the aquifer
5
has been locally limited by faults. Where the faults are sub-parallel to the coastline the landward invasion is spatially restricted to the near-shore region of the aquifer. In stark contrast, where the faults are approximately perpendicular to the coastline, the landward invasion of seawater is more extensive since there is nothing preventing the advance into the coastal aquifer. Managing groundwater resources is done most
ef-10
fectively with knowledge of compartmentalisation and its controls. These would enable prediction of groundwater movements. Adopting the notion that the aquifer is merely a “tank of sand” (as is implicit in the regional hydrogeological map; Lewis et al., 1989) would lead to a whole host of errors in predicting occurrence and extent of saline intru-sion.
15
The region in question has relatively high ground to the east where the Sherwood sandstone sub-crop could potentially be a site of active recharge to the entire aquifer. The existence of groundwater compartments due to NNW-SSE oriented sealing faults suggests that this scenario is perhaps unlikely. The NNW-SSE sealing faults will restrict E-W recharge. Recharge of the aquifer is thus most likely via vertical percolation of
20
rainfall. This is supported by the occurrence of a water table high in the SW of the area (under a local topographic high) and a long way from the relatively high ground in the east.
One of the practical implications for the occurrence of compartmentalisation is that any lateral spread of contaminants due to poor environmental protection will be
spa-25
tially restricted to the local compartment. Point-source pollution is unlikely to spread to the entire aquifer.
HESSD
2, 939–970, 2005 Groundwater com-partmentalisation E. A. Mohamed and R. H. Worden Title Page Abstract Introduction Conclusions References Tables Figures J I J I Back CloseFull Screen / Esc
Print Version Interactive Discussion
EGU
6. Conclusions
1. Analysis of water table height variations and groundwater geochemistry reveals different sub-basins, or compartments, within the Triassic Sherwood Sandstone aquifer in the Liverpool area in the UK.
2. NNW-SSE oriented geological faults, with vertical displacements of up to 300 m,
5
traverse the Triassic and represent the vertical margins of discrete compartments within the aquifer.
3. The combination of fluid pressure gradients (as represented by water table height), water geochemistry data and an appreciation of the dominant geological structures in an aquifer (e.g. major faults) proved effective in defining the degree
10
of compartmentalisation in the aquifer.
4. Lateral influx of seawater is limited by the occurrence of hydrodynamically sealing faults running sub-parallel to the coastline in the west of the aquifer. These faults are perpendicular to the coastline in the south of the aquifer and have permitted more extensive landward invasion of seawater.
15
5. Geochemical data show that mixing of groundwater between different compart-ments is limited by NNW-SSE trending faults. This reveals that lateral recharge of the aquifer from higher ground in the east will be limited. Recharge must be by vertical percolation thus spatially limiting the extent of any groundwater contami-nation by anthropogenic activities.
20
Acknowledgements. The work was funded through a PhD award from the Egyptian Education
and Cultural bureau, London. The Department of Earth and Ocean Sciences at the University of Liverpool is duly acknowledged. The authors would like to thank the Environmental Agency staff J. Ingram and D. Billington for supplying us with the data set used in this study.
HESSD
2, 939–970, 2005 Groundwater com-partmentalisation E. A. Mohamed and R. H. Worden Title Page Abstract Introduction Conclusions References Tables Figures J I J I Back CloseFull Screen / Esc
Print Version Interactive Discussion
EGU
References
Aitken, J.: On faults in drift at Stockport, Cheshire, Transactions of the Manchester, Geological Society, 10, 46–49, 1871.
Beach, A., Brown, J. J., Welbon, A. L., McCallum, J. E., Brockbank, P., and Knott, S.: Char-acteristics of fault zones in sandstones from NW England: application to transmissibility, in:
5
Petroleum geology of the Irish Sea and adjacent areas, edited by: Meadows, N. S., True-blood, S. P., Hardman, M., and Cowan, G., Special Publication of the Geological Society, 124, 315–324, 1997.
Chadwick, R. A.: Fault analysis of the Cheshire Basin, NW England, in: Petroleum geology of the Irish Sea and adjacent areas, edited by: Meadows, N. S., Trueblood, S. P., Hardman, M.,
10
and Cowan, G., Special Publication of the Geological Society, 124, 297–313, 1997.
Cowan, G.: The development of the North Morecambe gas field, East Irish Sea, UK. Petroleum Geoscience, 2, 43–52, 1996.
Hull, E.: The geology of the country around Prescot, Lancashire, 3rd Ed. Mem. Geol. Surv. Gt. Brit., 1882.
15
Jones, R. C. B., Tonks, L. H., and Wright, W. B.: Wigan District. Mem. Geol. Surv. Gt. Brit., 1938.
Kent, P. E.: A deep borehole at Formby, Lancashire, Geological Magazine, 85, 22–35, 1948. Land, D. R.: Hydrogeology of the southern part of the northwest region, Geol. Surv. on file
report, 1964.
20
Lees, G. and Taitt A. H.: The geological results of the search for oilfields in Great Britain, Quarterly Journal of the Geological Society, 101, 255–317, 1945.
Lewis, M. A., Doorgakant, P., Lawrence, A. M., Monkhous, R. A., (section Leader), with the assistance of Riden, J. of Welsh Water and Eggboro, M. D., and other staff of North West Water: Hydrogeological map of Clwyd and the Cheshire basin, British Geological Survey,
25
1989.
Morton, G. H.: On the position of the wells for the supply of water in the neighbourhood, Proceedings of the Liverpool Geological Society, 8, 241–267, 1866.
Moore, C. C.: A study of the volume composition of rocks and its importance to the geologist, Proceedings of the Liverpool Geological Society, 9, 129–162, 1902.
30
Oude Essink, G. H. P.: Improving fresh groundwater supply-problems and solutions, Ocean & Coastal Management, 44, 429–449, 2001.
HESSD
2, 939–970, 2005 Groundwater com-partmentalisation E. A. Mohamed and R. H. Worden Title Page Abstract Introduction Conclusions References Tables Figures J I J I Back CloseFull Screen / Esc
Print Version Interactive Discussion
EGU
Reade, T. M.: A section of the Trias at Vyrnwy Street Everton displaying evidence of lateral pressure, Proceedings of the Liverpool Geological Society, 5, 158–159, 1884.
Reilly, T. E. and Pollock, D. W.: Factors affecting areas controlling recharge to wells in shallow aquifers, U.S. Geological Survey Water Supply, Paper 2412, 1993.
Rowe, J. and Burley, S. D.: Faulting and porosity modification in the Sherwood Sandstone at
5
Alderley Edge, northeastern Cheshire: an exhumed example of fault-related diagenesis, in: Petroleum geology of the Irish Sea and adjacent areas, edited by: Meadows, N.S., Trueblood, S.P., Hardman, M., and Cowan, Special Publication of the Geological Society, 124, 315–324, 1997.
Shackleton, R. M.: Geology in a scientific study of Merseyside, published for Brit. Assoc. by
10
Uni. Press of Liverpool, edited by: Smith, W., 1953.
Smalley, P. C. and England, W. A.: Assessing reservoir compartmentalization during field ap-praisal: how geochemistry can help, SPE 25005, 1992.
Smalley, P. C. and England, W. A.: Reservoir compartmentalization assessed with fluid com-positional data, SPE Reservoir Engineering, August 1994, 175–180, 1994.
15
Smalley, P. C., Dodd, T. A., Stockden, I. L., Raheim, A., and Mearns, E. W.: Compositional het-erogeneities in oilfield formation water: identifying them, using them, in: The geochemistry of reservoirs, edited by: Cubbitt, J. M. and England, W.A., Special Publication of the Geological Society, 86, 59–69, 1995.
Stephenson, R.: Report on the supply of water to the town of Liverpool. Report to the Water
20
Committee of Liverpool Town Council, 1850.
Taylor, B. J.: Report on underground water resources: the Permo-Triassic area of south Lan-cashire, Unpub. Rep., Geol. Surv. Manchr. Office, 1957.
Taylor, B. J.: Cemented shear-planes in the Pleistocene middle sands of Lancashire and Cheshire, Proceeding of the Yorkshire Geological Society, 31, 359–365, 1958.
25
Tellam, J. H.: Hydrochemical studies of the Lower Mersey basin Permo-Triassic sandstone aquifer system. PhD Thesis, Birmingham University, 1983.
Tellam, J. H.: The groundwater chemistry of the Lower Mersey Basin Permo-Triassic sandstone aquifer system, UK: 1980 and Pre-industrializtion-urbanisation, J. Hydrol, 161, 287–325, 1994.
30
Tellam, J. H., Lloyd, J. W., and Walters, M.: The morphology of a saline groundwater body: its investigation, description and possible explanation, J. Hydrol., 83, 1–21, 1986.
HESSD
2, 939–970, 2005 Groundwater com-partmentalisation E. A. Mohamed and R. H. Worden Title Page Abstract Introduction Conclusions References Tables Figures J I J I Back CloseFull Screen / Esc
Print Version Interactive Discussion
EGU
North West Water Authority by the University of Birmingham, Summary report, 1981. University of Birmingham: North Mersey Basin Saline Groundwater Study, final report to the
North West Water Authority by the University of Birmingham, Summary report, 1984. Wedd, G. B., Smith, B., Simmons, W. C., and Wary, D. A.: The geology of Liverpool, Mem.
Geol. Surv. Eng. and Wales, 1923.
HESSD
2, 939–970, 2005 Groundwater com-partmentalisation E. A. Mohamed and R. H. Worden Title Page Abstract Introduction Conclusions References Tables Figures J I J I Back CloseFull Screen / Esc
Print Version Interactive Discussion
EGU Table 1. Regional stratigraphy of the bedrock underlying Liverpool and Greater Merseyside.
Adapted from University of Birmingham (1984) and Tellam (1994).
System Stage Lithostratigraphical Division Previous
Division
Thickness m
Hydrogeological characters
Quaternary Flandrian SoilAlluvium
Terrace deposits (sands and gravels) Shirdley Hill Sand Formation (blown sand)
>1−35 Aquiclude
Devensian Stockport Formation (till with glacial
sands)
10–50 Aquiclude
Triassic
Anisian Mersey Mudstone unit Keuper Marl 405 Aquiclude
Mudstone Tarporley Siltstone Fm Keuperterstone Wa- 30–60 Aquiclude
Group
Scythian Sherwood
Sandstone Group
Ormskirk Sandstone Fm Keuper
Sand-stone
181–295 Aquifer
Wilmslow Sandstone Fm U. Mottled
Sandstone
205–480 Aquifer
Chester Pebble Beds Fm. Pebble Beds Unit
Bunter Pebble Beds
316–375 Aquifer
L. Mottled Sandstone Unit L. Mottled
Sandstone
0–>80 Aquifer
Permian Upper Bold Fm/Manchester MarlFm ManchesterMarl 10–225 Mixedaquiclude
aquifer-Lower Collyhurst Sandstone Fm Collyhurst
Sandstone
283–720 Aquifer
HESSD
2, 939–970, 2005 Groundwater com-partmentalisation E. A. Mohamed and R. H. Worden Title Page Abstract Introduction Conclusions References Tables Figures J I J I Back CloseFull Screen / Esc
Print Version Interactive Discussion EGU 3 0 5km River Mersey Liverpool Bay 4 Wirral ( )b 30 405060 60 50 40 70 60 50 40 40 60 70 80 70 70 40 30 20 50 50 60 40 70 10 5 20 10 40 30 3 Formby 8 3 Liverpool 9 0 60 10 0 5km 4 9 River Mersey N 8 0 10 5 ( c ). Wirrel Formby Sampled wells locations 3 Sherwood Sandstone Ormskirk Sandstone Fm Wilmslow Fm Chester Pebble Fm Triassic Manchester Marl Fm Collyhurst Fm Permian Carboniferous Fault line Fold Dip Mercia Mudstone The study area 0 100km
Permian & Triassic Sandstones 0 5km 0 Cr oxteth fault Ecclestone fault Cross fault Cr osby fault Kirkdale fau lt River Mersey Liverpool Liverpool Bay 4 Ince Blundell fault Tubr ook fault ( a ). Wirral Boundary fault Litherland fault Formby Hillhouse fault 8 310 5 Knowsley Anticline 3
Fig. 1. Maps of hydrogeologically important aspects of the area around Liverpool: (a)
Geolog-ical map of major rocks units and main faults,(b) topographic contour maps, (c) distribution of
HESSD
2, 939–970, 2005 Groundwater com-partmentalisation E. A. Mohamed and R. H. Worden Title Page Abstract Introduction Conclusions References Tables Figures J I J I Back CloseFull Screen / Esc
Print Version Interactive Discussion EGU 5 20 0 9
a ) Water table map 1993 . 0 5km River Mersey 0 15 10 25 30 15 10 5 20 25 0 -5 -10 0 10 3 0 4 8 3 Wirral Liverpool Liverpool bay A A` B B` C C` Formby 5 -5 -5 4 9 0 5km River Mersey Wirral -5 0 5 10 15 20 25 30 -10 -10 -5 0 5 10 15 20 25 10 3 0 8 3 Liverpool Liverpool bay A A` B B` C C` Formby
b ) Water table map 1997 . 5 0 -10 0 5km Wirral 0 5 10 15 0 -5 -15 20 25 25 15 10 5 30 35 10 3 0 4 8 3 Formby Liverpool 9 Liverpool bay A A` B B` C C`
c ) Water table map 2002 . c. RiverMersey 5 0 -5 -10 -5 40 30 0 5km Wirral 0 5 10 15 0 -5 -15 20 25 25 15 10 5 30 35 10 3 0 4 8 3 Formby Liverpool 9 Liverpool bay A A` B B` C C`
c ) Water table map 2000 . c. RiverMersey 5 0 -5 -10 -5
Fig. 2. Water table height relative to the ordinance datum (OD, mean annual sea level); (a)
1993,(b) 1997, (c) 2000 and (d) 2002. Contouring was based on the assumption employed
during the drafting of the published hydrogeological map (Lewis et al., 1989) that the aquifer was a uniform entity with no sub-compartments.
HESSD
2, 939–970, 2005 Groundwater com-partmentalisation E. A. Mohamed and R. H. Worden Title Page Abstract Introduction Conclusions References Tables Figures J I J I Back CloseFull Screen / Esc
Print Version Interactive Discussion EGU 10 3 0 4 8 3 River Mersey Wirral Formby Liverpool 9 Liverp ool bay 0 A A` B B` C C` 0 5km -50 10 20 30 40 50 60 A A` F F 0 5 km 1993 1997 2000 2002 F Fault Fault Throw Ground level Croxteth fault 0 10 20 30 40 50 60 B` B F F F F F Ground level 0 5 km Cross fault Kirkdale fault Croxteth fault 0 10 20 30 40 50 60 C` C F F F F F Ground level 0 5 km Ecclestone west fault Croxteth fault Boundary fault
Fig. 3. Schematic cross sections illustrated the variation of the water table height across the
HESSD
2, 939–970, 2005 Groundwater com-partmentalisation E. A. Mohamed and R. H. Worden Title Page Abstract Introduction Conclusions References Tables Figures J I J I Back CloseFull Screen / Esc
Print Version Interactive Discussion EGU 5 0 15 0 -5 -10 -5 0 -5 5 0 4 8 3 River Mersey Wirral 0 Formby 9 Liverpool bay
b ) Water table map 1997 . 35 5 10 -10 10 15 10 3 5 5 -10 -5 0 10 15 20 5 10 15 25 30 25 20 20 25 20 15 10 5 0 Liverpool 0 5km 5 0 10 25 30 25 10 5 0 -5 5 10 15 20 25 0 -5 5 10 3 0 4 8 3 River Mersey Wirral 0 Formby Liverpool 9 Liverpool bay
d ) Water table map 2002 . 40 35 -5 10 15 20 5 -10 20 15 0 5 30 -15 15 15 20 20 10 0 0 5km 5 0 10 25 30 10 5 0 -5 0 5 10 15 20 25 0 -5 5 10 3 0 4 8 3 River Mersey Wirral 0 Formby Liverpool 9 Liverpool bay
c ) Water table map 2000 . 40 35 -5 10 15 20 5 10 -10 20 15 0 15 5 15 20 25 0 5km 5 50 -5 5 10 15 20 25 30 0 5 0 -5 -10 -5 0 5 10 15 20 25 0 -5 5 10 3 0 4 River Mersey Wi rral 0 Formby Liverpool 9 Liverpool bay 35
a ) Water table map 1993 . 10 5 15 20 20 15 10 -5 -10 3 0 5km Fold Fault Contour lines 8
Fig. 4. Water table height relative to the ordinance datum (OD, mean annual sea level); (a)
1993,(b) 1997, (c) 2000 and (d) 2002. The maps were prepared using the same data as Fig. 2
but, in contrast to Lewis et al. (1989), contouring was based on the assumption that the aquifer is compartmentalised by the Croxteth, Litherland-Kirkdale and Ecclestone West faults and the Knowsley anticline (see Fig. 3).
HESSD
2, 939–970, 2005 Groundwater com-partmentalisation E. A. Mohamed and R. H. Worden Title Page Abstract Introduction Conclusions References Tables Figures J I J I Back CloseFull Screen / Esc
Print Version Interactive Discussion EGU 5 10 3 4 8 3 River Mersey Wirral Formby Liverpool 9 Liverpool bay 50 200 50 75 100 4000 1000 25 25 5000 25 200 75 50 100 50 400 600 25 50 50 ? Lack of data 50 75 100 5 10 3 0 4 8 3 River Mersey Wirral Formby Liverpool 9 Liverpo ol bay 50 25 100 75 50 50 25 100 200 300 400 50 75 100 200 300 4000 1000 25 50 5000 50 500 25 50 75 100 25 5 10 3 4 8 3 River Mersey Wirral Formby Liverpool 9 Liverpo ol bay 50 25 50 50 75 100 4000 1000 100 25 5000 50 100 50 400 600 25 200 100 1000 1000 50 75 100 200 25 50 0 d ) Cl concentration 2002 -. 0 5km b ) Cl concentration 1997 -. 0 5km c ) Cl concentration 2000 -. 0 5km 5 10 3 0 4 8 3 River Mersey Wirral Formby Liverpool 9 Liverpool bay 75 50 25 75 100 200 100 75 50 50 75 25 100 200 1000 300 400 50 75 100 200 300 4000 1000 25 50 75 100 25 a ) Cl concentration 1993 -. 0 5km 0 75
Fig. 5. Aqueous chloride concentrations contoured for; (a) 1993, (b) 1997, (c) 2000, (d) 2002.
Contouring of chloride concentration was based on the assumption that the aquifer is compart-mentalised by the Croxteth, Litherland-Kirkdale and Ecclestone West faults and the Knowsley anticline (see Fig. 4).
HESSD
2, 939–970, 2005 Groundwater com-partmentalisation E. A. Mohamed and R. H. Worden Title Page Abstract Introduction Conclusions References Tables Figures J I J I Back CloseFull Screen / Esc
Print Version Interactive Discussion EGU 5 10 3 0 4 8 3 River Mersey Wirral Formby Liverpool 9 Liverpool bay 50 25 50 75 100 200 300 400 100 100 200 100200 100 100 200 100 100 200 75 75 100 75 75 75 50 50 75 300 400 500 50 25 b concentration 1997 ) SO4 2-. 0 5km 5 10 3 0 4 8 3 River Mersey Wirral Formby Liverpool 9 Liverpool bay a) SO42-concentration 1993 . 50 100 50 25 25 25 50 50 75 100 200 300 400 25 50 50 75 100 100 200 300 100200 100 75 50 75 75 50 100 0 5km 5 10 3 0 4 8 3 River Mersey Wirral Formby Liverpool 9 Liverpo ol bay 50 25 50 75 100 200 300 100 100 100 100 75 75 50 75 100 50 25 50 50 75 100 400 300 200 25 50 ? Lack of data 0 5km c ) S concentration 2000 O4 2-. 5 10 3 0 4 8 3 River Mersey Wirral Formby Liverpool 9 Liverpool bay 25 50 75 100 200 300 100 75 50 300 200 25 50 100 100 75 75 25 75 50 100 75 75 75 50 25 75 50 100 0 5km d) SOconcentration 2002 4 2-.
Fig. 6. Aqueous sulphate concentrations contoured; (a) 1993, (b) 1997, (c) 2000, (d) 2002.
Contouring of chloride concentration was based on the assumption that the aquifer is compart-mentalised by the Croxteth, Litherland-Kirkdale and Ecclestone West faults and the Knowsley anticline (see Fig. 4).
HESSD
2, 939–970, 2005 Groundwater com-partmentalisation E. A. Mohamed and R. H. Worden Title Page Abstract Introduction Conclusions References Tables Figures J I J I Back CloseFull Screen / Esc
Print Version Interactive Discussion EGU Liverpool Wirral River Mersey Liverpool bay 4 9 0 Boundary fault 0 5km Ecclestone fault Cross fault Kirkdale fault Knowsley Anticline Croxteth fault Litherland fault B2 B1 B3 B4 B5 B6 Formby 8 3 5 3 10
Fig. 7. The suggested division of hydrogeological sub-basins based on water table height and
HESSD
2, 939–970, 2005 Groundwater com-partmentalisation E. A. Mohamed and R. H. Worden Title Page Abstract Introduction Conclusions References Tables Figures J I J I Back CloseFull Screen / Esc
Print Version Interactive Discussion EGU
B1
0
50
100
150
200
250
0
25
50
75 100 125 150 175 200 225
B4
Cl
-SO
42-B2
B2
Samples near to the Mersey River High anomaly samples to the middle of the sub-basin0
50
100
150
200
250
0
25
50
75 100 125 150 175 200 225
B4
Cl
-SO
4 2-Samples near to the Mersey River High anomaly samples to the middle of the sub-basinFig. 8. The cross plots of concentrations of sulphate versus chloride for the B1, B2 and B4
HESSD
2, 939–970, 2005 Groundwater com-partmentalisation E. A. Mohamed and R. H. Worden Title Page Abstract Introduction Conclusions References Tables Figures J I J I Back CloseFull Screen / Esc
Print Version Interactive Discussion EGU 300 250 200 150 100 50 0 0 50 100 150 200 250 B1 B2 B4 B5 360 340 320 300 280 260 240 220 200 1000 2000 3000 4000 B6 B3 AV E SO 2-4 AVE Cl -AV E SO 2- 4 AVE Cl -60 40 20 0 50 100 150 200 250 B5 B6 B2 B1 B4 430 450 410 390 370 350 100 120 140 160 180 200 220 B3 AV E SO 2- 4 AV E M g 2+ AVE HCO3 - AVE HCO 3 -700 600 500 400 300 200 100 0 0 20 40 60 80 100 B6 B2 B1 B4 B5 1100 1080 1060 1040 1020 1000 700 750 800 850 900 AV E N a + AVE Ca++ AV E N a + AVE Ca++ B3 ( a ). ( b ). ( c ).
Fig. 9. Geochemical cross-plots; (a) average chloride concentrations vs. average sulphate
con-centrations(b) average magnesium concentrations vs. average bicarbonate concentrations, (c)
HESSD
2, 939–970, 2005 Groundwater com-partmentalisation E. A. Mohamed and R. H. Worden Title Page Abstract Introduction Conclusions References Tables Figures J I J I Back CloseFull Screen / Esc
Print Version Interactive Discussion EGU Mg2+ Ca2+ K +Na+ + Ca2+ Mg2+ K+ Na+ + 50 K /Na type + + Mg2+ type 50 50 50 SO2– 4type 50 50 10 10 90 HCO ,Cl + SO - 2-3 4 HCO -3 Na+ /K+, Ca + 2+ + Mg 2 Ca+ ,Na /K 2+ + + + Mg 2 Ca + 2+ + Mg 2 Na /K + + Cl +SO ,HCO - 2 -4 3 Cl +S-O 2-4 90 50 50 Cl+S O -2- 4 SO 2-4 Cl -HCO -3
Ca type2+ HCO type3
-Cl type -B4 B5 B5 west=B6 B3 B2 B1
Fig. 10. The average groundwater geochemical compositions from the hydrogeological