HAL Id: hal-00298655
https://hal.archives-ouvertes.fr/hal-00298655
Submitted on 9 Jun 2005HAL is a multi-disciplinary open access
archive for the deposit and dissemination of sci-entific research documents, whether they are pub-lished or not. The documents may come from teaching and research institutions in France or abroad, or from public or private research centers.
L’archive ouverte pluridisciplinaire HAL, est destinée au dépôt et à la diffusion de documents scientifiques de niveau recherche, publiés ou non, émanant des établissements d’enseignement et de recherche français ou étrangers, des laboratoires publics ou privés.
Satellite data interpretation of causes and controls on
groundwater-seawater flow directions, Merseyside, UK:
implications for assessing saline intrusions
S. Mukherjee, E. A. Mohammad, R. H. Worden
To cite this version:
S. Mukherjee, E. A. Mohammad, R. H. Worden. Satellite data interpretation of causes and controls on groundwater-seawater flow directions, Merseyside, UK: implications for assessing saline intrusions. Hydrology and Earth System Sciences Discussions, European Geosciences Union, 2005, 2 (3), pp.887-916. �hal-00298655�
HESSD
2, 887–916, 2005
Satellite data interpretation of causes and controls
S. Mukherjee et al. Title Page Abstract Introduction Conclusions References Tables Figures J I J I Back Close
Full Screen / Esc
Print Version Interactive Discussion
EGU
Hydrol. Earth Sys. Sci. Discuss., 2, 887–916, 2005 www.copernicus.org/EGU/hess/hessd/2/887/ SRef-ID: 1812-2116/hessd/2005-2-887 European Geosciences Union
Hydrology and Earth System Sciences Discussions
Papers published in Hydrology and Earth System Sciences Discussions are under open-access review for the journal Hydrology and Earth System Sciences
Satellite data interpretation of causes and
controls on groundwater-seawater flow
directions, Merseyside, UK: implications
for assessing saline intrusions
S. Mukherjee, E. A. Mohammad, and R. H. Worden
University of Liverpool, Department of Earth & Ocean Sciences, 4, Brown Low Street, Liverpool L69 3GP, UK
Received: 23 March 2005 – Accepted: 18 May 2005 – Published: 9 June 2005 Correspondence to: S. Mukherjee ([email protected])
HESSD
2, 887–916, 2005
Satellite data interpretation of causes and controls
S. Mukherjee et al. Title Page Abstract Introduction Conclusions References Tables Figures J I J I Back Close
Full Screen / Esc
Print Version Interactive Discussion
EGU
Abstract
Groundwater in the Triassic Sherwood Sandstone aquifer, Liverpool, UK, has locally elevated chloride concentrations (∼4000 mg/l) in parts of the coastal region although there is freshwater right up to the coast line in other areas. The aquifer is cut my numerous faults with vertical displacements of as much 300 m. SPOT satellite data
5
have been used for the Merseyside area of Liverpool. The satellite data revealed and confirmed the location of some of the main faults since the fault zones of the aquifer have low permeability (due to grain crushing, cataclasis, and clay smearing). Where fault zones outcrop at the surface, below the well-developed regolith, there is locally elevated soil water and thus anomalous vegetation patterns in comparison to unfaulted
10
and highly porous aquifer. The ability to identify fault zones by this satellite-based method strongly suggests that they are at least partially sealing, sub-vertical features in the aquifer. Digitally enhanced and processed satellite data were used to define the relative proportions of sand and clay in the near-coastal (inter-tidal) part of the Mersey estuary. Sand-dominated sediment has higher pixel values in comparison with
15
clay deposits in the near infrared spectral region (NIR). Where open and weathered fault rocks crop out at the surface near the intertidal zone, water movement in these potential surface water conduits is limited where the intertidal zone is clay-dominated since clay will plug the conduit. Where these weathered and open fault-rocks crop out against sand-dominated parts of the coastline, fresh water outflux into the seawater
20
has been imaged using the satellite data. Furthermore, the high and low chloride concentration parts of the aquifer are separated by major, sub-vertical fault zones and have allowed a very steep water table gradient to remain in the aquifer.
1. Introduction
The River Mersey in the UK originates at the confluence of the River Tame and the
25
HESSD
2, 887–916, 2005
Satellite data interpretation of causes and controls
S. Mukherjee et al. Title Page Abstract Introduction Conclusions References Tables Figures J I J I Back Close
Full Screen / Esc
Print Version Interactive Discussion
EGU
Liverpool, passing through south Manchester towards Warrington. The river becomes tidal at Howley Weir where the upper estuary starts. It widens to form the inner estuary at Runcorn. The Mersey estuary continues through The Narrows which is a straight channel between urban Liverpool and Birkenhead (Fig. 1). This strongly tidal channel has its location controlled by variations in outcrop geology and has a depth of up to 30 m
5
(Carter, 1988; Environment Agency, 1999). Where this channel flows into Liverpool Bay in the Irish Sea it forms the outer estuary, which is a large area of inter-tidal sand and mud banks. The Mersey is a strongly tidal river and estuary having the second highest tidal range in the UK (∼10 m). These strong tides have created deep channels and sandbanks throughout the Mersey estuary. The conurbation of Liverpool sits on
10
the Triassic Sherwood Sandstone aquifer directly adjacent to the northern and eastern edges of the Mersey estuary.
With the opening of Liverpool’s first commercial dock in 1715, the Mersey catchment became a prime location for industrial expansion. The advent of mechanised spin-ning and weaving induced the siting of new mills along watercourses within the region.
15
Associated with the textile industry was an increase in the bleaching, dying, finishing trades as well as chemical works. Allied to the growth of these old industries was the growth of the paper, heavy chemical and glass industries, which are still in production to this day. All of these industries used the waterways as a means for the disposal of industrial waste. This has resulted in a legacy of pollutants within the River Mersey
20
(Greenwood, 1999). In addition, domestic waste produced by the expanding urban population was previously disposed of directly into the waterways resulting in gross pollution.
The quality of the River Mersey has improved since 1985 as a consequence of the Mersey Basin Campaign (http://www.merseybasin.org.uk/). Saline (marine) water is
25
currently the most common pollutant in the typically low salinity groundwater. Intrusion of seawater occurs where it displaces or mixes with freshwater in the aquifer. Seawater intrusion into the coastal aquifer has caught the attention of many hydrogeologists in the Mersey area for many years (e.g. Stephenson, 1850; Braithwaite, 1855; Hibbert,
HESSD
2, 887–916, 2005
Satellite data interpretation of causes and controls
S. Mukherjee et al. Title Page Abstract Introduction Conclusions References Tables Figures J I J I Back Close
Full Screen / Esc
Print Version Interactive Discussion
EGU
1954, 1956). A link between seawater invasion and falling water tables due to industrial and domestic exploitation has been suspected in Liverpool and neighbouring regions with same aquifer for many years (Howell, 1965; Bow et al., 1969; Crook and Howell, 1970, 1971, 1973). Memon (1975) modelled saline groundwater inflow problems in the Liverpool-Birkenhead area using a viscous flow analogue. Tellam and Lloyd (1986)
5
attempted to analyse the processes and consequences of seawater intrusion using geochemical methods while Tellam et al. (1986) described the morphology of the saline groundwater body in an area 20–30 km east of Liverpool.
The approach taken for the previous studies to detect the seawater intrusion was based mainly on groundwater geochemistry data. NMBSGS (1984) mathematically
10
studied the boundary conditions of the groundwater aquifer in the Liverpool area and presented a flow model from the sea to the aquifer and vice versa (Fig. 1). Integrated management of the Upper Mersey River basin using SMILE, an object oriented soft-ware system, was attempted but it failed to explain the distribution of strongly differing degrees of seawater intrusion (Spanou and Chen, 2002). It is difficult to identify the
15
specific location of the seawater intrusion through the fault zones (Fig. 2). In this study we have employed satellite data to assist in the study of coastal aquifers. Analysis of satellite data (SPOT data) is a new approach to help detect and understand seawa-ter intrusion locations in Merseyside. Satellite data have the potential to qualitatively and quantitatively infer groundwater and soil water geochemical and distribution
vari-20
ation (Mukherjee, 2004; Jaisawal et al., 2003). The attempt to identify the controls on seawater invasion of the Sherwood aquifer in Merseyside area demonstrates a new technique for hydrogeologists, but it can be used and replicated globally employing a similar approach.
2. Geological stratigraphy of the aquifer
25
Groundwater in the Sherwood Sandstone Group fine to coarse-grained sandstone has played an important role in the development of Liverpool City by supplying water for
HESSD
2, 887–916, 2005
Satellite data interpretation of causes and controls
S. Mukherjee et al. Title Page Abstract Introduction Conclusions References Tables Figures J I J I Back Close
Full Screen / Esc
Print Version Interactive Discussion
EGU
industrial and public consumption (Taylor et al., 2003). These aquifers have conse-quently been the subject of considerable research (e.g. Walton, 1981; Edmunds et al., 1982; Edmunds and Smedley, 2000; Jackson and Lloyd, 1983; Tellam et al., 1986).
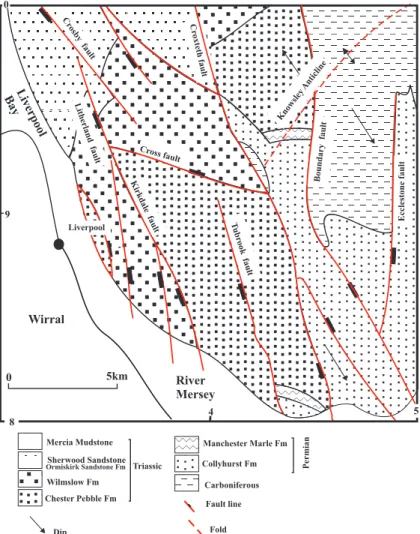
Permo-Triassic sedimentary rocks represent the principle aquifer units under Liv-erpool. The regional stratigraphy is represented in Table 1 and Fig. 2. Permo-Triassic
5
sedimentary rocks rest unconformably over Upper Carboniferous sandstones and mud-stones that are typically considered to denote the low permeability base of the aquifer. These older rock units crop out in the east and northeast of the area (Fig. 2). The Permo-Triassic sedimentary succession starts with the Collyhurst Sandstone Forma-tion, which is red-grey and fine to medium grained. The stratigraphically-equivalent
10
Manchester Marl and Bold Formations conformably overlie the Collyhurst Sandstone. The Manchester Marl in the north is not well exposed but is composed of calcareous siltstone or shale with thin bands of fossiliferous limestone. The age-equivalent Bold Formation in the south is made up of fine to very fine-grained sandstones.
The major sandstone unit that represents the bulk of the aquifer in the area, the
15
Sherwood Sandstone Group, overlies the Manchester Marl and Bold Formations. The base of this group is Chester Pebble Formation, made up of two units; the poorly ce-mented, red-to brown Lower Mottled Sandstone Unit, followed by the red or yellow, cross-laminated, coarse to medium grained pebbly sandstones of the Pebble Beds Unit. The overlying Wilmslow Sandstone Formation is characterised by soft,
fine-20
grained sandstones. The Ormskirk Sandstone Formation has two lithological units; the lower one is greyish-yellow to red sandstone and the upper one is a medium and fine-grained sandstone.
The Mercia Mudstone Formation, a major mudstone sequence overlying the Sher-wood Sandstone, is considered to be the upper low permeability boundary of the entire
25
aquifer and is composed of two units (the Tarporly Siltstone and the Mercia Mudstone). The Quaternary sediments represent a short length of post-glacial deposition with the sediments in this area dominated by sand materials in the south of area although the northern parts of Merseyside have abundant peat deposits away from the coast.
HESSD
2, 887–916, 2005
Satellite data interpretation of causes and controls
S. Mukherjee et al. Title Page Abstract Introduction Conclusions References Tables Figures J I J I Back Close
Full Screen / Esc
Print Version Interactive Discussion
EGU
3. Geological structure of the aquifer
The structural geology of the area is dominated by a variety of faults that are repre-sented on published geological maps and cross sections from the British Geological Survey (and its predecessors) and other published work (e.g. Morton, 1899; Wedd et al., 1923; Shackleton, 1953; NMBSGS, 1984).
5
Although faults dominate the geological structure from the hydrogeological perspec-tive (Fig. 2), there is also a subtle low amplitude fold with its axis running approximately northeast to southwest. This fold is known as the Knowsley anticline (Fig. 2) and it re-sults in a general, low angle northwest dip over the northern part of the study area and southeast dip in the vicinity of Halewood, Speke and Widnes. There are other small
10
syn- and anti-forms to the north of the Knowsley anticline but they have a very limited effect on the general dip of the strata.
The area is intensively disrupted by numerous large normal faults. These generally trend north-northwest – south-southeast with some smaller east – west cross faults. The throws of these faults vary from a few meters to >300 m. Examples of faults with
15
large displacements are the Boundary fault, the Croxteth fault and the Eccleston West fault (Fig. 2). The faults that seem to cause the greatest geological complexity occur at the boundary between the Permo-Traissic and Carboniferous rocks (Fig. 2). Faults in the Triassic Sherwood Sandstone aquifer have been shown to have extensive low per-meability zones associated with them; the thickness of the fault rock and the reduction
20
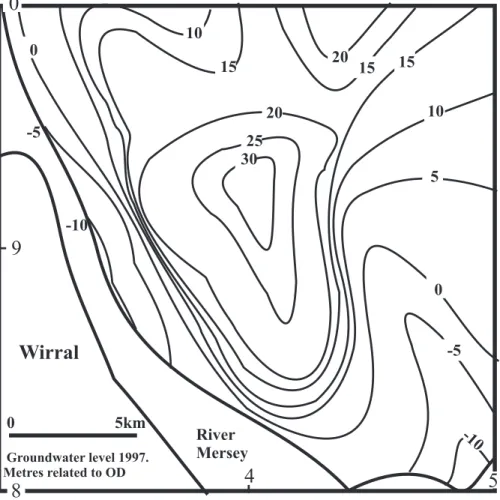
of permeability are proportional to the displacement of a particular fault (Beach et al., 1997; Chadwick, 1997; Cowan, 1996). In some places just north of Liverpool, small petroleum accumulations and seepages have been shown to be localised by faults testifying to their low permeability (sealing capacity; Kent, 1948; Lees and Taitt, 1945). The water table has been mapped out for the year 1997 using abundant borehole
25
water depth data provided by the Environment Agency (Fig. 3). NMBSGS (1984) math-ematically studied the boundary conditions of the groundwater aquifer in the Liverpool area and developed a model of the flow pattern in the aquifer from the sea to the aquifer
HESSD
2, 887–916, 2005
Satellite data interpretation of causes and controls
S. Mukherjee et al. Title Page Abstract Introduction Conclusions References Tables Figures J I J I Back Close
Full Screen / Esc
Print Version Interactive Discussion
EGU
and vice versa (Fig. 1). In the present study it will be shown from the interpretation of SPOT satellite data that the pattern of seawater intrusion is limited by the presence of faults in the aquifer. This fact is not totally in contradiction with NMBSGS model but it is more accurate and authentic because it can be used to identify the local structural con-trol on groundwater movement within the aquifer. The source of information is based
5
on the relative spectral reflectance in the near infrared part of the spectrum, which can be employed to measure the soil moisture through vegetation vigour in faulted areas (Parizek, 1997).
4. Groundwater geochemistry in the coastal aquifer
Previously unpublished borehole water geochemistry data have been made available
10
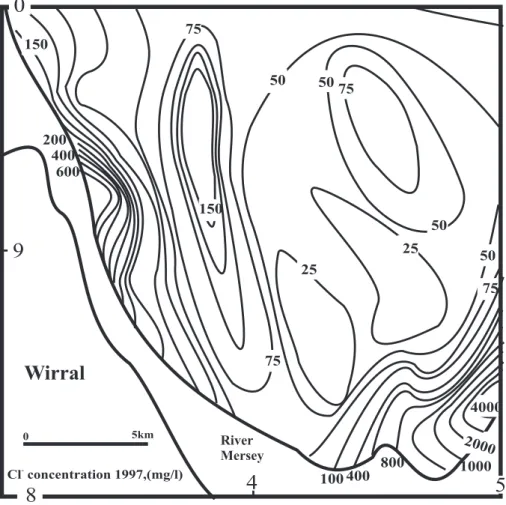
by the UK Environment Agency. Data from the coastal and inland regions have been assessed for their concentrations of dissolved ions to assess the spatial distribution of the saline intrusion. Distribution maps of the concentrations of aqueous chloride and sulphate (mg/l) from a chosen year (1997) have been prepared (Figs. 4 and 5). Aque-ous chloride offers the best data set since this species is geochemically conservative,
15
i.e. it will probably represent a simple physical mixture between seawater and freshwa-ter since chloride is little affected by precipitation or adsorption reactions. Sulphate, on the other hand, is not necessarily conservative since it can undergo bacterial reduction to produce pyrite (and can be involved in other geochemical processes).
As expected for groundwater in temperate climatic regions, chloride concentrations
20
are relatively low (<100 mg/l) for much of the area (Fig. 4). However, there are notable exceptions. The coastal strip near where the Mersey channel is at its narrowest has chloride concentrations in excess of 1000 mg/l. Also the coastal strip in the southeast of the study area is locally elevated to as much as 4000 mg/l. Maps of the dissolved sulphate concentrations have some similarities to the chloride maps although they are
25
not exactly the same (Fig. 5). Sulphate is elevated in parts of the coastal strip and just to the west of the centre of the study area.
HESSD
2, 887–916, 2005
Satellite data interpretation of causes and controls
S. Mukherjee et al. Title Page Abstract Introduction Conclusions References Tables Figures J I J I Back Close
Full Screen / Esc
Print Version Interactive Discussion
EGU
This paper will serve to assess the viability of using satellite data in hydrology and hydrogeology. Specifically, the value to mapping out faults in the aquifer in this tem-perate region where there is intensive land use will be assessed. The hydrogeological context is complex with a puzzling pattern of saline intrusion occurring immediately ad-jacent to portions of the aquifer that have a water table many 10’s of meters above sea
5
level. Satellite-related data will be employed to try to understand the localised pattern of water movement in this area.
5. Satellite date (spot) interpretation to understand saline intrusion: methods
Application of satellite remote sensing for natural resource management began initially with the launch of the first operational earth observation satellite, ERTS-1, in August
10
1972, later known as LANDSAT-1 (Mukherjee, 1996, 2004). Today, along with other satellites in space, data from French SPOT (Systeme Pour l’observation de la Terre system) are available on a continuous basis. The sensors operate in two modes; multi-spectral and panchromatic. SPOT is commonly referred to as a “push broom scanner” meaning that all scanning parts are fixed and scanning is accomplished by the forward
15
motion of the satellite. The SPOT satellite can observe the same area on the globe once every 26 days. The SPOT scanner normally produces nadir views (those directly below the satellite), but it does have off-nadir viewing capability. Off-nadir refers to any point that is not directly beneath the detectors, but off to an angle. Using the off-nadir capability, one area on the earth can be viewed as often as every 3 days. For the
20
present study SPOT XS, or multispectral, data were used which has 20 m×20 m spatial resolution and contains 4 spectral bands.
Multispectral SPOT data of Liverpool Merseyside were analysed for three major fea-tures that may help assess the location and control on seawater invasion of the aquifer. The first feature is the occurrence of faults onshore, on ground now covered by
vege-25
tation, within a few kilometers of the coastline. The second is the occurrence of faults at the coast directly adjacent to the intertidal region. The third is the distribution of mud
HESSD
2, 887–916, 2005
Satellite data interpretation of causes and controls
S. Mukherjee et al. Title Page Abstract Introduction Conclusions References Tables Figures J I J I Back Close
Full Screen / Esc
Print Version Interactive Discussion
EGU
versus sand on the intertidal zone of the coastline and the estuary.
Maps of the distribution of different geological formations prove that a number of significant faults occur in the sandstone aquifer (Fig. 2). These faults will likely occur as discrete sub-vertical zones of deformed and fractured rock matrix (Beach et al., 1997; Chadwick, 1997) in which the fault-rock has a significantly lower permeability
5
than the undeformed rock matrix (Beach et al., 1997; Chadwick, 1997). Some faults intersect with the coastline and the River Mersey (e.g. the Kirkdale, Tuebrook, Croxteth and Boundary faults, Fig. 6). However there are various branches off these faults that link the fault system and make an interconnected fault network.
On the SPOT data, faults can be identified as locations where there are relatively
10
higher spectral reflectance values in the near infrared band in 10 m resolution multi-spectral mode . Where the mid infrared band 4 (1.58–1.75 µm) is 50% greater than the green band 3 (0.50–0.59 µm) represents great vegetation vigour. Thus the anoma-lously good health of the vegetation is picked up in the details of the near infrared and green parts of the spectrum in the satellite data. Above the fault zones, it is likely that
15
the reduced permeability of the underlying rock (Beach et al., 1997; Cowan, 1997) has led to locally enhanced soil moisture since the water cannot drain away as quickly (Price et al., 1962; Kirkpatrick et al., 1963). Use of the hyperspectral tool in the ERDAS software has proved to be an effective way of detecting hidden faults (e.g. Abrams et al., 1985). An automatic internal average relative reflectance (IAAR) model was used in
20
this image. This model combines three commonly used functions into a single process. First the raw data are normalized using the same algorithm that is accessible through the normalize model. Next the internal average relative reflectance is computed using the same routine used by the internal average relative reflectance model. Using this approach it may be possible to pick out faults lying below the regolith in the aquifer.
25
It is likely that only faults with the greatest displacement and thickest sub-vertical fault zones will show up by this approach (Spechler, 2001). Thus the hidden faults were made visible by using this technique. Along the fault line soil moisture is effectively higher predominantly due to the occurrence of a localised decrease in bedrock
(sub-HESSD
2, 887–916, 2005
Satellite data interpretation of causes and controls
S. Mukherjee et al. Title Page Abstract Introduction Conclusions References Tables Figures J I J I Back Close
Full Screen / Esc
Print Version Interactive Discussion
EGU
regolith) permeability. The higher soil moisture content allows better vegetation growth (Dalal and Henry, 1986; Huete, 1988; Jackson et al., 1999). At the intersection of two faults the vegetation anomaly is even more extreme. For example, the Cross fault and Tuebrook fault intersection has overlying soil with very high moisture in this area.
It was possible to delineate this anomalous vegetation vigour using middle near infra
5
red spectral band 4 of SPOT data. All those areas with higher soil moisture were inferred as red patches in the IAAR processed image.
Faults could be identified in, and directly adjacent to, the intertidal region using the high pass filter of ERDAS software in the SPOT data. The high pass filters used to sharpen images are, in essence, edge enhancement techniques. Here high frequency
10
components are passed but low frequency components are attenuated. This allowed the elongated depressions to be mapped out.
The water adjacent to these demonstrably open faults was examined for changes in turbidity since fresh water springs are commonly associated with faults. The water was examined in the SPOT data using natural colour composite tool of classification in
15
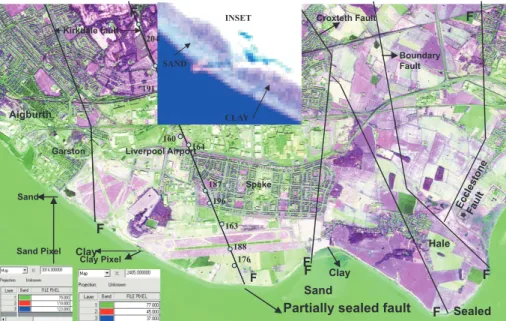
ERDAS software. The result was generated by the intensity hue saturation technique. SPOT data can be used to reveal the relative proportions of sand and clay in the intertidal part of the Mersey estuary and especially the parts that are directly adjacent to the Liverpool shore. This relative percentage of clay (as opposed to sand) in the intertidal zone was inferred from the near infrared part of the spectrum. Areas
domi-20
nated by clay have very low values in the near infrared part of the spectrum (20 to 40 in 0–255 range) while areas dominated by sand have much higher values in the near infrared part of the spectrum (120–150 in 0–255 range; Fig. 7). The relative percent-age of clay was determined for more than 50 individual locations along the coastline using the equation: clay%=256×100/NIR value (where 256 is the maximum pixel value
25
at any point). Clay-dominated intertidal zones will have different permeability charac-teristics than sand-dominated intertidal zones; this may be especially important at the sites were open fault impinge on the intertidal zone.
HESSD
2, 887–916, 2005
Satellite data interpretation of causes and controls
S. Mukherjee et al. Title Page Abstract Introduction Conclusions References Tables Figures J I J I Back Close
Full Screen / Esc
Print Version Interactive Discussion
EGU
6. Results
Water table maps (Fig. 3) and maps of the concentration of chloride and sulphate in the groundwater (Figs. 4 and 5) for the year 1997 reveal a picture of seawater intrusion in the area just close to the Mersey estuary.
6.1. Open faults adjacent to the intertidal zone
5
Some faults were visible in the near intertidal region having the appearance of elongate depressions (Fig. 8). These faults abutted the shoreline and were lost from view where they were covered with sediment or seawater. The established geological map proved that these features are indeed significant geological faults. The presence of depres-sions must be due to the fault zone being more prone to weathering and erosion that
10
the surrounding undeformed rocks.
6.2. Nature of sediment in the intertidal zone
The relative percentage of clay was determined for more than 50 individual locations along the coastline (Fig. 9). It is noteworthy that the sand-dominated sediment is found (1) where the river Mersey broadens out into the Estuary, (2) in the Narrows and (3)
15
along the Irish Sea coastline of the aquifer. Clay-dominated sediment occurs along the coast where the estuary is widest and water flow velocities will be least. These near-shore inter-tidal zone clay sediments were identified as being greater than 4 me-ters wide, computed by using the ERDAS measurement tool from the SPOT satellite data. Clay-dominated intertidal zones will have different permeability characteristics
20
than sand-dominated intertidal zones; this may be especially important at the sites were open fault impinge of the intertidal zone.
HESSD
2, 887–916, 2005
Satellite data interpretation of causes and controls
S. Mukherjee et al. Title Page Abstract Introduction Conclusions References Tables Figures J I J I Back Close
Full Screen / Esc
Print Version Interactive Discussion
EGU
6.3. Fault patterns away from the coastline within the aquifer
The Liverpool area includes land that has either been built on or farmed. Land-usage is intensive. There is relatively little bedrock exposure and most of the geological map production the area has been done using boreholes and remote sensing tech-niques. In spite of this pattern of land use, the satellite data have elongate and
corre-5
latable anomalies that can be mapped out to form continuous features (Fig. 10). The anomalies can be understand in terms of long, low-permeability zones sitting within the broadly porous and permeable aquifer. Fault rocks in the aquifer between the foot and hanging wall of the fault best explain these features. Comparison of published geolog-ical maps of the area and the elongate anomalies confirm that the features do indeed
10
represent major geological faults (that have seen up to 300m of vertical displacement) and prove the value of (i.e. ground-truth) the approach.
7. Discussion
7.1. Seawater invasion of the Sherwood sandstone aquifer
The water table in 1997 was below sea level in the some areas close to the Mersey
15
estuary (Fig. 3). The greatest decrease in water table elevation from >30 m above sea level to >10 m below sea level occurs in the central Liverpool and Widnes areas. In the Liverpool area west of the Kirkdale fault and in the Widnes area east of the Boundary fault the water table falls to −10 m O.D. However the area between the Croxteth and Boundary faults close to the Mersey River, the groundwater level does not reach the
20
same level as in Liverpool and Widens areas. The relative flow directions of groundwa-ter and seawagroundwa-ter were modelled by NMBSGS (1984, and Fig. 1). This model revealed that in the areas where the water table falls below sea level, the flow is from the sea to the aquifer. On the other hand, in the areas where the water table is above sea level then the flow is from the aquifer to the sea. The chloride and sulphate concentration
HESSD
2, 887–916, 2005
Satellite data interpretation of causes and controls
S. Mukherjee et al. Title Page Abstract Introduction Conclusions References Tables Figures J I J I Back Close
Full Screen / Esc
Print Version Interactive Discussion
EGU
distribution maps (Figs. 4 and 5) reveal a similar pattern to the water table height map. Chloride and sulphate occur at high concentrations in the areas of central Liverpool and Widnes. This confirms the seawater intrusion in these areas. In contrast, the ar-eas north of Liverpool and between the Croxteth and Boundary faults, chloride and sulphate concentration are low proving that seawater intrusion has not occurred. The
5
pattern of seawater invasion is locally variable.
7.2. Viability of mapping faults in temperate, urban and agricultural areas using satel-lite data
The major faults delineate approximately N-S sub-vertical bodies of crushed and ground fault rock (Fig. 2). For Triassic Sherwood Sandstone, it has been recorded
10
that the thickness of the fault zone is related to the amount of displacement on the fault so that faults with greater displacement will have wider damaged zones (Beach et al., 1997; Chadwick, 1997). One of the consequences of the damaged zone is that it will have lower permeability than the surrounding rock (due to grain size diminu-tion, cataclasis, and clay smearing). Faulted rock in gas fields in the same Triassic
15
sandstones (50 km offshore) form effective seals that stop the escape of gas from the structure (Knipe et al., 1993), thus proving that faulted Triassic Sherwood Sandstone does indeed have very low-permeability.
Faults lying below regolith cannot be seen using standard geological mapping tech-niques. The application of satellite remote sensing offers a relatively novel way of
20
mapping out major geological faults. There is the caveat that only major faults are discernable since only these have enough displacement to have resulted in thick low-permeability fault rocks. Furthermore, this technique (satellite image data manipula-tion) will only work where a permeability-contrast results from the movement on the fault plane. Thus if there was a major fault with low permeability mudstone on either
25
side, the fault zone would not have a permeability contrast (to the matrix rock) and are unlikely to be visible using indirect satellite imagery. Indeed, the approach would not work if a low permeability mudstone were juxtaposed to a higher permeability aquifer
HESSD
2, 887–916, 2005
Satellite data interpretation of causes and controls
S. Mukherjee et al. Title Page Abstract Introduction Conclusions References Tables Figures J I J I Back Close
Full Screen / Esc
Print Version Interactive Discussion
EGU
sandstone since the low permeability fault rock would be indistinguishable from the adjacent low permeability mudstone. In conclusion, this technique of using satellite data to identify major faults should work best in unconfined aquifers. This approach could be universally applicable for delineating groundwater compartments that result for sub-vertical faulting.
5
7.3. Open faults in and next to the intertidal zone
The role of faults in controlling groundwater discharge adjacent to areas with rela-tively elevated water tables has been confirmed using the satellite data. Close to the shoreline and the intertidal zone, short elongate depressions follow the paths of conventionally-mapped faults (Fig. 8). In these areas the fault zone, being damaged
10
and weakened by repeated geological movements, will have been weathered and eroded faster than the surrounding unfaulted aquifer (e.g. Rowe and Burley, 1997). These faults will thus probably have a deeper weathering profile below the regolith than unfaulted sandstone. In the near-surface, this weathered and weakened zone will likely be a site of preferred water flow (focussing of near-surface flow). This alone is
15
significant but best of all is that the satellite data record signs of freshwater discharge from the fault zone into the saline waters of the estuary (Fig. 7). This discharge is recognised by a net reduction in the turbidity of the water in the estuary. This approach has shown that it is possible to identify faults, by direct means, using satellite data immediately adjacent to the coast-line and just into the intertidal zone.
20
7.4. Implications for the hydrogeology of the coastal Sherwood Sandstone aquifer in the Liverpool area
The movement of seawater into the onshore aquifer (Fig. 1) illustrated by the elevated chloride content (as high as 4000 mg/l; Fig. 4) is largely the result of the over-extraction of fresh water from the aquifer in the immediate area for use in various medium and
25
HESSD
2, 887–916, 2005
Satellite data interpretation of causes and controls
S. Mukherjee et al. Title Page Abstract Introduction Conclusions References Tables Figures J I J I Back Close
Full Screen / Esc
Print Version Interactive Discussion
EGU
aquifer into the seawater of the Mersey estuary and the open sea (Fig. 1) is the result of a local water table high just to the east of the centre of the city of Liverpool (Fig. 3) where there is a localised topographic high. Where there is a flow of fresh water into the seawater there is a low chloride concentration recorded in the local groundwater. This is also where the open faults in the intertidal zone display an outflux of water into
5
the estuary (as imaged using the satellite data: Fig. 7). One of the mysteries of the relative converse movements of seawater and freshwater is why there is such a steep gradient in the water table and why freshwater from the water table high (Fig. 3) does not flow down the steep hydrostatic gradient and more extensively fill the water table depression with freshwater. The major faults that could be mapped using the satellite
10
data (Fig. 10) must have low permeability (to facilitate imaging from the satellite data) and must act as an important transmissibility barriers in the aquifer. The dominant fault trend is approximately N-S thus allowing saline intrusion in a northwards direction from the Mersey estuary near to Widnes. The other site of a sub-sea level water table, near central Liverpool, has a much more restricted zone of saline invasion since the influx
15
direction is perpendicular to the main fault trend in this area.
8. Conclusions
The Triassic Sherwood Sandstone aquifer in the Liverpool and Merseyside region has locally undergone saline invasion where there has been excess freshwater extraction. In other areas, there is a net outflux of freshwater to the sea where there are local water
20
table highs lying directly underneath minor topographic highs. There are very steep water table contours separating the zones of saline invasion and zones of freshwater outflux.
Identification of faults has been achieved using SPOT data. The Automatic Internal Average Relative Reflectance tool of ERDAS was found to be a very useful
hyperspec-25
tral tool. This tool could be used for the automatic identification of faults hidden beneath regolith. This worked since fault zones will have lower permeability than the majority of
HESSD
2, 887–916, 2005
Satellite data interpretation of causes and controls
S. Mukherjee et al. Title Page Abstract Introduction Conclusions References Tables Figures J I J I Back Close
Full Screen / Esc
Print Version Interactive Discussion
EGU
the aquifer. This will lead to relatively poorer drainage and commensurately a different (better) state health of the overlying vegetation.
Fault zones will only be identifiable using satellite where the faulting has led to a distinct difference in permeability within the fault zone relative to higher permeability unfaulted rocks. Fortunately, this technique could thus prove to be useful for mapping
5
major, sub-vertical fault-zone transmissibility barriers in aquifers.
Fault zones at the coast and towards the intertidal zone were mapped out from the satellite data since the very top of the low permeability fault zones must be more prone to weathering and erosion than the surrounding aquifer sandstones.
Identification of sand versus clay in the intertidal zone has been achieved using
10
satellite imagery to reveal whether the open fault zones in the intertidal zone are either filled with coarse beach sand and able to transmit outflowing water or plugged with clay and thus incapable of transmitting outflowing freshwater from the neighbouring water table highs.
There are very steep water table contours separating the zones of saline invasion
15
and zones of freshwater outflux as a result of the occurrence of major low permeability sub-vertical fault zones within the aquifer mapped out using the hyperspectral satel-lite data. These major faults have profoundly controlled the pattern of groundwater movement and have effectively stopped freshwater in a water table mound filling the depression in the water table thus permitting saline invasion.
20
Acknowledgements. The work was supported by Commonwealth Scholarship Commission of
UK, Association of Commonwealth Universities and European Space Agency (Award No. INCF-2004-87 and European Space Agency Category-1 Project ID 2846). The infrastructure pro-vided by the Department of Earth & Ocean Sciences at the University of Liverpool is duly acknowledged. The authors would like to thank the Environmental Agency staff J. Ingram and 25
HESSD
2, 887–916, 2005
Satellite data interpretation of causes and controls
S. Mukherjee et al. Title Page Abstract Introduction Conclusions References Tables Figures J I J I Back Close
Full Screen / Esc
Print Version Interactive Discussion
EGU
References
Abrams, M., Blusson, A., Carrere, V., Nguyen, T., and Rabu, Y.: Image processing applications for geologic mapping, IBM J. Res. Develop., 29, 2, 177–187, 1985.
Beach, A., Brown, J. J., Welbon, A. L., McCallum, J. E., Brockbank, P., and Knott, S.: Char-acteristics of fault zones in sandstones from NW England: application to transmissibility, in: 5
Petroleum geology of the Irish Sea and adjacent areas, edited by: Meadows, N. S., True-blood, S. P., Hardman, M., and Cowan, G., Special Publication of the Geological Society, 124, 315–324, 1997.
Braithwaite, F.: On the infiltration of Salt-water into the springs and wells under London and Liverpool, Minutes of Proc. Inst. Civ. Eng., 14 507–523, 1855.
10
Carter, R. W. G.: Coastal environments. An introduction to the physical, ecological and cultural systems of coastlines, Academic Press, London, 1988.
Chadwick, R. A.: Fault analysis of the Cheshire Basin, NW England, in: Petroleum geology of the Irish Sea and adjacent areas, edited by: Meadows, N. S., Trueblood, S. P., Hardman, M., and Cowan, G., Special Publication of the Geological Society, 297–313, 1997.
15
Cowan, G.: The development of the North Morecambe gas field, East Irish Sea, UK, Petroleum Geoscience, 2, 43–52, Bow, C. J., Howell, F. J., Paune, C. J., and Thompson, P. J., 1969a, The lowering of the water table in the Permo-Triassic rocks of south Lancashire, Water and Water Eng., 74, 461–463, 1996.
Crook, J. M. and Howell, F. T.: Tthe characteristics and structure of the Permo-Triassic sand-20
stone aquifer of Liverpool and Manchester industrial region of northwest England, Convegno internazionale Sulle Acque Sotterranee, Palermo, Sicily, 6–8 December, 217–225, 1970. Crook, J. M. and Howell, F. T.: Possible districts in south Lancashire and north Cheshire where
the Permo-Triassic sandstone aquifer appears capable of further development, Water and Water Eng., 76, 470–471, 1971.
25
Crook, J. M. and Howell, F. T.: Pleistocene glaciers as the source of fossil freshwaters en-countered in the Permian and Triassic sandstones of the Cheshire Basin, England, Internat. Symp. On Develop. Of Groundwater Resources, Madras, India, 1973.
Dalal, R. C. and Henry, R. J.: Simultaneous determination of moisture, organic carbon and total nitrogen by near infrared reflectance spectrophotometry, Soil Sci. Soc. Am. J., 50, 120–123, 30
1986.
HESSD
2, 887–916, 2005
Satellite data interpretation of causes and controls
S. Mukherjee et al. Title Page Abstract Introduction Conclusions References Tables Figures J I J I Back Close
Full Screen / Esc
Print Version Interactive Discussion
EGU
Triassic Sandstone aquifer, England, Geochim. Cosmochim Acta 46, 2068–2081, 1982. Edmunds, W. M. and Smedley, P.: Residence time indicators in groundwater: the East Midlands
Triassic sandstone aquifer, Appl. Geochem., 15, 737–752, 2000.
Environment Agency: The State of the Environment of England and Wales: Coasts, The Sta-tionary Office, London, 1999.
5
Greenwood, E. F. (ed.): Ecology and Landscape Development: A History of the Mersey Basin, Liverpool University Press, Liverpool, 1999.
Hibbert, E. S.: The hydrogeology of the Wirral Peninsula, Unpub. M.Sc. Thesis, Univ. Liverpool, 1954.
Hibbert, E. S.: The hydrogeology of the Wirral Peninsula, J. Instn. Wat. Eng., 10, 441–469, 10
1956.
Howell, F. T.: The sub-drift surface of south central Lancashire, Unpub. M. Sc. Thesis, Univ. Manchester, 1956.
Huete, A. R.: A soil-adjusted vegetation index (SAVI), Remote Sens. Environ. 25, 89–105, 1988.
15
Jackson, D. and Lloyed, J. W.: Groundwater chemistry of the Birmingham Triassic Sandstone aquifer and its relation to structure, Q. J. Eng. Geol., 16, 135–142, 1983.
Jackson, T. J., Le Vine, D. M., Hsu, A. Y., Oldak, A., Starks, P. J., Swift, C. T., Isham, J. D., and Haken, M.: Soil moisture mapping at regional scales using microwave radiometry: the Southern Great Plains Hydrology Experiment, IEEE Trans. Geosci. Remote Sens., 37, 20
2136–2151, 1999.
Jaisawal, R. K., Mukherjee, S., and Krishnamurthy, J.: Role of Remote sensing and GIS tech-niques for generation of groundwater prospect zones towards rural development- an ap-proach, Int. J. Rem. Sens., Taylor & Francis, 24, 5, 993–1008, 2003.
Kent, P. E.: A deep borehole at Formby, Lancashire, Geological Magazine, 85, 22–35, 1948. 25
Kirkpatrick, G. A, Price, W. E., and Madison, R. A.: Water resources of eastern Kentucky-progress report: Kentucky Geological Survey, ser. 10, report of investigations, 5, 67, 1963. Knipe, R. J., Cowan, G., and Balendran, V. S.: The tectonic history of the East Irish Sea
Basin with reference to the Morecambe Field, In: Petroleum geology of Northwest Europe: proceedings of the 4th conference, edited by: Parker, J. R., Geological Society, London, 30
857–866, 1993.
Lees, G. and Taitt A. H.: The geological results of the search for oilfields in Great Britain. Quarterly Journal of the Geological Society, 101, 255–317, 1945.
HESSD
2, 887–916, 2005
Satellite data interpretation of causes and controls
S. Mukherjee et al. Title Page Abstract Introduction Conclusions References Tables Figures J I J I Back Close
Full Screen / Esc
Print Version Interactive Discussion
EGU
Memon, B. A.: Viscous-flow model study of the groundwater resources of the Triassic area of the Wirral Peninsula, Unpub. Thesis, Univ. Coll., Univ. of London, 1975.
Morton, G. H.: On the position of wells for the supply of water in the neighbourhood, Proc. Liverpool Geol. Soc., 1, 27, 1899.
Mukherjee, S.: Targeting Saline Aquifer by Remote Sensing and Geophysical Methods in a 5
Part of Hamirpur-Kanpur, India, Hydrol. J., 19, 1, 53–64, 1996.
Mukherjee, S.: A Textbook of Environmental Remote sensing. Macmillan India Ltd.,http://www.
macmillanindia.com, 2004.
NMBSGS: North Mersey Basin Saline Groundwater Study, final report to the North West Water Authority by the University of Birmingham, Summary Report, 1984.
10
Parizek, R. R. and Gold, D. P.: Fracture trace and lineament analysis: application to groundwa-ter resource characgroundwa-terization and protection[ course notes]: National Ground wagroundwa-ter associa-tion, 7–10 April Penn University, State college Pennsylvania, 1997.
Price Jr., W. E., Mull, D. S., and Kilburn, C.: Reconnaissance of groundwater resources in the eastern Kentucky coal Field region Kentucky, US Geological Survey, Paper 1607, 1962. 15
Shackelton, R. M.: Geology in a scientific study of Merseyside, published for Brit. Assoc. by Univ. Press of Liverpool, edited by: Smith, W., 1953.
Spanou, M. and Chen, D.: Integrated management of the Upper Mersey river basin using the SMILE object-oriented software system, Water Sci. Technol., 46, 6–7, 105–112, 2002. Stephenson, R.: Report on the supply of water to the town of Liverpool. Report to the Water 20
Committee of Liverpool Town Council, 1850.
Taylor, R. G., Cronin, A. A., Trowsdale, S. A., Baines, O. P., Barrett, M. H., and Lerner, D. N. L.: Vertical groundwater flow in Permo-Triassic sediments underlying two cities in the Trent River Basin (UK), J. Hydrol., 284, 92–113, 2003.
Tellam, J. H. and Lloyd, J. W.: Problems in the recognition of seawater intrusion by chemical 25
means: an example of apparent chemical equivalence, J. Eng. Geol., 19, 389–398, 1986. Tellam, J. H., Lloyd, J. W., and Walters, M.: The morphology of a saline groundwater body: its
investigation, description and possible explanation, J. Hydrol., 83, 1–21, 1986.
Walton, N. R. G.: A detailed hydrogeological study of groundwater from the Triassic sandstone aquifer of south-west England, Institute of Geological sciences Report 81/5, Institute of Ge-30
ological Sciences, London,http://www.merseybasin.org.uk, 43, 1981.
Wedd, G. B., Smith, B., Simmons, W. C., and Wary, D. A.: The geology of Liverpool, Mem. Geol. Surv. Eng. and Wales, 183, 1923.
HESSD
2, 887–916, 2005
Satellite data interpretation of causes and controls
S. Mukherjee et al. Title Page Abstract Introduction Conclusions References Tables Figures J I J I Back Close
Full Screen / Esc
Print Version Interactive Discussion
EGU
Table 1. The geologic succession (compiled from University of Birmingham, 1984 and Tellam,
1994).
System Stage Lithostratigraphical Division Previous
Divi-sion
Thickness m
Hydrogeological characters Quaternary Flandrian SoilAlluvium
Terrace deposits (sands and gravels) Shirdley Hill Sand Formation (blown sand)
Stockport Formation (till with glacial sands)
>1−35 Aquiclude
Devensian Stockport Formation (till with glacial sands) 10–50 Aquiclude Triassic Anisian Mercia Mudstone Group
Mudstone unit Keuper Marl 405 Aquiclude
Tarporley Siltstone Fm Keuper Wa-terstone
30–60 Aquiclude
Scythian Sherwood
Sandstone Group
Ormskirk Sandstone Fm Keuper Sand-stone
181–295 Aquifer
Wilmslow Sandstone Fm U..Mottled Sandstone
205–480 Aquifer
Chester Pebble Beds Fm.
Pebble Beds Unit
Bunter Pebble Beds 316–375 Aquifer L. Mottled Sandstone Unit L.Mottled Sandstone 0–>80 Aquifer
Permian Upper BoldMarl Fm Fm/Manchester ManchesterMarl 10–225 Mixedaquiclude
aquifer-Lower Collyhurst Sandstone Fm Collyhurst
Sandstone
283–720 Aquifer
HESSD
2, 887–916, 2005
Satellite data interpretation of causes and controls
S. Mukherjee et al. Title Page Abstract Introduction Conclusions References Tables Figures J I J I Back Close
Full Screen / Esc
Print Version Interactive Discussion
EGU
Location Map
Fig. 1. Ground-water-seawater flow directions, Merseyside, UK in December 1966 from the
HESSD
2, 887–916, 2005
Satellite data interpretation of causes and controls
S. Mukherjee et al. Title Page Abstract Introduction Conclusions References Tables Figures J I J I Back Close
Full Screen / Esc
Print Version Interactive Discussion EGU 0 5km 9 River Mersey Wirral Liverpool Bay 4 Sherwood Sandstone Ormiskirk Sandstone Fm Wilmslow Fm Chester Pebble Fm Triassic Manchester Marle Fm Collyhurst Fm Permian Carboniferous Fault line Fold Dip Mercia Mudstone Liverpool Cr oxteth fault Ecclestone fault Cross fault Cr osb y fau lt Kirkdale fault Boundary fault Litherland fault Tubr ook fault Knowsley Anticline 8 0 5
Fig. 2. Geological and structural map Merseyside UK (compiled from published maps of the
HESSD
2, 887–916, 2005
Satellite data interpretation of causes and controls
S. Mukherjee et al. Title Page Abstract Introduction Conclusions References Tables Figures J I J I Back Close
Full Screen / Esc
Print Version Interactive Discussion EGU 15 10 15 10 5 0 -5 -10 20 25 30
4
9
0 5km Groundwater level 1997. Metres related to OD -10 -5 0 15 20 River MerseyWirral
0
8
5
HESSD
2, 887–916, 2005
Satellite data interpretation of causes and controls
S. Mukherjee et al. Title Page Abstract Introduction Conclusions References Tables Figures J I J I Back Close
Full Screen / Esc
Print Version Interactive Discussion EGU 75 150 150 200 400 600 100 4000 2000 400 800 1000 75 75 50 50 25 50 25 50 75
4
9
Cl concentration 1997,(mg/l) -0 5km River MerseyWirral
0
8
5
HESSD
2, 887–916, 2005
Satellite data interpretation of causes and controls
S. Mukherjee et al. Title Page Abstract Introduction Conclusions References Tables Figures J I J I Back Close
Full Screen / Esc
Print Version Interactive Discussion EGU 100 75 50 100 125 400 125 125 200 200 300 400
4
9
200300 0 5km SO concentration 1997 (mg/l) --4 125 150 150Wirral
River Mersey0
8
5
HESSD
2, 887–916, 2005
Satellite data interpretation of causes and controls
S. Mukherjee et al. Title Page Abstract Introduction Conclusions References Tables Figures J I J I Back Close
Full Screen / Esc
Print Version Interactive Discussion EGU
X
Y
Flow
direction
River
Mersey
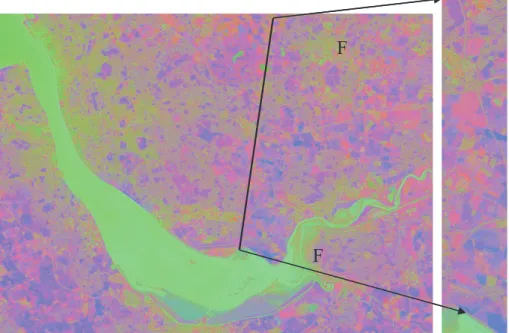
Fig. 6. Kirkdale fault offshoot shows sealed boundary with River Mersey (clay patches shows
low pixel values in NIR). Faults have been taken from geological maps from the area (and see Fig. 2).
HESSD
2, 887–916, 2005
Satellite data interpretation of causes and controls
S. Mukherjee et al. Title Page Abstract Introduction Conclusions References Tables Figures J I J I Back Close
Full Screen / Esc
Print Version Interactive Discussion EGU Clay Sand Speke Liverpool Airport Garston Aigburth Hale
Partially sealed fault
Clay Sand F F Kirkdale fault Sealed Croxteth Fault Boundary Fault EcclestoneFault F F F F F F F Sand Pixel Clay Pixel 176 188 163 196 187 164 160 164 191 159 SAND CLAY INSET 204
Fig. 7. Sealed and partially sealed faults in Merseyside inferred by SPOT data (inset: based on
pixel values from sand and clay). Faults have been taken from geological maps from the area (and see Fig. 2).
HESSD
2, 887–916, 2005
Satellite data interpretation of causes and controls
S. Mukherjee et al. Title Page Abstract Introduction Conclusions References Tables Figures J I J I Back Close
Full Screen / Esc
Print Version Interactive Discussion EGU River Mersey Clay Sand F F Unsealed boundary Sealed F Kirkdale main fault F Cross fault F F Opening of fault Fault trace River Mersey Clay Sand F F Unsealed boundary Sealed F Kirkdale main fault F Cross fault F F Opening of fault Fault trace
Fig. 8. Kirkdale fault (F-F) shows sealed and unsealed boundary with River Mersey inferred
by SPOT data (clay-low pixel value and sand-high pixel value in NIR). Faults have been taken from geological maps from the area (and see Fig. 2).
HESSD
2, 887–916, 2005
Satellite data interpretation of causes and controls
S. Mukherjee et al. Title Page Abstract Introduction Conclusions References Tables Figures J I J I Back Close
Full Screen / Esc
Print Version Interactive Discussion EGU Liverpool Bay Wirral River Mersey Bootle Walton Kirkdale Hale Garston Speke Aigbirth Crosby Bright on Isl. 19% clay Dingle 54% clay 88% clay Airport 66% clay 61% clay 55%clay L I V E R P O O L + + Rise in Cl and SO4in Ground Water) --Low Cl and SO4 in Ground Water F F F F Liverpool Bay Wirral River Mersey Bootle Walton Kirkdale Hale Garston Speke Aigbirth Crosby Bright on Isl. 19% clay Dingle 54% clay 88% clay Airport 66% clay 61% clay 55%clay L I V E R P O O L + + Rise in Cl and SO4in Ground Water) --Low Cl and SO4 in Ground Water F F F F
Fig. 9. Part of the Mersey estuary and coast line inferred by SPOT data showing relative clay
HESSD
2, 887–916, 2005
Satellite data interpretation of causes and controls
S. Mukherjee et al. Title Page Abstract Introduction Conclusions References Tables Figures J I J I Back Close
Full Screen / Esc
Print Version Interactive Discussion EGU
F
F
F
F
Fig. 10. Croxteth fault generated automatically by AIARR ERDAS tool using the hyperspectral