The potential of major ion chemistry to assess groundwater vulnerability of a regional aquifer
1
in southern Quebec (Canada)
2 3
G. Meyzonnat 1,M. Larocque 1*, F. Barbecot 1, D.L. Pinti1, S. Gagné 1 4
1
Département des sciences de la Terre et de l’atmosphère and GEOTOP, Université du Québec à
5
Montréal, C.P. 8888, Succursale Centre-Ville, Montreal (Québec), Canada, H3C 3P8
6
*Corresponding author: larocque.marie@uqam.ca;(514)-987-3000 # 1515
7
8
Abstract
9
Groundwater vulnerability mapping provides useful but limited information for developing 10
protection plans of the resource. Classical vulnerability ranking methods often do not take into 11
account complex hydro-stratigraphy and never consider groundwater flow dynamics. The objective 12
of this work was to test the potential of major ion chemistry to assess regional scale intrinsic 13
groundwater vulnerability. Because it reflects water-sediment and water-rock interactions, the new 14
vulnerability index reflects both infiltration processes and groundwater hydrodynamics. The method 15
was applied on a regional fractured bedrock aquifer located in the Becancour region of southern 16
Quebec (Canada). In this region, hydrogeochemistry shows that freshly recharged groundwater 17
evolves from (Ca,Mg)-HCO3 and Ca-SO4 to Na-HCO3 type with gradually increasing confinement 18
conditions in the fractured aquifer, and tends to Na-Cl type locally by mixing with trapped marine 19
pore-water. The new method identified recharge areas as those of highest vulnerability and 20
gradually decreasing vulnerability as confinement of the aquifer increased. It also highlights local 21
discontinuities in confinement that differ from the regional pattern. Results showed a good 22
correlation between groundwater vulnerability estimated with the new method and nitrate 23
occurrence in groundwater. Eighty-two percent of all samples presenting detectable nitrate 24
concentrations were characterized by a Hydrogeochemical Vulnerability Index greater than 9 25
(maximum is 10). The ability of the new vulnerability method to identify areas vulnerable to 26
detectable nitrate concentrations was much higher than that deriving from the DRASTIC method. 27
This work confirms that major ions chemistry contains significant information about groundwater 28
vulnerability and could be used to improve groundwater resource management. 29
Keywords
31
Groundwater, vulnerability, hydrogeochemistry, fractured bedrock aquifer, Quebec (Canada) 32
33
Introduction
34 35
In the last decades, worldwide increases in groundwater contamination (UNEP 2003) have 36
brought attention to the concept of groundwater vulnerability and led to the development of specific 37
mapping techniques. Groundwater vulnerability is generally defined as the capacity of a 38
hydrogeological system to transfer a contaminant from the land surface to the saturated zone. This 39
concept is continuously evolving and several definitions have been proposed. For example, intrinsic 40
vulnerability (Vrba and Zoporozec 1994) and intrinsic sensitivity (EPA 1993) usually refer to 41
groundwater vulnerability due to the hydrogeological context independently of land use or any 42
information about the spatial distribution of potential sources of contamination. The specific 43
vulnerability (Andrade and Stigter 2009) integrates contaminant-specific parameters, such as half-44
life or sorption coefficient to soil organic matter when assessing groundwater vulnerability to 45
pesticides. In reference to the source-pathway-target concept, the contaminant pathway for “aquifer 46
vulnerability” is the vertical path from the ground surface to the water table. When considering 47
“well vulnerability” (Frind et al. 2006) the contaminant pathway is the flow path from an 48
upgradient source at ground surface to a given well. 49
Many methods are available to estimate intrinsic groundwater vulnerability. Ranking or index-50
based aquifer vulnerability methods such as DRASTIC (Aller et al. 1987), AQUIPRO (Chowdhury 51
2003) or LHT (Mansoor 2014) might be the easiest methods to implement using available physical 52
data. These methods are currently widely used in water management as land-use planning tools and 53
often reported in the scientific literature (see Saidi 2010; Tilahun 2010; Chen 2013; or Mansoor
54
2014 for recent applications of the DRASTIC index). However, index methods raise criticism 55
because they often fail to predict the occurrence of contaminants in groundwater (Mehnert et al. 56
2005; Stigter et al. 2008). One reason could be because indexed aquifer vulnerability methods do 57
not take into account groundwater flow dynamics, which may control the lateral migration of 58
contaminants from the land surface to the aquifer (Kozuskanich 2014). The scientific literature 59
holds many examples of modification and adaptation of index methods intended to increase their 60
reliability in specific contexts or to increase their efficiency to correlate with contaminant 61
occurrence (Bojórquez-Tapia et al. 2009; Zhou 2012; Chen 2013). 62
The estimation of travelling time through the vadose zone could serve as an indicator of aquifer 63
vulnerability (Van Stempvoort 1992) but requires data extracted from geological 3D models which 64
are often unavailable. At the opposite end, numerical models of solute transport through vadose and 65
saturated zones (Yu 2014) aim to represent all relevant processes influencing well vulnerability. 66
These methods integrate flow dynamics and are very useful for assessing the risk of anthropogenic 67
pollution to potable water supplies (Frind et al. 2006), but have large data requirements (Nobre 68
2007). 69
Another way to integrate groundwater flow processes is to consider groundwater geochemistry. 70
Major ions water chemistry (Ca, Mg, K, Na, Cl, HCO3 and SO4) is the product of water-soil and 71
water-rock interactions (e.g., Barbecot et al. 2000; Sanexa 2001). Because they depend on flow 72
paths and on groundwater residence times, major ion facies are often used to determine the natural 73
baseline composition of groundwater (Edmunds et al. 2003) or to distinguish between contrasted 74
hydrogeological contexts (Cloutier et al. 2008). Hydrogeochemistry can also be useful to assess 75
groundwater quality through statistical regression of chemical trends (Stigter et al. 2008). 76
Multivariate analyses of geochemical data have been used to build groundwater quality indices, and 77
typically include solutes from natural and/or anthropogenic origin (Saeedi et al. 1998). 78
Hydrogeochemistry closely reflects input from recharge areas, as well as confinement conditions 79
and groundwater travel times. It is therefore a proxy for groundwater vulnerability. Recharge areas 80
represent direct links between the surface and the saturated zone, characterized by a distinct water 81
signature. Aquifer confinement usually implies a longer rock-water contact time. And, as travel 82
time increases, the possibility of degradation (e.g., denitrification; see McMahon et al. 2008), cation 83
adsorption (e.g., on clay matrix; Andrade and Stigter 2009) and dilution within the regional aquifer 84
flow also increase. Although groundwater quality indices are useful to distinguish more or less 85
vulnerable areas, they mostly portray regional quality of groundwater (Sorichetta et al. 2013). 86
Mendizabal and Stuyfzand (2011) have explicitly defined an intrinsic well vulnerability index by 87
integrating several hydrogeochemical parameters (i.e., pH, redox level, alkalinity and groundwater 88
age as pre- or post-tritium bomb peak). However, this method does not focus on the basic evolution 89
of the major ion composition of groundwater within various hydrogeological contexts. 90
Hydrogeochemistry has the potential to represent complex influential patterns regarding well 91
vulnerability which otherwise could be extremely difficult to determine at the regional scale with 92
physical approaches. The objective of this work was to test the potential of major ion chemistry to 93
assess regional scale intrinsic groundwater vulnerability. A new vulnerability index based on the 94
groundwater major ions facies is applied to a regional-scale fractured bedrock aquifer located in the 95
Becancour River watershed in southern Quebec (Canada). The vulnerability index is compared to a
96
regional groundwater vulnerability map drawn with the DRASTIC index and the capacity of both 97
methods to identified measured groundwater nitrate concentrations is assessed. 98
99
Geological and hydrogeological setting
100 101
The study area is located in southwestern Quebec (Canada) and it covers 2,920 km2 in the northern 102
portion of the Becancour River watershed (Fig. 1). The northwestern part corresponds to the 103
St. Lawrence Lowlands with flat topography and elevations below 150 masl. The southeastern part 104
is located in the Appalachian Mountains and is marked by an irregular topography reaching 105
maximum elevations of 500 masl. The two regions correspond geologically to the St. Lawrence 106
Platform and the Appalachian Mountains (Fig. 2; Globensky 1993). The Ordovician geological 107
units of the St. Lawrence Platform outcropping in the study area are the Nicolet Fm. and the Saint-108
Sabine les Fonds Fm. which consist of thick successions of mudstones with subordinate alternating 109
sandstone and siltstone. The outcropping terrains in the Appalachian Mountains correspond to 110
imbricated thrust sheets produced during the Taconian orogeny: green and red shales of the Sillery 111
Group; bedded black weathered shaly matrix containing chaotic blocks of cherts; sandstone of the 112
Etchemin River; and dolomitic schists of the West Sutton Formation. 113
Unconsolidated Quaternary sediments, derived from multiple glaciation-deglaciation cycles, 114
unconformly cover the Cambrian-Ordovician sequence of the St. Lawrence Lowlands (Lamothe 115
1989). Within the Appalachian Mountains, Quaternary deposits generally consist of relatively thin 116
layers of till deposited directly on the bedrock (Fig. 2). A more complex Quaternary stratigraphy is 117
found in the St. Lawrence Lowlands. A nearly continuous till sheet (Gentilly till) covers most of the 118
area between the overlain discontinuous marine and lacustrine silt (Lampsilis Lake silts) and clay 119
units of the Champlain Sea (9.8 to 11.2 ka) and the underlain discontinuous patches of sands 120
deposited during marine regressions (Vieilles Forges and Lotbinière sands; Lamothe 1989) with 121
thermo-luminescence measured ages of 44-50 ka (Godbout et al. 2013). Granular deposits thick 122
enough to form aquifers are present downstream of the basin, but have limited regional extents. 123
Marine clay deposits are found below 120 masl where they create increasingly confining conditions 124
for the bedrock aquifer towards the lower portion of the basin (see Fig. 3). 125
The regional aquifer is located in the fractured bedrock of the St. Lawrence Platform. This 126
aquifer is mainly unconfined in the Appalachian Mountains and in the Appalachian Piedmont, 127
progressively becoming semi-confined, north-westerly. In a 10 km wide zone bordering the 128
St. Lawrence River, the aquifer is confined by thick marine clays of the Champlain Sea that allow 129
limited recharge (Larocque et al. 2013). The bedrock aquifer within the study area has relatively 130
low hydraulic conductivity (~10−9 to 10−7 m/s). Wells in the fractured bedrock aquifers yield 131
enough water to supply single-family dwellings and small municipalities (~500 to 5,000 habitants). 132
Higher-yield aquifers (~10−3 to 10−4 m2/s) are found in coarse-grained surficial sediments, such as 133
the Quaternary glaciofluvial or fluvial sediments. These are often separated from the fractured 134
bedrock aquifer by a basal till unit (Becancour till; Lamothe 1989), which acts as an aquitard. 135
Regional groundwater flow is SE-NW and usually follows the topography, with recharge occurring 136
mainly in the Appalachian Mountains and discharge in the main tributaries of the St. Lawrence 137
River. Local recharge areas are also found in the St. Lawrence Lowlands, particularly in the 138
absence of Champlain Sea clays, along a band located just northwest of the Appalachian Piedmont. 139
Larocque et al. (2013) estimated the average regional recharge to be 159 mm/yr. 140
Land use is mainly forestry (48 %) and agricultural (40 %), with the significant presence of 141
wetlands (8 %) and few urban areas (4 %). Cereals and most intensive crops are found mainly along 142
the St. Lawrence and Becancour rivers, while the Appalachian valleys are associated with pastures 143
and dairy farms (see Larocque et al. 2013 for more information on land use). The average annual 144
temperature is 4.5°C, and the total precipitation is 1,100 mm/year, with 25% falling as snow 145
between November and March (Environment Canada 2012). 146
147
Analytical methods and groundwater sampling
148 149
A total of 84 open borehole bedrock wells (79 domestic or municipality wells and five drilled 150
observation wells) were sampled in July and August 2010. Well depths range from 8 to 144 m, with 151
a median depth of 38 m and only three wells deeper than 100 m (Table 1). This indicates that the 152
upper bedrock is the most productive zone and is probably the bedrock through which most of the 153
groundwater flows. In municipal wells, groundwater was collected directly at the wellhead. For 154
domestic wells, groundwater was collected at the closest water faucet, taking precaution to avoid 155
intermediate treatment installations. At each sampling site, purge time was set by monitoring the 156
groundwater chemo-physical parameters (conductivity, pH, Eh, and temperature) using a flow-157
through cell, until they stabilize. Groundwater was sampled in 250 ml PE bottles and filtered in situ 158
using disposable 0.45 µm nitrocellulose filters on 60 ml PE syringes. Samples for cation analyses 159
were acidified with HNO3. The samples were kept at 4°C until their analysis at the Maxxam 160
Laboratory in Montreal (Quebec, Canada). Major cations (Ca, Mg, Na) were analysed with ICP-161
MS, major anions (Cl and SO4) were analyzed by ionic chromatography, alkalinity as CaCO3 was 162
measured by titration method at pH 4.5. Finally, nitrate concentration was measured with the 163
hydrazine reduction method. Details of these analytical methods can be found in CEAEQ (2014). 164
165
DRASTIC index computation
166 167
The DRASTIC index (Aller et al. 1987) was computed using the usual seven parameters and 168
associated parametric weights and ratings: 169
170
DRASTIC index = D WD + R WR + A WA + S WS + T WT + I WI + C WC (eq. 1) 171
172
Where D is the depth to the water table, R is recharge, A is the aquifer lithology, S is the soil 173
type, T is the topography, I represents the impact of the vadose zone and C is the hydraulic 174
conductivity. Parameter weights are from Aller et al. (1987), i.e. WD=5, WR =4, WA=3, WS=2, WT=1, 175
WI=5, WC=3. 176
The DRASTIC index was computed as suggested by Aller et al. (1987) without any adaptation
177
of the usual method to the geological context or contaminant occurrence in groundwater in order to
178
neutrally apply the method. Depth to groundwater (D) was estimated by subtracting piezometric 179
levels from the digital elevation model (MRNF, 2008). Where the bedrock aquifer is confined, D 180
was set equal to the bedrock depth below unconsolidated sediments. Recharge (R) was determined 181
with a spatially-distributed water balance model with a 500 x 500 m resolution. Regional 182
piezometric surface and spatially distributed recharge to the bedrock were established by Larocque 183
et al. (2013). The bedrock aquifer lithology (A) was determined following Globensky (1987; 1993) 184
who reports detailed local stratigraphy of the Cambro-Ordovician St. Lawrence Platform and the 185
Appalachian Mountains. Soil type (S) was obtained from pedologic maps from IRDA (2012) which 186
provides information about soil granulometry and drainage capacity to be classified with the usual 187
DRASTIC ratings. The slope (T) was determined using a GIS treatment of a 10 m-cell resolution 188
digital elevation model (MRNF 2008). The impact of the vadose zone (I) was determined from 189
detailed Quaternary deposits maps from Godbout et al. (2011) which gives the type of granulometry 190
associated with clay, silts, sands and glacial tills. Parameter (I) for the bedrock aquifer was 191
determined from bedrock lithology description of Globensky (1987; 1993). Again, the classification 192
here refers to soils or bedrock type obtained from available maps of the study area and ratings were 193
directly associated to the typical ratings as defined by Aller et al. (1987). The bedrock hydraulic 194
conductivity (C) was set to the minimal ranking value of 1 for the entire study area since all field-195
measured hydraulic conductivities (Larocque et al. 2013) were lower than the threshold for C = 1. 196
197
Results and discussion
198
Regional hydrogeochemistry of the study area
199 200
Groundwater chemistry types were determined from the Piper diagram (Fig. 4). Fifty-six percent 201
of the samples belong to the Ca,Mg-HCO3, Ca-HCO3 and Ca-SO4 water types, mainly present in the 202
Appalachian region where unconfined conditions prevail (see Fig. 3). Thirty-nine percent of the 203
samples belong to the Na-HCO3 water type, representing semi-confined conditions in the flat, 204
central part of the study area to captive conditions in the downstream portion. Five percent of the 205
samples belong to the Na-Cl water type located in the lower portion of the aquifer. The Na-Cl water 206
type represents confined conditions and is associated to a mixing with trapped marine pore-water. 207
Charron (1978), Cloutier et al. (2008, 2010), Beaudry (2013) and Benoit et al. (2014) described 208
similar hydrogeochemical facies for other southern Quebec bedrock aquifers. 209
In the recharge area, groundwater chemistry is first controlled by the dissolution of carbonates 210
present in calcareous Quaternary deposits such as tills (Cloutier et al. 2010) and through the first 211
few meters of the fractured bedrock aquifer (Edmunds et al. 2003) which is here dominated by 212
calcareous shaly and silty deposits of Ordovician age (Globensky 1987). In the study area, 213
groundwater typically evolves from Ca,Mg-HCO3 water types with low but nearly equal 214
proportions of Na+ and Cl- (representing an initial load of Na-Cl from precipitation) and with equal 215
proportions of Ca2++Mg2+ and HCO3-+SO42- (from the initial congruent dissolution of calcareous, 216
dolomitic materials). Slower and deeper circulation, involving long-term water-rock interactions in 217
fractured aquifers, generally involves other processes such as incongruent dissolution of carbonates 218
and cation exchange (Edmunds 1987). For most of the samples taken in the Becancour bedrock 219
aquifer, cation exchange (Ca2+→Na+) appears to be the controlling process (Fig. 5), leading to the 220
relative enrichment of Na+ versus Cl- and relative depletion of Ca2++Mg2+ versus HCO3-+SO4 2-221
toward the evolution of groundwater to the Na-HCO3 type (Cloutier et al. 2010). Na+ is released in 222
groundwater by cationic exchange on the clay fraction, whereas Ca2+ is depleted from groundwater. 223
For samples with lower (Ca+Mg)/(Na+K) ratios, located in captive groundwater flow conditions, a 224
shift (grey circle Fig. 5) in the total cation content probably indicates a mixing with the seawater 225
end-member. In the study area, Na-Cl is released from marine clays or trapped Champlain Sea 226
seawater (Cloutier et al. 2010), and groundwater evolves to Na-Cl type. 227
Nitrate concentrations are relatively low, with a maximum value of 6.1 mg N-NO3/L (drinking 228
water limit 10 mg N-NO3/L; MDDEFP 2013) and not related to the well depth (Table 1). These 229
concentrations are similar to those reported in other studies from southern Quebec (MENV 2004). 230
Eleven wells (12.9%) mainly located in the Appalachian foothills, have concentrations exceeding 231
1 mg/L N-NO3 i.e. the anthropogenic background (Dubrovsky et al. 2010). Low nitrate 232
concentrations in the study area could be attributed to the high recharge rates (159 mm/yr, Larocque 233
et al. 2013) which induce significant dilution within the aquifer (Andrade et al., 2009). They could 234
also be due to the interception of nitrate-rich infiltrated water by agricultural drains (Qi et al. 2011), 235
and to denitrification (see further discussion below). 236
237
Hydrogeochemical Vulnerability Index
238 239
Considering the hydrogeochemical processes occurring in the study area, plotting the relative 240
differences of Na+-Cl- against (Ca2++Mg2+)-(HCO3-+SO42-) illustrates how groundwater 241
composition evolves from a Ca,Mg-HCO3 type in the recharge area to a Na-HCO3 type down-242
gradient with gradually increasing confinement conditions (R2=0.97; Fig. 6). A Hydrogeochemical 243
Vulnerability Index (HVI) from 1 to 10 was attributed to each of the water samples from its 244
orthogonal projection on the linear regression. The HVI identifies the highest vulnerability scores 245
for groundwater samples near the recharge area (Ca, Mg-HCO3, Ca-HCO3 and Ca-SO4 types). It 246
gradually decreases with increasing confinement conditions of the bedrock aquifer, thus changing to 247
Na-HCO3 type and then Na-Cl type. A HVI map was interpolated (inverse distance weighting) 248
using all the sampled wells (Fig. 7). The highest values of HVI are found in the Appalachian 249
Mountains (HVI above 8) and gradually decrease with the regional groundwater flow, as the 250
Quaternary deposits become thicker and/or more impermeable. Approaching the St. Lawrence 251
River, the least vulnerable areas (HVI between 1 and 5) correspond to the location of thick clay 252
deposits which confine the bedrock aquifer. The HVI generally reflects the bedrock aquifer 253
confinement conditions (see Fig. 3) but also locally highlights the discontinuities in confinement 254
that differ from the regional pattern. For example, the HVI shows probable local recharge areas 255
within dominantly confined conditions (HVI above 8), particularly downstream, in the northeastern 256
part of the basin and in the Appalachian Piedmont. 257
The HVI can be derived similarly for other hydrogeological contexts where calcareous 258
dissolution from recharge and Ca2+-Na+ cation exchange dominate the water chemistry. This is a 259
common pattern regarding the evolution of groundwater geochemistry composition along the 260
flowpaths (Edmunds 2003; Appelo and Postma 2005). The HVI is expected to be particularly 261
suitable in glacial hydro-geomorphological contexts, i.e. with the presence of calcareous materials 262
found in tills, in sedimentary bedrock rich in clay minerals, and under gradual confinement 263
conditions of the fractured aquifer with marine clays. The HVI was tested in other regions of the St. 264
Lawrence Lowlands in southern Quebec, taking advantage of newly available hydrogeochemical 265
datasets from the Nicolet and lower Saint-François watersheds (Larocque et al. 2015) and in the 266
Monteregie region (Carrier et al. 2013). For these regions, the HVI was built using the same ranges 267
of Na-Cl (y-axis) and Ca+Mg-HCO3-SO4 (x-axis) than for the current study area. HVI values larger 268
than 9 were found respectively for 83% and 89% of wells with detectable nitrate (above 0.1 mg N-269
NO3/L) (results not illustrated). In other geological and climatic contexts, it might be necessary to 270
modify the axes ranges of Fig. 6 to adjust to site-specific conditions. 271
The HVI provides integrative information on well vulnerability while being relatively 272
inexpensive to implement and easily computed. Similarly to other types of interpolated maps (e.g. 273
maps of hydrogeological contexts interpolated from local drilling data), the uncertainty related to 274
the interpolated surface is directly linked to data point density. For example, because municipal and 275
private wells are rare near the St. Lawrence River (due to high salinity groundwater), the 276
vulnerability map in the lower portion of the study area is more uncertain. In the case of local 277
groundwater contamination, the method may show heterogeneities related to anthropogenic sources 278
(e.g., Na-Cl pollution from de-icing road salts, surface water infiltration into a poorly maintained 279
well cap) rather than to the natural hydrogeological context. 280
281
DRASTIC vulnerability map
282 283
The calculated DRASTIC indices range from 33 to 179 (Fig. 8). This scope is comparable with 284
existing DRASTIC maps obtained in similar geomorphological contexts in southern Quebec 285
(Champagne 1990; Murat 2000). In the current study, the DRASTIC index in the Appalachians 286
indicates the simultaneous presence of medium (between 76 and 100) and high (between 126 and 287
150) aquifer vulnerability areas. Low groundwater levels on topographic ridges counterbalance high 288
recharge rates. Areas where the aquifer vulnerability is very high higher than 150) are characterized 289
by the presence of granular glaciofluvial deposits where the groundwater depth is shallow. These 290
are found in the valley bottom of the Becancour River in the eastern part of the study area. The 291
index is high (between 126 and 150) to very high (higher than 150) in the central part of study area 292
due to high groundwater levels in a flat topographic context, as well as to the presence of regressive 293
and aeolian sand deposits. In this part of the study area, recharge rates can be high but are 294
counterbalanced by the presence of silty deposits and peatlands (between 76 and 100) which lowers 295
parameters S (soils) and I (impact of the vadose zone). Low aquifer vulnerability areas (between 296
33 and 75) are located in the lower part of the basin where thick clay deposits are present. 297
It is not possible to integrate complex sequences of overlying Quaternary deposits when using 298
the DRASTIC index to estimate the vulnerability of a bedrock aquifer. This is due to the fact that it 299
uses only two parameters for the overlying unconsolidated sediments, i.e. one parameter for soil 300
type (S) and another parameter for the impact of the vadose zone (I). Recharge is usually the main 301
vector for solute transport through the vadose zone, as highlighted in other studies the importance 302
of recharge in aquifer vulnerability estimation (e.g.: Rupert, 2001, Nobre et al. 2007). This is 303
reflected in the index, where four out of seven parameters relate to infiltration and recharge 304
processes (R, S, T and I). On the DRASTIC map (Fig. 8), the most extended and vulnerable aquifer 305
zones are found in the Appalachian Piedmont, while hydrogeochemistry suggests that recharge 306
areas are predominantly located in the Appalachian Mountains. High aquifer vulnerability in this 307
area is caused by high S and I parameters in the presence of sandy soils. However, these regressive 308
and aeolian sands are often superficial deposits covering thick till deposits considered as aquitards. 309
This underlying till probably offers a good protection for the underlying bedrock aquifer, which is 310
not taken into account by the DRASTIC index. 311
312
Comparing HVI and DRASTIC indices
313 314
The two vulnerability indices (Fig. 7 and Fig. 8) do not show the same spatial distribution 315
because they do not integrate the same parameters. The HVI reflects a cumulative sequence of 316
hydrochemical processes, from the recharge area to the aquifer domain where renewal rates are low. 317
It can be considered as an integrated representation of the flow lines from the recharge area to the 318
pumped well, and reflects borehole vulnerability. The DRASTIC index is mostly based on 319
parameters responsible for vertical flows from the surface to the aquifer. It maps areas of potential 320
groundwater contamination and does not consider flow line distribution or convergence of diffuse 321
pollution to a well, nor does it take into account groundwater flow dynamics. For instance, an area 322
covered with impermeable sediment will be associated with a low DRASTIC index, but 323
groundwater at this site may be affected by contamination from neighbouring upstream vulnerable 324
areas where recharge occurs. 325
Nitrate is highly leachable in groundwater and is often chosen to trace anthropogenic impacts 326
on groundwater resource at regional scales (Rodriguez-Galiano 2014). It is also the contaminant 327
that most frequently exceeds drinking water standard (e.g. MENV, 2004; U.S. Environmental 328
Protection Agency, 2005; Stuart et al., 2007). However, because it is subject to denitrification, 329
nitrate is not a perfect tracer. Previous studies detailed the processes involved for denitrification due 330
to oxic/anoxic conditions (Korom, 1992, McMahon et al., 2003) which are associated to microbial 331
(McMahon et al., 2008) or pyrite reduction (Böhlke et al, 2002) in groundwater. In the current 332
study, denitrification rates were not estimated because of the density of sampling locations and 333
because of the relatively low nitrate concentrations measured. 334
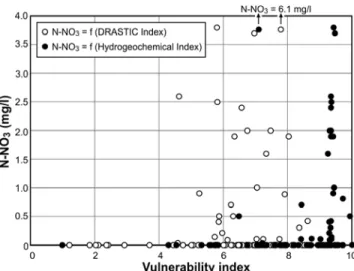
The HVI and DRASTIC indices were compared against measured nitrate concentrations to 335
estimate the predicting capacity of the vulnerability method (note: the HVI computation does not 336
include nitrate). The occurrence of nitrate in groundwater depends 1) on the spatial distribution of 337
non-point sources of contamination at the land surface, 2) on the capacity of nitrogen to be 338
mineralized and migrate vertically through the unsaturated zone towards the aquifer, and 3) on 339
groundwater flow paths within the saturated zone. Directly comparing the HVI and DRASTIC 340
vulnerability scores with the occurrence of nitrate therefore provides a means to evaluate how each 341
of these causes influences nitrate concentrations at a given well. To compare the two vulnerability 342
indices with the nitrate and within a single range, DRASTIC indices (from 33 to 179) were 343
linearized to values between 1 and 10 (Fig. 9). For samples with detected nitrate, the linearized 344
DRASTIC index ranges between 4.5 and 8.7 but does not show a gradual increase pattern with 345
nitrate concentrations. This result suggests that the DRASTIC index is relatively ineffective for 346
evaluating more and less vulnerable areas in the study area. In sharp contrast, the HVI shows a 347
consistent trend with the occurrence of nitrate within the Becancour area, with 82% of all wells 348
having detectable nitrate concentrations (above 0.1 mg N-NO3/L) having a vulnerability score of 349
greater than 9. 350
Because both methods estimate the intrinsic vulnerability, neither considers the presence of a 351
contaminant source at the surface and the difference between their capacities to identify the 352
presence of nitrate in groundwater is linked to one of the other two causes. The better 353
nitrate/vulnerability index correspondence for the HVI method is probably explained by the fact 354
that major ions geochemistry reflects groundwater flow dynamics which are not considered in 355
DRASTIC. The inclusion of parameters considered representative of contaminant migration 356
through the unsaturated zone is not sufficient for DRASTIC to identify correctly nitrate 357
concentrations. Using concentrations from other anthropogenic contaminants, performing tracer 358
tests or groundwater flow modelling on the studied aquifer would provide a more complete test of 359
the HVI method capacity to identify regional scale groundwater vulnerability. 360
361
Conclusions
362 363
The objective of this work was to test the potential of major ion chemistry to assess groundwater 364
vulnerability of a regional aquifer. A Hydrogeochemical Vulnerability Index (HVI) was developed 365
and applied to a southern Quebec fractured bedrock aquifer and results were compared to those of 366
the classical DRASTIC method, and to measured nitrate concentrations. 367
Major ion of groundwater samples evolve from Ca,Mg-HCO3 type in recharge areas to Na-HCO3 368
and Na-Cl type downgradient in the aquifer. Although relatively low, nitrate concentrations in 369
nearly 13% of the sampled wells show anthropogenic impacts from agricultural activities. The 370
proposed HVI integrates processes from both infiltration and groundwater flow dynamics, and 371
shows scores consistent with the occurrence of nitrate in groundwater. It also highlights local 372
discontinuities in confinement that differ from the regional pattern. Eighty-two percent of all 373
groundwater samples with detectable nitrate groundwater show a HVI close to the maximum value 374
of 10, a performance significantly better than that of the DRASTIC index. The poor correlation 375
between the DRASTIC index and the nitrate concentration in groundwater is probably due to the 376
fact that the DRASTIC method does not include groundwater flow dynamics. 377
This work shows that major ion geochemistry contains significant information about intrinsic 378
well vulnerability. This inexpensive and easily implemented method is transferrable to similar 379
geological contexts but would need to be adapted if carbonate dissolution and cation exchange are 380
not the main hydrogeochemical processes which control the groundwater composition locally and 381
regionally. It would also need to be tested using concentrations of other anthropogenic 382
contaminants and confronted to other vulnerability methods. Combining the hydrogeochemical 383
vulnerability method with the mapping of non-point sources of anthropogenic pollution at the land 384
surface may contribute a real support tool for groundwater integrated resource-protecting policies. 385
386
Acknowledgments
387 388
We wish to thank an anonymous reviewer for his careful review and suggestions that greatly 389
improved the manuscript. The authors thank the Quebec Ministry of Environment (Ministère du 390
Développement durable, de l’Environnement et de la Lutte contre les changements climatiques), the
391
Becancour River Watershed organization (organisme de bassin versant GROBEC) and the 392
municipalities that have participated in financing and supporting this research. 393
394 395
References
396 397
Aller L, Bennett T, Lehr JH, Petty RJ, Hackett G (1987) DRASTIC: A Standardized System for 398
Evaluating Groundwater Pollution Potential Using Hydrogeologic Settings. EPA-600/2-87-035, 399
20 p. 400
Andrade AIASS, Stigter TY (2009) Multi-method assessment of nitrates and pesticides 401
contamination in shallow alluvial groundwater as a function of hydrogeologic setting and land 402
use. Agr Water Manage 96:1751–1765. 403
Appelo CAJ, Postma D (2005) Geochemistry, Groundwater and Pollution, 2nd ed. A.A. Balkema 404
Publishers, Leiden, The Netherlands, 649 p. 405
Barbecot F, Marlin C,.Gibert E, Dever L (2000) Hydrochemical and isotopic characterisation of the 406
Bathonian and Bajocian coastal aquifer of the Caen area (northern France). App Geochem 15, 407
6:791-805. 408
Beaudry C (2013) Hydrogéochimie de l'aquifère rocheux régional en Montérégie est, Québec. MSc 409
thesis, INRS-ETE, Université du Québec, Québec, Canada, 210 p. Access to the geochemical 410
dataset online : http://sdis.inrs.ca/ (in French) 411
Benoit N, Nastev M, Blanchette D, Molson J (2014) Hydrogeology and hydrogeochemistry of the 412
Chaudière River watershed aquifers, Quebec, Canada. Can Water Resour J 39:1:32-48. 413
Bojórquez-Tapia A, Cruz-Bello GM, Luna-González L, Juárez L, Ortiz-Pérez MA (2009) V-414
DRASTIC: using visualization to engage policymakers in groundwater vulnerability assessment. 415
J Hydrol 373: 242–255. 416
Böhlke, JK, Wanty, R, Tuttle, M, Delin, G, Landon, M (2002) Denitrification in the recharge area 417
and discharge area of a transient agricultural nitrate plume in a glacial outwash sand aquifer, 418
Minnesota. Water Resour. Res. 38:7, doi: 10.1029/2001WR000663. 419
Carrier MA, Lefebvre R, Rivard C, Parent M, Ballard JM, Benoit N, Vigneault H, Beaudry C, 420
Malet X, Laurencelle M, Gosselin JS, Ladevèze P, Thériault R, Beaudin I, Michaud A, Pugin A, 421
Morin R, Crow H, Gloaguen E,Bleser J, Martin A, Lavoie D (2013) Portrait des ressources en 422
eau souterraine en Montérégie Est, Québec, Canada. Projet réalisé conjointement par l'INRS, la 423
CGC, l'OBV Yamaska et l'IRDA dans le cadre du Programme d'acquisition de connaissances 424
sur les eaux souterraines,rapport final INRS R-1433, soumis en juin 2013, 312p. (in French) 425
CEAEQ (Centre d’expertise en analyse environnementale du Québec) (2014) Les méthodes 426
d’analyses en usage au Centre d’expertise en analyse environnementale. On-line :http:// 427
www.ceaeq.gouv.qc.ca/methodes/methode_index.htm 428
Champagne L (1990) Vulnérabilité des eaux souterraines à la pollution : M.R.C. de Montcalm. MSc 429
thesis, Université de Montréal, Québec, Canada, 80 p. (in French) 430
Charron JE (1978) Hydrogeochemical Study of Groundwater Flow in the Interstream Area between 431
the Ottawa and St. Lawrence Rivers. Environment Canada, Water Resource Branch, Scientific 432
series NO.76. 45 p. 433
Chen SK, Jang CS, Peng YP (2013) Developing a probability-based model of aquifer vulnerability 434
in an agricultural region. J Hydrol 486:494–504. 435
Chowdhury SH, Kehew AE, Passero RN (2003) Correlation between nitrates contamination and 436
groundwater pollution potential. Groundwater 41:735-745. 437
Cloutier V, Lefebvre R, Therrien R, Savard MM (2008) Multivariate statistical analysis of 438
geochemical data as indicative of the hydrogeochemical evolution of groundwater in a 439
sedimentary rock aquifer system. J Hydrol 353:294-313. 440
Cloutier V, Lefebvre R, Therrien R, Savard MM (2010) Desalination of a sedimentary rock aquifer 441
system invaded by Pleistocene Champlain Sea water and processes controlling groundwater 442
geochemistry. Environ Earth Sci 59:977-994. 443
Dubrovsky NM, Burow KR, Clark GM, Gronberg JM, Hamilton PA, Hitt KJ, Mueller DK, Munn 444
MD, Nolan BT, Puckett LJ, Rupert MG, Short TM, Spahr NE, Sprague LA, Wilber WG (2010) 445
The quality of our Nation’s waters—Nutrients in the Nation’s streams and groundwater, 1992– 446
2004. U.S. Geological Survey Circular 1350, 174 p. 447
Edmunds WM, Shand P, Hart P, Ward RS (2003) The natural (baseline) quality of groundwater: a 448
UK pilot study. The Sci Total Environ 310:25-35. 449
Edmunds WM, Cook JM, Darling WG, Kinniburgh DG, Miles DL, Bath AH, Morganjones M, 450
Andrews JN (1987) Baseline geochemical conditions in the Chalk aquifer, Berkshire, U.K: a 451
basis for groundwater quality management. App Geochem, 2:251-274. 452
Environment Canada (2012) Canadian climate normals 1971-2000 for Laurierville, Québec. On-453
line:http://climate.weather.gc.ca/climate_normals/index_e.html 454
EPA (Environmental Protection Agency) (1993) A review of methods for assessing aquifer 455
sensitivity and groundwater vulnerability to pesticide contamination. EPA-813-R-93002, 147 p. 456
Frind EO, Molson JW, Rudolph DL (2006) Well Vulnerability: A Quantitative Approach for 457
Source Water Protection. Groundwater 44:732-742. 458
Globensky Y (1987) Géologie des Basses-Terres du Saint-Laurent, Québec. Ministère des 459
Richesses Naturelles du Québec 63 (v. MM 85-02). (in French). 460
Globensky Y (1993) Lexique stratigraphique canadien. Volume V-B: région des Appalaches, des 461
Basses-Terres du Saint-Laurent et des Iles de la Madeleine. Ministère de l’Énergie et des 462
Ressources et Direction Générale de l’Exploration géologique et minérale, p. 327, DV 91e23. 463
(in French). 464
Godbout PM, Lamothe M, Horoi V, Caron O (2011) Synthèse stratigraphique, cartographie des 465
dépôts quaternaires et modèle hydrostratigraphique régional, secteur de Bécancour, Québec: 466
Rapport final. Report presented to the Ministère des Ressources naturelles, 37 p. (in French). 467
IRDA (Institut de recherche et de développement en agroenvironnement) (2012) Feuillets 468
pédologiques numériques 1 : 20 000: 21L12, 21L06, 21L05, 21L04, 21L03, 31I09, 31I08, 469
31I07, 31I02, 31I01. 470
Korom, SF (1992) Natural denitrification in the saturated zone: a review.Water Resour. Res., 28, 471
1657– 1668. 472
Kozuskanich JC, Novakowski KS, Anderson BC, Crowe AS, Balakrishnan YK (2014) 473
Anthropogenic Impacts on a Bedrock Aquifer at the Village Scale. Groundwater 52:474–486. 474
Lamothe M (1989) A new framework for the Pleistocene stratigraphy of the central St. Lawrence 475
Lowland, southern Quebec. Géographie Physique et Quarternaire 43:119-129. 476
Larocque M, Gagné S, Barnetche D, Meyzonnat G, Graveline MH, Ouellet MA (2015) Projet de 477
connaissance des eaux souterraines du bassin versant de la zone Nicolet et de la partie basse de 478
la zone Saint-François. Rapport scientifique. Report submitted to the Ministère du 479
Développement durable, de l’Environnement et de la Lutte contre les changements climatiques. 480
260 p. (in French) 481
Larocque M, Gagné S, Tremblay L, Meyzonnat G (2013) Projet de connaissance des eaux 482
souterraines du bassin versant de la rivière Becancour et de la MRC de Becancour - Rapport 483
scientifique. Report submitted to the Ministère du Développement durable, de l’Environnement, 484
de la Faune et des Parcs, 213 p. (in French). 485
McMahon, PB, Böhlke, JK, Kauffman, LJ, Kipp, KL, Landon, MK, Crandall, CA, Burow, KR, 486
Brown, CJ (2008) Source and transport controls on the movement of nitrate to public supply 487
wells in selected principal aquifers of the United States, Water Resour. Res. 44, W04401, 488
doi:10.1029/2007WR006252. 489
McMahon, PB, Böhlke, Christenson, SC (2004) Geochemistry, radiocarbon ages, and 490
paleorecharge conditions along a transect in the central High Plains aquifer, southwestern 491
Kansas, USA. App Geochem, 19:1655-1686. 492
Mansoor A, Baloch MA, Sahar L (2014) Development of a Watershed-Based Geospatial 493
Groundwater Specific Vulnerability Assessment Tool. Groundwater 52:137-147. 494
MDDEFP (Ministère du Développement durable, de l'Environnement, de la Faune et des Parcs). 495
(2013) Règlement sur la qualité de l'eau potable. c. Q-2, r. 40. 496
http://www2.publicationsduquebec.gouv.qc.ca/ (in French). 497
Mendizabal I, Stuyfzand PJ (2011) Quantifying the vulnerability of well fields towards 498
anthropogenic pollution: The Netherlands as an example. J Hydrol 398:260-276. 499
Mehnert E, Keefer DA, Dey WS, Wehrmann HA, Wilson SD, Ray C (2005) Aquifer sensitivity to 500
pesticide leaching: testing a soil and hydrogeologic index method. Groundwater Monitoring & 501
Remediation 25:60–67. 502
MENV (Ministère de l’Environnement) (2004) Étude de la qualité de l’eau potable dans sept 503
bassins versants en surplus de fumier et impacts potentiels sur la santé. Ministère de 504
l’Environnement du Québec, Québec, Canada, Envirodoq ENV/2004/0312. 137p. (in French). 505
MRNF (Ministère des Ressources naturelles et de la Faune) (2008) Digital elevation model 506
1:20 000, 21L12, 21L06, 21L05, 21L04, 21L03, 31I09, 31I08, 31I07, 31I02, 31I01. Ministère 507
des Ressources naturelles et de la Faune. 508
Murat V (2000) Étude comparative des méthodes d’évaluation de la vulnérabilité intrinsèque des 509
aquifères à la pollution: application aux aquifères granulaires du piémont Laurentien. MSc 510
thesis, INRS-ETE, Université du Québec, Québec, Canada, 291 p. (in French). 511
Nobre RCM, Filho OCR, Mansur WJ, Consenza CAN (2007) Groundwater vulnerability and risk 512
mapping using GIS modeling and and a fuzzy logic tool. J Contam Hydrol 94:277-292. 513
Qi Z, Helmers MJ, Christianson RD, Pederson CH (2011) Nitrate-nitrogen losses through 514
subsurface drainage under various agricultural land covers. J Environ Qual 40:1578-85. 515
Rodriguez-Galiano V, Mendes MP, Garcia-Soldado MJ, Chica-Olmo M, Ribeiro L (2014) 516
Predictive modeling of groundwater nitrate pollution using Random Forest and multisource 517
variables related to intrinsic and specific vulnerability: A case study in an agricultural setting 518
(Southern Spain). Sci Total Environ 476–477, 189–206. 519
Rupert, MG (2001) Calibration of the DRASTIC groundwater vulnerability mapping method. 520
Groundwater 39:625-630. 521
Saeedi M, Abessi O, Sharifi F, Meraji H (2009) Development of groundwater quality index. 522
Environ Monit Assess 163, 327-335. 523
Saidi S, Bouri S, Ben Dhia H (2010) Groundwater vulnerability and risk mapping of the Hajeb-524
jelma aquifer (Central Tunisia) using a GIS-based DRASTIC model. Environ Earth Sci 525
59:1579–1588 526
Sorichetta A, Ballabio C, Masetti M, Robinson GR, Sterlacchini S (2013) A Comparison of Data-527
Driven Groundwater Vulnerability Assessment Methods. Groundwater 51: 866–879. 528
Stigter TY, Ribeiro L, Carvalho Dill AMM (2008) Building factorial regression models to explain 529
and predict nitrates concentrations in groundwater under agricultural land. J Hydrol 357:42-56. 530
Stuart ME, Chilton PJ, Kinniburgh DG, Cooper DM (2007) Screening for long-term trends in 531
groundwater nitrate monitoring data. Quarterly Journal of Engineering Geology and 532
Hydrogeology 40:361–376. 533
Tilahun K, Merket BJ (2010) Assessment of groundwater vulnerability to pollution in Dire Dawa, 534
Ethiopia using DRASTIC. Environ Earth Sci 59:1485–1496 535
United Nations Environment Programme (2003) Groundwater and its susceptibility to degradation: 536
A global assessment of the problem and options for management, ISBN: 92-807-2297-2. 140 p. 537
U.S. Environmental Protection Agency (2005) Factoids: Drinking Water and Ground Water 538
Statistics for 2004, EPA 816-K-05-001, 15 p. 539
Van Stempvoort D, Ewert L, Wassenaar L (1992) AVI: A Method for Groundwater Protection 540
Mapping in the Prairie. Provinces of Canada. Prairie Provinces Water Board Report No. 114. 541
Vrba J, Zoporozec A (1994) Guidebook on Mapping Groundwater Vulnerability. IAH International 542
Contribution for Hydrogegology, Hannover, Germany, 160 p. 543
Yu C, Yao Y, Cao, G, Zheng, C (2014) A field demonstration of groundwater vulnerability 544
assessment using transport modeling and groundwater age modeling, Beijing Plain, China. 545
Environ Earth Sci DOI 10.1007/s12665-014-3769-5 546
Zhou J, Li Q, Guo Y, Guo X, Li X, Zhao Y, Jia R (2012) VLDA model and its application in 547
assessing phreatic groundwater vulnerability: a case study of phreatic groundwater in the plain 548
area of Yanji County, Xinjiang, China. Environ Earth Sci 67:1789–1799 549
550
551
Fig. 1. The Becancour watershed with location of the cross section of Fig. 2.
552
553
554
Fig. 2. SE-NW geological cross section of the Becancour watershed.
555
557
Fig. 3. Groundwater types and bedrock aquifer confinement conditions.
558 559
560
Fig. 4. Piper tri-linear plot of groundwater samples.
562
Fig. 5. Cationic exchange evidence in groundwater.
563
564
565
Fig. 6. The Hydrogeochemical Vulnerability Index (HVI).
566
568
Fig. 7. Vulnerability map obtained using the Hydrogeochemical Vulnerability Index (HVI).
569 570 571
572
Fig. 8. Vulnerability map obtained using the DRASTIC index (DI).
573 574 575
576
Fig. 9. Comparison of vulnerability maps with measured nitrate concentrations.
577 578
579
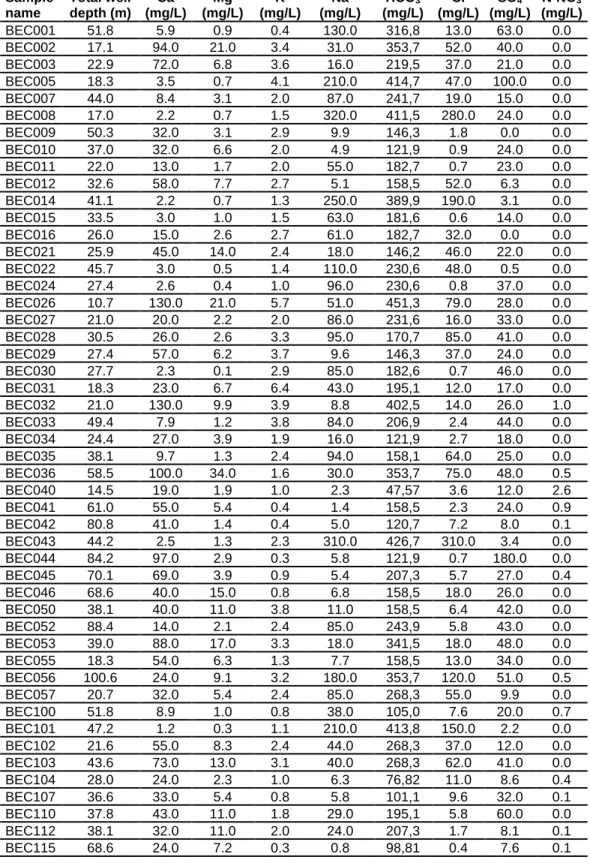
Table 1. Hydrogeochemical data
580 Sample name Total well depth (m) Ca (mg/L) Mg (mg/L) K (mg/L) Na (mg/L) HCO3 (mg/L) Cl (mg/L) SO4 (mg/L) N-NO3 (mg/L) BEC001 51.8 5.9 0.9 0.4 130.0 316,8 13.0 63.0 0.0 BEC002 17.1 94.0 21.0 3.4 31.0 353,7 52.0 40.0 0.0 BEC003 22.9 72.0 6.8 3.6 16.0 219,5 37.0 21.0 0.0 BEC005 18.3 3.5 0.7 4.1 210.0 414,7 47.0 100.0 0.0 BEC007 44.0 8.4 3.1 2.0 87.0 241,7 19.0 15.0 0.0 BEC008 17.0 2.2 0.7 1.5 320.0 411,5 280.0 24.0 0.0 BEC009 50.3 32.0 3.1 2.9 9.9 146,3 1.8 0.0 0.0 BEC010 37.0 32.0 6.6 2.0 4.9 121,9 0.9 24.0 0.0 BEC011 22.0 13.0 1.7 2.0 55.0 182,7 0.7 23.0 0.0 BEC012 32.6 58.0 7.7 2.7 5.1 158,5 52.0 6.3 0.0 BEC014 41.1 2.2 0.7 1.3 250.0 389,9 190.0 3.1 0.0 BEC015 33.5 3.0 1.0 1.5 63.0 181,6 0.6 14.0 0.0 BEC016 26.0 15.0 2.6 2.7 61.0 182,7 32.0 0.0 0.0 BEC021 25.9 45.0 14.0 2.4 18.0 146,2 46.0 22.0 0.0 BEC022 45.7 3.0 0.5 1.4 110.0 230,6 48.0 0.5 0.0 BEC024 27.4 2.6 0.4 1.0 96.0 230,6 0.8 37.0 0.0 BEC026 10.7 130.0 21.0 5.7 51.0 451,3 79.0 28.0 0.0 BEC027 21.0 20.0 2.2 2.0 86.0 231,6 16.0 33.0 0.0 BEC028 30.5 26.0 2.6 3.3 95.0 170,7 85.0 41.0 0.0 BEC029 27.4 57.0 6.2 3.7 9.6 146,3 37.0 24.0 0.0 BEC030 27.7 2.3 0.1 2.9 85.0 182,6 0.7 46.0 0.0 BEC031 18.3 23.0 6.7 6.4 43.0 195,1 12.0 17.0 0.0 BEC032 21.0 130.0 9.9 3.9 8.8 402,5 14.0 26.0 1.0 BEC033 49.4 7.9 1.2 3.8 84.0 206,9 2.4 44.0 0.0 BEC034 24.4 27.0 3.9 1.9 16.0 121,9 2.7 18.0 0.0 BEC035 38.1 9.7 1.3 2.4 94.0 158,1 64.0 25.0 0.0 BEC036 58.5 100.0 34.0 1.6 30.0 353,7 75.0 48.0 0.5 BEC040 14.5 19.0 1.9 1.0 2.3 47,57 3.6 12.0 2.6 BEC041 61.0 55.0 5.4 0.4 1.4 158,5 2.3 24.0 0.9 BEC042 80.8 41.0 1.4 0.4 5.0 120,7 7.2 8.0 0.1 BEC043 44.2 2.5 1.3 2.3 310.0 426,7 310.0 3.4 0.0 BEC044 84.2 97.0 2.9 0.3 5.8 121,9 0.7 180.0 0.0 BEC045 70.1 69.0 3.9 0.9 5.4 207,3 5.7 27.0 0.4 BEC046 68.6 40.0 15.0 0.8 6.8 158,5 18.0 26.0 0.0 BEC050 38.1 40.0 11.0 3.8 11.0 158,5 6.4 42.0 0.0 BEC052 88.4 14.0 2.1 2.4 85.0 243,9 5.8 43.0 0.0 BEC053 39.0 88.0 17.0 3.3 18.0 341,5 18.0 48.0 0.0 BEC055 18.3 54.0 6.3 1.3 7.7 158,5 13.0 34.0 0.0 BEC056 100.6 24.0 9.1 3.2 180.0 353,7 120.0 51.0 0.5 BEC057 20.7 32.0 5.4 2.4 85.0 268,3 55.0 9.9 0.0 BEC100 51.8 8.9 1.0 0.8 38.0 105,0 7.6 20.0 0.7 BEC101 47.2 1.2 0.3 1.1 210.0 413,8 150.0 2.2 0.0 BEC102 21.6 55.0 8.3 2.4 44.0 268,3 37.0 12.0 0.0 BEC103 43.6 73.0 13.0 3.1 40.0 268,3 62.0 41.0 0.0 BEC104 28.0 24.0 2.3 1.0 6.3 76,82 11.0 8.6 0.4 BEC107 36.6 33.0 5.4 0.8 5.8 101,1 9.6 32.0 0.1 BEC110 37.8 43.0 11.0 1.8 29.0 195,1 5.8 60.0 0.0 BEC112 38.1 32.0 11.0 2.0 24.0 207,3 1.7 8.1 0.1 BEC115 68.6 24.0 7.2 0.3 0.8 98,81 0.4 7.6 0.1
BEC116 45.7 26.0 7.2 1.2 3.1 98,81 4.8 9.3 2.4 BEC119 45.7 21.0 6.9 2.6 53.0 170,7 43.0 0.0 0.0 BEC120 68.6 21.0 7.5 2.2 96.0 292,6 34.0 17.0 0.0 BEC121 99.1 3.3 0.9 1.8 270.0 512,2 150.0 0.0 0.0 BEC122 38.1 29.0 13.0 4.4 60.0 317,1 3.3 1.0 0.0 BEC123 54.9 45.0 3.1 1.1 5.3 115,8 5.3 32.0 0.3 BEC126 49.1 25.0 6.2 0.9 27.0 134,1 26.0 7.6 0.0 BEC127 25.9 30.0 1.4 0.4 3.4 79,29 5.4 11.0 1.9 BEC129 61.0 36.0 4.0 1.5 47.0 207,3 23.0 22.0 0.1 BEC130 91.4 150.0 22.0 2.4 16.0 426,9 34.0 93.0 0.0 BEC131 22.9 30.0 8.0 0.4 3.0 117,1 2.2 9.7 2.0 BEC132 38.1 39.0 10.0 1.4 2.1 134,1 3.0 20.0 3.8 BEC134 38.1 97.0 7.0 2.8 6.6 256,1 6.1 63.0 2.0 BEC135 44.2 54.0 6.1 1.0 3.8 170,7 1.9 18.0 1.9 BEC137 23.7 5.1 0.4 1.6 85.0 219,5 9.4 29.0 0.0 BEC138 32.0 42.0 3.3 1.4 6.0 158,5 2.7 2.4 0.0 BEC139 48.8 0.1 0.0 0.1 88.0 95,13 11.0 100.0 6.1 BEC140 33.5 28.0 1.6 1.6 1.0 100,0 0.2 5.0 0.2 BEC142 68.6 44.0 13.0 1.2 8.3 195,1 8.0 16.0 1.6 BEC143 51.2 30.0 2.1 0.4 4.5 108,5 0.5 19.0 0.0 BEC144 8.2 100.0 17.0 6.2 21.0 439,1 11.0 40.0 0.0 BEC145 13.7 35.0 18.0 8.0 71.0 304,9 53.0 22.0 0.0 BEC146 30.5 35.0 9.3 2.3 31.0 219,5 9.0 17.0 0.0 BEC149 54.9 50.0 4.0 2.0 15.0 195,1 5.7 14.0 0.1 BEC160 144.8 41.0 2.1 1.0 4.5 113,4 9.5 7.4 3.7 BEC161 8.5 33.0 3.5 1.6 15.0 146,3 4.1 14.0 0.0 BEC165 106.7 220.0 31.0 3.5 500.0 426,9 1100.0 74.0 0.9 BEC166 73.2 20.0 6.9 3.9 210.0 451,0 120.0 36.0 0.0 ROC01 30.0 13.0 2.0 0.6 3.4 31,71 2.2 9.5 2.5 ROC03 78.3 24.0 9.4 6.8 820.0 340,9 970.0 3.0 0.0 ROC04 36.6 6.8 3.3 0.8 85.0 206,5 2.4 33.0 0.0 ROC05 47.2 1.9 0.5 1.6 140.0 365,2 3.0 16.0 0.0 ROC06 42.7 1.6 0.9 2.3 60.0 133,0 0.7 22.0 0.0 ROC08 43.5 3.8 0.6 0.8 64.0 157,9 0.5 6.6 0.0 ROC09 35.7 3.1 2.6 3.4 590.0 828,8 420.0 7.5 0.0 581