HAL Id: hal-00304812
https://hal.archives-ouvertes.fr/hal-00304812
Submitted on 8 Feb 2006
HAL is a multi-disciplinary open access
archive for the deposit and dissemination of
sci-entific research documents, whether they are
pub-lished or not. The documents may come from
teaching and research institutions in France or
abroad, or from public or private research centers.
L’archive ouverte pluridisciplinaire HAL, est
destinée au dépôt et à la diffusion de documents
scientifiques de niveau recherche, publiés ou non,
émanant des établissements d’enseignement et de
recherche français ou étrangers, des laboratoires
publics ou privés.
height and geochemical analysis of the structural
controls on the subdivision of a major aquifer, the
Sherwood Sandstone, Merseyside, UK
E. A. Mohamed, R. H. Worden
To cite this version:
E. A. Mohamed, R. H. Worden. Groundwater compartmentalisation: a water table height and
geo-chemical analysis of the structural controls on the subdivision of a major aquifer, the Sherwood
Sand-stone, Merseyside, UK. Hydrology and Earth System Sciences Discussions, European Geosciences
Union, 2006, 10 (1), pp.49-64. �hal-00304812�
SRef-ID: 1607-7938/hess/2006-10-49 European Geosciences Union
Earth System
Sciences
Groundwater compartmentalisation: a water table height and
geochemical analysis of the structural controls on the subdivision of
a major aquifer, the Sherwood Sandstone, Merseyside, UK
E. A. Mohamed and R. H. Worden
Department of Earth and Ocean Sciences, University of Liverpool, 4, Brownlow Street, Liverpool, L69 3GP, UK Received: 19 April 2005 – Published in Hydrology and Earth System Sciences Discussions: 10 June 2005 Revised: 26 October 2005 – Accepted: 3 December 2005 – Published: 8 February 2006
Abstract. Compartmentalisation, the subdivision of an aquifer into discrete and relatively isolated units, may be of critical importance for the protection of groundwater al-though it has been largely ignored in the groundwater litera-ture. The Lower Triassic Sherwood Sandstone, in north west of England, UK, may be a good example of an aquifer that has been compartmentalised by numerous high angle faults with displacements of up to 300 m. The study was initiated to assess the local groundwater flow, the extent of seawater invasion and the controls on recharge in the aquifer and to try to understand whether the aquifer is broken into discrete compartments.
Maps and schematic cross-sections of groundwater heads for the years 1993, and 2002 were prepared to trace any structural controls on the groundwater heads across the area. Studying the contour maps and cross sections revealed that: 1) there are substantial differences in groundwater head across some of the NNW-SSE trending faults implying that groundwater flow is strongly limited by faults, 2) an anticline in the east of the area acts as a groundwater divide and 3) the groundwater head seems to follow the topography in some places, although steep changes in groundwater head occur across faults showing that they locally control the ground-water head. The aquifer was thus provisionally subdivided into several hydrogeological sub-basins based on groundwa-ter head patgroundwa-terns and the occurrence of major structural fea-tures (faults and a fold).
Using groundwater geochemistry data, contour maps of chloride and sulphate concentration largely support the struc-tural division of the area into hydrogeological sub-basins. Scrutiny of groundwater geochemical data, averaged for each sub-basin, confirmed the degree of compartmental-isation and the occurrence of sealed faults. The variation of the geochemical composition of the groundwater not only re-Correspondence to: E. A. Mohamed
lates to the different, localised geochemical processes and seawater intrusion but also relates to compartmentalisation due to faulting. Faults have limited the degree of mixing between the groundwater types thus retaining the specific characteristics of each sub-basin. Highly localised seawa-ter intrusion is mainly controlled by low permeability fault close to the Irish Sea and Mersey estuary. There is effec-tively no invasion of seawater beyond the faults that lie clos-est to the coastline. Freshwater recharge to the aquifer seems to be highly localised and mainly occurs by vertical percola-tion of rain and surface water rather than whole aquifer-scale groundwater flow. This study provides a detailed understand-ing of the groundwater flow processes in Liverpool as an ex-ample of methods can be applied to groundwater manage-ment elsewhere.
1 Introduction
Groundwater locally provides more than 75% of public wa-ter supply in the UK and >35% in England and Wales as a whole. Protecting groundwater supplies is important in in-dustrialised areas; understanding recharge and how, and in what direction, water moves within an aquifer are important steps in developing long term practical strategies. There-fore, much work has focused on the protection of water sup-plies by determining the areas contributing recharge to water-supply wells and by specifying regulations to minimize the opportunity for contamination of the recharge water by ac-tivities at the land surface (Reilly and Pollock, 1993). A key issue in this study is the degree of aquifer subdivision, known as compartmentalisation, into discrete portions sepa-rated by low permeability barriers. Compartmentalisation in aquifers may be a result of faulting where fault zones typi-cally have low permeability due to a combination of catacla-sis and entrainment of clay minerals on the fault plane result-ing in fault gouge. The thickness and degree of permeability
Ormiskirk Sandstone Fm Wilmslow Fm Chester Pebble Fm Sh e rw o od S a nd st o n e T r ia ssi c Dip Mercia Mudstone Manchester Marl Fm Collyhurst Fm erP m ia n Carboniferous Fault line Fold
The study area
Permian & Triassic Sand stone s 0 5km 0 C ro xte th fau lt E cc le st o n e fa u lt Cross fault C rosb y fa ult K irk d al e fa u lt River Mersey Liverpool L iv erpo ol B ay 4 Inc e B lu nd ell fa u lt Wirral B o u n d ar y f a u lt H illho u se fa ul t C A Kno wsle y A ntic line L ith erla nd fa u lt Formby Cr o xt e th f a u lt 8 1 3 5
Figure 1 (new version)
Fig. 1. Maps of hydrogeologically important aspects of the area around Liverpool.
of fault zones tends to increase with the extent of fault dis-placement. Compartmentalisation is important since it fun-damentally controls how different parts of an aquifer are con-nected and how, and in what direction, groundwater moves within an aquifer.
Compartmentalisation of fluid-bearing porous and per-meable rocks has been a subject of great interest in the petroleum industry since understanding the degree of seg-mentation of oil fields has a major impact on production strategies (e.g. Smalley and England, 1992, 1994; Smalley et al., 1995). Compartmentalisation broadly occurs due to a combination of impermeable faults, interbedded permeable and impermeable rock units, lateral pinch-out of permeable sedimentary units. The degree of oilfield compartmentalisa-tion has been assessed using a combinacompartmentalisa-tion of structural ge-ology, sedimentge-ology, fluid pressure analysis and fluid geo-chemical differences (e.g. Smalley and England, 1992, 1994; Smalley et al., 1995). There has been much less attention paid to the occurrence of compartmentalised groundwater-bearing aquifers. While the main driver for the study of com-partmentalised petroleum accumulations is the maximisation of profit, the driver for the study of the compartmentalisation
of groundwater aquifers is the protection of resources and observance of ever-stricter environmental legislation.
The objective of this study is to apply some of the con-ceptual approaches adopted by the petroleum industry to as-sess the degree of compartmentalisation of a locally impor-tant aquifer in the UK: the Triassic Sherwood Sandstone. We will assess potential compartments within the aquifer using geological and groundwater head maps and then test these initial ideas using geochemical data. The key scientific ques-tions being addressed are:
1. Is the Sherwood Sandstone (the UK’s most important aquifer) a “tank of sand” in the Merseyside area (an im-plicit assumption in the hydrogeological map of Lewis et al., 1989), or is it split into separate compartments or sub-basins?
2. Is it possible to use groundwater head data and water geochemical data to define separate compartments or sub-basins within an aquifer?
The study area is located in the industrially important and populous north west of England and encompasses the ur-ban area of Liverpool (Fig. 1). The intensively investigated
Table 1. Regional stratigraphy of the bedrock underlying Liverpool and Greater Merseyside. Adapted from University of Birmingham, 1984
and Tellam, 1994.
System Stage Lithostratigraphical Division Previous Division Thickness m Hydrogeological characters
Quaternary Flandrian
Soil
1>−35 Aquiclude
Alluvium
Terrace deposits (sands and gravels) Shirdley Hill Sand Formation (blown sand)
Devensian Stockport Formation (till with glacial sands) 10–50 Aquiclude
Triassic
Anisian Mersey Mudstone Mudstone unit Keuper Marl 405 Aquiclude
Group Tarporley Siltstone Fm Keuper Waterstone 30–60 Aquiclude
Scythian Sherwood Sandstone
Ormskirk Sandstone Fm Keuper Sandstone 181–295 Aquifer
Group
Wilmslow Sandstone Fm U. Mottled Sandstone 205–480 Aquifer
Chester Pebble Beds Fm.
Bunter Pebble Beds 316–375 Aquifer
Pebble Beds Unit
L. Mottled Sandstone Unit L. Mottled Sandstone 0–>80 Aquifer
Permian Upper Bold/Manchester Marl Fm Manchester Marl 10–225 Mixed aquifer-aquiclude
Lower Collyhurst Sandstone Fm Collyhurst Sandstone 283–720 Aquifer
Carboniferous Westphalian Stages A–D >1500 Aquiclude
area extends from Widnes to Liverpool and as far north as Formby.
Despite the local and national importance of the Sherwood Sandstone aquifer, few previous studies substantially men-tioned the roles of lithology and geological structure as con-trols on groundwater geochemistry.
The occurrence and movement of groundwater in the dis-trict were discussed by Stephenson (1850) including the im-portance of fissures and the fact that there was a finite amount groundwater. He also recognized the occurrence of seawa-ter intrusion into the aquifer. The role of regional topogra-phy as a control on groundwater contours for the Sherwood aquifer (in the east of England) was discussed by Strahan in Hull (1882). Significantly, Morton (1866) discussed the loca-tion of wells as a possible control on yield and water quality and concluded that the highest yielding wells were located on faults. In contrast, Moore (1902) examined the porosity across a fault plane in the Sherwood Sandstone aquifer on the adjacent Wirral peninsula, just southwest of the area of inter-est, and concluded that porosity-reduction occurred across fault planes since they were cemented by calcite and pyrite. Also a porosity-occluding clay-rich fault gouge was found in two zones up to 0.5 m thick.
The Mersey Railway Tunnel, excavated through the aquifer, connects the Liverpool area to the Wirral (essentially the industrial town of Birkenhead) and it was recorded that abstraction from the tunnel led to deterioration of groundwa-ter quality (Wedd et al., 1923).
The hydrogeology of the Sherwood Sandstone aquifer in the Merseyside and Manchester areas was described in
re-ports for the Geological Survey by Taylor (1957) and Land (1964). Both authors presented maps with groundwater con-tours. The high degree of faulting in the aquifer and its pos-sible importance for internal boundaries occurring within the Permo-Triassic aquifer was noted by University of Birming-ham (1981). In an assessment of the saline intrusion into the Sherwood Sandstone aquifer it was suggested that wher-ever fault movement was small the effect on the transmis-sivity might be small depending on the nature of the fault zone (University of Birmingham, 1984). Large displace-ment, however, may juxtapose impermeable strata against permeable strata leading to a significant local reduction of the effective hydraulic conductivity. Just outside of the stud-ied area, the Roaring Meg fault has low permeability and re-stricts saline groundwater movement (Tellam et al., 1986). However the published synthetic hydrogeological map of the area has groundwater head contours that ignore all faults and has seemingly been drawn on the assumption that the aquifer is not sub-divided into compartments (Lewis et al., 1989). Barker (1996) investigated the geochemistry and iso-tope of the saline-freshwater mixing zone beneath Liverpool and stated that the change in groundwater chemistry was due to the presence of the fault and implies that it acts as a hydro-logical barrier to groundwater flow.
The main objectives of this study will be focused on the role of the structural geology of the area explicitly trying to establish the impact of faults on groundwater conditions us-ing records of groundwater head and geochemistry variations over the period 1993 to 2002.
River Mersey Liverpool Bay Wirral ( )a 30 4050 60 60 50 40 70 60 50 40 40 60 70 80 70 70 40 30 20 50 50 60 40 70 10 20 10 40 30 3 Formby 8 3 Liverpool 9 0 60 10 0 5km 4 0 5km 4 9 River Mersey N 8 0 10 5 ( b ) Wirrel Formby Sampled wells locations Croxteth fault Ecclestone W est fault Crosby fault Kirkdale fault Boundary fault Litherland fault Knowsley Anticline Kingsway
fault Crossfault
3
5 3
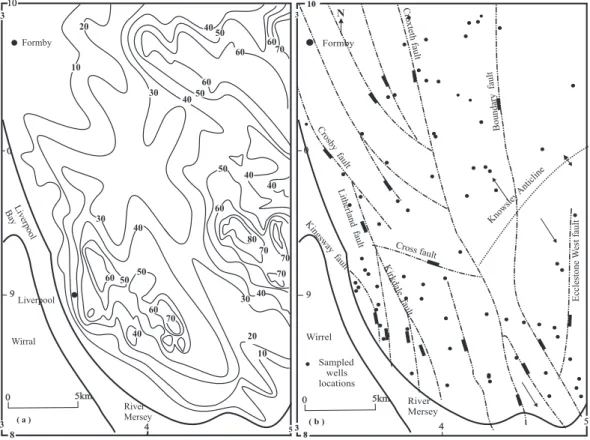
Fig. 2. (a) Topographic map with contours in meters, (b) Distribution of boreholes across the aquifer for which data have been used. Notice
the location of faults and the boreholes distribution.
2 Geology
2.1 General geology
Permo-Triassic sedimentary rocks represent the principle aquifer units in the area. The regional stratigraphy is rep-resented in Table 1 with the regional distribution of rocks at the surface given in Fig. 1. Permo-Triassic sedimentary rocks rest unconformably over Upper Carboniferous well-indurated sandstones and mudstones that are typically con-sidered to denote the low permeability base of the aquifer. These older rock units crop out in the east and north east of the area (Fig. 1).
The Permo-Triassic sedimentary succession starts with the Collyhurst Sandstone Formation, which is red to grey in colour and fine to medium grained. The stratigraphically-equivalent Manchester Marl and Bold Formations con-formably overlie the Collyhurst Sandstones. The Manchester Marl, in the north, is composed of calcareous siltstone or shale with thin bands of fossiliferous limestone, while the Bold Formation, in the south, is made up of fine to very fine-grained sandstones.
The major sandstone-dominated unit that represents the bulk of the aquifer in the area, the Sherwood Sandstone Group, overlies the Manchester Marl and Bold Formations. The base of this group is the Chester Pebble Formation. This
formation is made up of two units; the Lower Mottled Sand-stone Unit, composed of red and brown, fine to medium grained weakly cemented sandstone, followed by the Peb-ble Beds Unit, composed of red or yellow, cross laminated, coarse to medium grained pebbly sandstones. The overly-ing Wilmslow Sandstone Formation is characterised by soft, fine-grained sandstones. The Ormskirk Sandstone Formation has two lithological units; a lower one directly overlying the Wilmslow Formation consists of greyish-yellow to red sand-stone and upper one composed of medium and fine grained sandstone.
The Upper Triassic Mercia Mudstone Formation, a major argillaceous sequence overlying the Sherwood Sandstone, is considered to be the upper low-permeability boundary of the entire aquifer. It is composed of two units: the lower one be-ing the Tarporly Siltstone and the upper one bebe-ing the Mercia Mudstone.
The Quaternary system represents a very short length of geological time and is characterised in the area by a restricted depositional thickness, which nevertheless is of hydrogeo-logical significance. Thicknesses of 5 to 10 m are com-mon, but significant parts of the area are without Quaternary cover (e.g. Liverpool, Kirkby, and Ormskirk; University of Birmingham, 1984). Lithologically, these deposits are domi-nated by glacial tills and sands followed by well-sorted sands
0 5km Wirral 0 5 10 15 0 -5 -15 20 25 25 15 10 5 30 35 10 3 0 4 8 3 Formby Liverpool 9 Liverpool bay A A` B B` C C`
b ) Water table map 2002 . b. River Mersey 5 0 -5 -10 -5 40 30 5 20 0 9
a ) Water table map 1993 . 0 5km River Mersey 0 15 10 25 30 15 10 5 20 25 0 -5 -10 0 10 3 0 4 8 3 Wirral Liverpool Liverpool bay A A` B B` C C` Formby 5 -5 -5 5
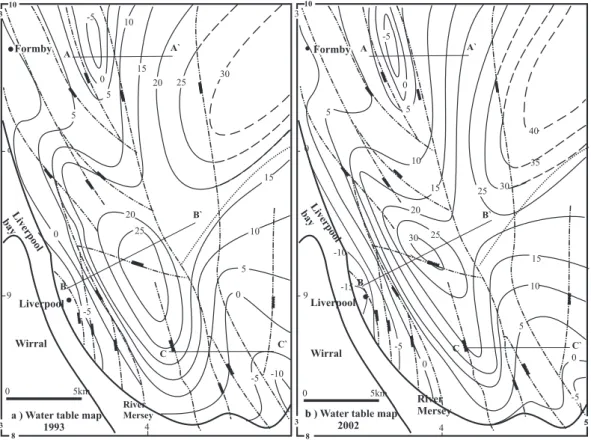
Fig. 3. Water table height in meters relative to the ordinance datum (OD, mean annual sea level); (a) 1993, and (b) 2002. Contouring was
based on the assumption employed during the drafting of the published hydrogeological map (Lewis et al., 1989) that the aquifer was a uniform entity with no sub-compartments.
locally intercalated with peat beds. River alluvium of silt, sand and clay has mainly developed in the valley of the River Alt, where the recent estuarine alluvium of sand, silt and mud occurs (University of Birmingham, 1984; Tellam, 1994). 2.2 Structural geology
The structural geology of the area is dominated by a variety of faults as represented on published geological maps and cross sections from the British Geological Survey (and its predecessors) and other published work (e.g. Morton, 1866; Wedd et al., 1923; Shackleton, 1953; University of Birming-ham, 1984).
Although faults dominate the geological structure from the hydrogeological perspective (Fig. 1), there is also a sub-tle low amplitude fold with its axis running approximately northeast to southwest. This fold is known as the Knowsley anticline (Fig. 1) and it results in a general, low angle north-west dip over the northern part of the study area and south-east dip in the vicinity of Halewood, Speke and Widnes. There are other small syn- and anti-forms to the north of the Knowsley anticline but they have a very limited effect on the general dip of the strata.
The area is intensively disrupted by numerous large faults. These generally trend north-northwest – south-southeast
with some smaller east-west cross faults. The faults are nor-mal with an average 60◦dip (Jones et al., 1938). The throws of these faults vary from a few meters to >300 m. Examples of faults with large displacements are the Boundary fault, the Croxteth fault and the Eccleston West fault (Tellam, 1983; and Fig. 1). In the Sherwood Sandstone in the north of England, there is a correlation between degree of displace-ment and fault zone thickness. Fault zones may either be filled with gouge or cataclasite depending on the lithologies on both side of the fault; some of the greatest faults in the area are likely to have potentially impermeable fault zones of >1 m thickness (e.g. Beach et al., 1997; Chadwick, 1997; Cowan, 1996; Rowe and Burley, 1997). These major faults (e.g. the Croxteth fault) have been implicated in controlling the occurrence of minor shallow petroleum accumulation to the north of the study area (Kent, 1948; Lees and Taitt, 1945) with the suggestion that the fault zones are effectively imper-meable. The faults that seem to cause the greatest geolog-ical complexity occur at the boundary between the Permo-Traissic and Carboniferous rocks (the Boundary fault, Fig. 1; University of Birmingham, 1984). Minor faults in the Qua-ternary deposits have been noted by Aitken (1871), Reade (1884) and Taylor (1958). Such faults are syndepositional and have no significant effect on groundwater movement.
10 3 8 3 River Mersey Wirral Formby Liverpool 9 L iv erpo ol b ay A A` B B` C C` 0 5km -5 0 10 20 30 40 50 60 A A` F F 0 5 km 1993 water table 2002 water table F Fault Fault Throw Gro und le vel C ro xt e th f a u lt 0 10 20 30 40 50 60 B` B F F F F F Ground level 0 5 km Cross fault Kirkdale fault Croxteth fault 0 10 20 30 40 50 60 C` C F F F F F Ground level 0 5 km E cc le st o n e w e st f a u lt C ro x teth f a ult B o u nd a ry f a u lt E le v a si o n i n m e te rs r el at iv e to O D E le v a si o n i n m e te rs r el at iv e to O D E le v a si o n i n m e te rs r el at iv e to O D
Figure 4 (new version)
Fig. 4. Schematic cross sections illustrated the variation of the water table height in meters across the faults in years 1993 and 2002. The
locations of the cross sections are shown on the map.
2.3 Topography
Although the area has generally low relief, the bedrock to-pography is locally characterised by narrow, linear lows (up to about 30 m above sea level) separated by hills that reach up to about 70 m above sea level (Fig. 2a). These topographic features broadly run northwest to southeast. Travelling fur-ther north, the narrow depression opens out to become a wide plane in the northwest area around Formby, the flood plain of the River Alt, with 10 m maximum elevations above sea level.
3 Methods
In this study 75 groundwater head records and 78 ground-water geochemical analyses collected from 70 groundground-water wells (Fig. 2b) have been utilised for two discrete year pe-riods (1993, 2002). These groundwater head data and geo-chemical analyses were supplied from the UK Environmen-tal Agency (EA). Head data have been collected from a large number of boreholes in the area for more than 70 years
al-though the Environmental Agency has only recently been re-sponsible for collecting and monitoring these data. Head data have been collected at least monthly from most of the moni-toring boreholes. The EA staff and the Nottingham EA lab-oratory followed recommended BSI sampling and analytical methods. Acidity, temperature, conductivity and total salin-ity were measured immediately after sampling. Previously cleaned sample bottles were rinsed with the groundwater and then filled to the top. Airtight caps were fitted to each bottle prior to transportation to the laboratory. Alkalinity titrations were performed within a few hours of sampling. Ion chro-matography was used for the major anions, and atomic ab-sorption and ICP-techniques were used for the major cations. In order to check the quality of the data, all the groundwater geochemical data that were used in this study were assessed for charge balance using Geochemist Workbench. Ground-water analyses with a charge imbalance >5% were rejected from the data set.
We concluded that automated geostatistical methods, ideal for gridded data but not suited to the irregular location of sampling points in this study (Fig. 2b), would not be used
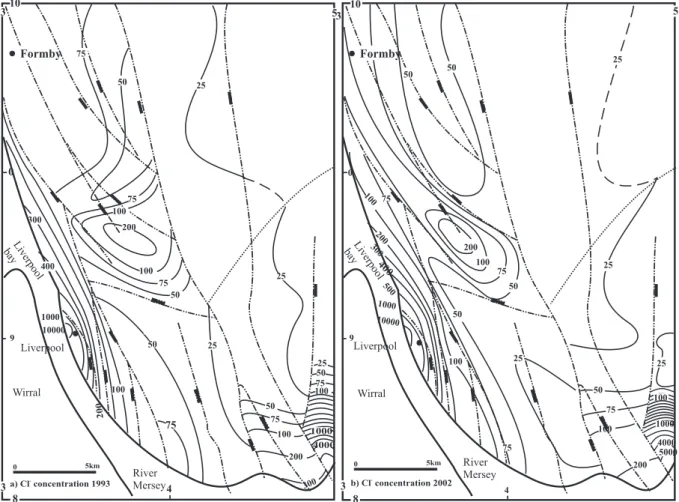
200 400 500 4000 4 9 b) Cl concentration 2002 -0 5km 1000 10000 1000 300 75 200 100 400 500 4 9 0 a) Cl concentration 1993 -0 5km 10000 1000 100 50 25 25 A B 50 75 100 100 500 4000 1000 200 100 75 50 25 75 50 50 25 75 100 0 100 200 50 50 50 75 100 500 25 10 3 8 3 5 10 3 3 5 8 Formby Formby D C A B D C
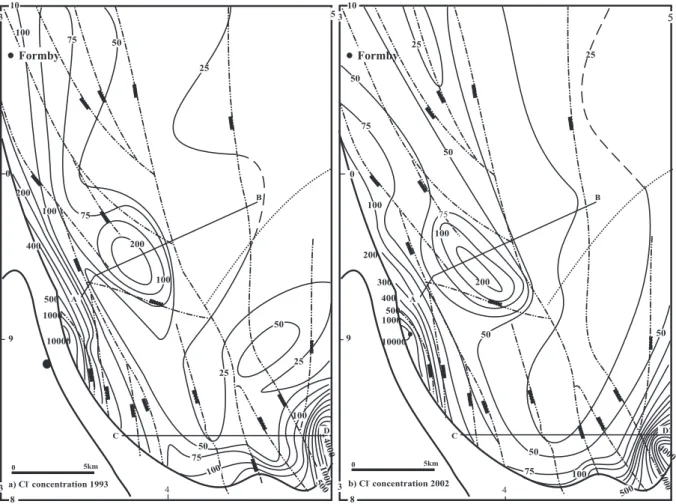
Fig. 5. Aqueous chloride concentrations in mg/L contoured for; (a) 1993 and (b) 2002. Contouring of chloride concentration was based on
the assumption that the aquifer is not compartmentalised by the structure elements.
for contouring groundwater head variation and the geochem-ical data. Instead we have use manual contouring methods to draw maps of water table elevation and groundwater geo-chemistry.
4 Results
4.1 Groundwater head variation in space and time
The groundwater head distribution maps from the years 1993 and 2002 have been drawn using the available data from monitoring boreholes. The groundwater head varied from 30 m above mean annual sea level (ordinance datum; OD) to as much as 15 m below OD for the years listed above. In the first instance we followed the assumptions implicit in the published regional hydrogeological map (that the aquifer was neither subdivided by faults nor constrained by folds into dis-crete compartments; Lewis et al., 1989) and freely contoured the groundwater head across the entire area (Fig. 3). It is noteworthy that the water contours drawn in this way have a
distinct, though imperfect, NNW-SSE lineation that accords to the main fault pattern (Figs. 1 and 2b).
A number of schematic cross-sections representing topo-graphic and groundwater elevation across some of the main faults in the study area were prepared to trace any effect of the faults on groundwater head height across the fault lines (Fig. 4). These show that there are significant fluctuations of groundwater head height across some of the faults (Fig. 4). Schematic cross-sections illustrate the changes of groundwa-ter head in passing from one side of a fault to another for the years 1993, and 2002. Cross-section A-A0, which tracks across the Croxteth fault in the north, shows a very large change of the groundwater head across the main fault, where the small faults have no significant effect on the groundwater head. Cross-section B-B0 also traverses the Croxteth fault, Litherland faults and other small faults to the west (Fig. 4). This clearly illustrates the dramatic change of groundwa-ter head across the Croxteth and Kirkdale faults. Further-more, cross-section A-A0, and B-B0 show that there is no simple relationship between local topographic elevation and groundwater head. These observations of groundwater head
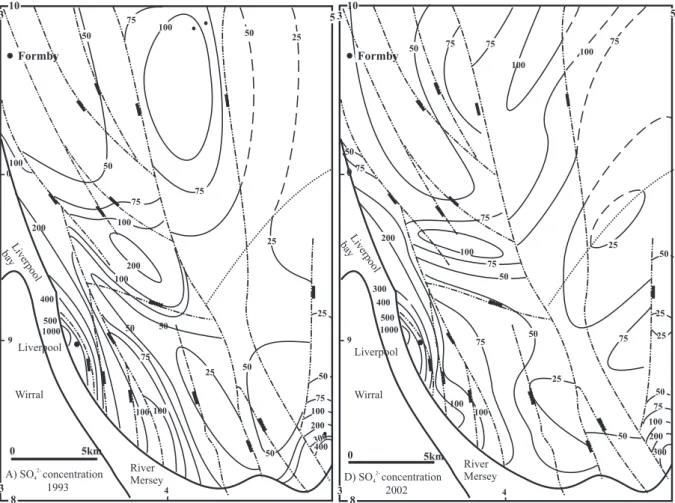
100 200 300 4 9 300 400 500 1000 75 300 200 4 9 400 500 1000 50 50 100 75 50 0 50 200 100 75 50 25 50 75 100 200 400 100 0 100 50 75 100 75 75 75 50 25 50 50 75 25 50 50 75 100 200 300 200 10 3 8 3 5 10 3 3 5 8 Formby Formby A B D C A B D C 0 5km b) SO concentration 2002 4 2-a) SO concentration 1993 4 2-0 5km
Fig. 6. Aqueous sulphate concentrations in mg/L contoured; (a) 1993 and (b) 2002. Contouring of chloride concentration was based on the
assumption that the aquifer is not compartmentalised by the structure elements.
displacement across faults, especially those contrary to the topographic slope, are best interpreted in terms of the faults representing low permeability zones in the aquifer that have limited the movement of groundwater. Cross-section C-C0 traverses the Eccleston West, Boundary and Croxteth faults and other small faults in between (Fig. 4). Although the groundwater head follows the topographic elevations, there is a pronounced steep change of groundwater head across the fault lines implying the significant effect of faults on ground-water head in these southern parts of the study area.
4.2 Groundwater geochemistry
Chloride, as the geochemically most conservative element in the natural waters, can give direct indication of the de-gree of mixing between different types of groundwaters and also the existence of seawater intrusion, while sulphate may give a useful insight into other non-conservative processes causing geochemical variations. This paper is not an in-depth study of the controls of geochemical variations in this aquifer. Rather, the geochemical data are here used to assess the degree of compartmentalisation.
Distribution maps of the concentrations of aqueous chlo-ride and sulphate (mg/l) from the chosen two years (1993 and 2002) have been prepared (Figs. 5 and 6). These maps were prepared following the initial assumption that the aquifer was neither subdivided by faults nor constrained by folds into discrete compartments and freely contoured the chloride and sulphate concentrations across the entire area. Two cross sec-tions traversing the faults were constructed to illustrate the degree of change in the chloride and sulphate concentrations along the faults (Figs. 7a and b).
As expected for groundwater in temperate climatic re-gions, chloride concentrations are relatively low (<100 mg/l) for much of the area for most of the time (Fig. 5). However, there are notable exceptions. The coastal strip near where the Mersey channel is at its narrowest has chloride concen-trations in excess of 1000 mg/l for some of the time and the area is relatively elevated all of the time. Also the southeast-ern part of the aquifer has locally elevated chloride reaching up to 4000 mg/l. Noteworthy is an area slightly to the west of the centre of the area that has less dramatic chloride concen-trations but is also locally elevated above background. The
20 40 60 80 100 120 140 160 180 200 220 C ro x te th fa u lt L it h e rl a n f fa u lt B o u n d ar y fa u lt A B 20 40 60 80 100 120 140 160 180 200 C ro x te th fa u lt L it h e rl a n f fa u lt B o u n d ar y fa u lt U p t o > 4 0 0 0 m g /l C D 20 40 60 80 100 120 140 160 180 200 220 A B C ro x te th fa u lt L it h e rl a n f fa u lt B o u n d ar y fa u lt C ro x te th fa u lt L it h e rl a n f fa u lt B o u n d ar y fa u lt U p t o > 4 0 0 m g /l C D 20 40 60 80 100 120 140 0 5km 0 5km 0 5km 0 5km (a) (b) 160 180 200 2002 1993 2002 1993 m g /l O 2 S 4 - m g /l O 2 S 4 -C l m g /l -C l m g /l
-Figure 7 (new version)
Fig. 7. Schematic cross sections illustrated the variation of the (a) chloride concentration across the faults in years 1993 and 2002 and (b) sulphate concentration across the faults in years 1993 and 2002. The locations of cross-sections showed on the maps (Figs. 6 and 7,
respectively).
elevated groundwater salinity in some of the near-coastal re-gions is the result of seawater invasion.
Maps of the dissolved sulphate concentrations have some similarities to the chloride maps although they are not exactly the same (Fig. 6). Sulphate is elevated in parts of the coastal strip and just to the west of the centre of the study area but it is also relatively concentrated at the northern edge of the area.
5 Discussion
5.1 Structural geology and groundwater head
For the two discrete years for which water table height con-tour maps have been prepared (Fig. 3) it is noteworthy that water table heights do not match topographic variations re-sulting in anomalously low and high water tables relative to the overlying land surface. The water table reaches maxi-mum elevations in the north eastern part of the study area (more than 30 m above sea level) and broadly tends to de-crease toward the coastline and the Mersey estuary (Fig. 4). This reduction of the water table height towards the coast is not steady across the whole area. There are sudden changes in the water table height over very short distances. In the middle of northern area just west of the Croxteth fault where the water table drops from >5 m above sea level to as much as 5m below sea level (Fig. 4). Therefore, the Croxteth fault is a fairly well pronounced groundwater barrier. To the
mid-dle of the block bounded to the east by the Croxteth fault, water table height does not follow the general reduction to-wards the coastline and instead rises to more than 25 m and 30 m above sea level (Figs. 5a and b, respectively). This ele-vated groundwater table has a sharp western margin marked by the Kirkdale fault where the groundwater table falls to 10 m below sea level in the direction of the Mersey estuary (Fig. 4). To the east of Croxteth fault, the water table eleva-tion follows the Knowsley anticline structure (Fig. 1). The fold axis can be recognized as a groundwater divide where the water table falls away from the fold axis. In conclusion, the water table in this part of the aquifer (east of Croxteth fault) is to a fairly large extent unrelated to the regime in the west of this fault. The block to the east of the Croxteth fault can be separated by the anticline axis into northern and southern parts. In the southern part, to the east of the Eccle-ston West fault a very sharp and dramatic drop of water table height occurs ultimately falling to below sea level (Fig. 4). In general, the variations in the water table contours seem to be controlled by the regional fault and fold lines.
Following the analysis represented in Fig. 4, an alternative contouring scheme was used for groundwater head for the two discrete year periods based on the assumptions that the Croxteth, Ecclestone West and linked Litherland-Kirkdale faults are all low permeability zones strongly limited the groundwater flow. The Knowsley anticline will also act as a local modifier of the groundwater movement and effec-tively act as a groundwater divide. On this modified basis
5 50 -5 5 10 15 20 25 30 0 5 0 -5 -10 -5 0 5 10 15 20 25 0 -5 5 10 3 0 4 River Mersey Wirral 0 Formby Liverpool 9 Liverpool bay 35
a ) Water table map 1993 . 10 5 15 20 20 15 10 -5 -10 3 0 5km Fold Fault Contour lines 8 5 0 10 25 30 25 10 5 0 -5 5 10 15 20 25 0 -5 5 10 3 0 4 8 3 River Mersey Wirral 0 Formby Liverpool 9 Liverpool bay
b ) Water table map 2002 . 40 35 -5 10 15 20 5 -10 20 15 0 5 30 -15 15 15 20 20 10 0 0 5km 5
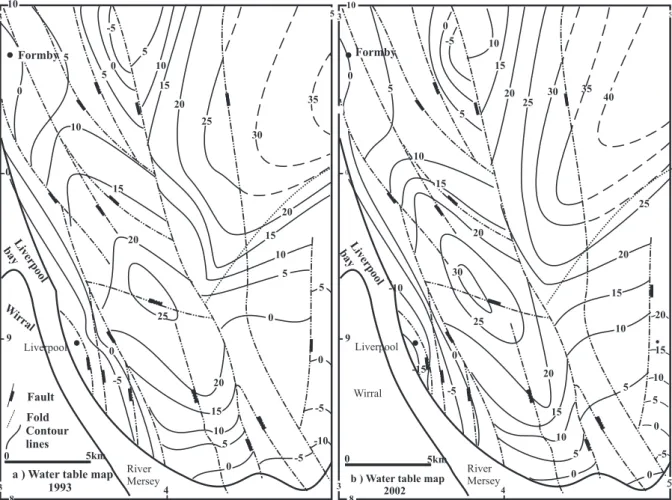
Fig. 8. Water table height in meters relative to the ordinance datum (OD, mean annual sea level); (a) 1993 and (b) 2002. The maps were
prepared using the same data as Fig. 3 but, in contrast to Lewis et al. (1989), contouring was based on the assumption that the aquifer is compartmentalised by the Boundary, Croxteth, Litherland-Kirkdale and Ecclestone West faults and the Knowsley anticline (see Fig. 4).
the groundwater head map was tentatively re-contoured for the two years assuming the aquifer was compartmentalised by these geological structures (Fig. 8). Figure 8 can be com-pared to Fig. 3 to reveal the consequence of the recognition of the low hydraulic conductivity fault zones. The head con-tours are distinctly interrupted in the vicinities of the Crox-teth, Ecclestone West and linked Litherland-Kirkdale faults.
The previous discussion shows that at least some of the faults that dissect the regional Permo-Triassic Sherwood Sandstone aquifer and represented on the geological map (Fig. 1) could be low permeability zones that have limited the movement of groundwater. The close similarity in the hydrogeological properties of the Permo-Triassic sandstone formations suggest that low permeability characteristics of fault zones are mainly due to the low permeability of the filling materials. Note that the Sherwood Sandstone aquifer is hugely dominated by fine to coarse grained sandstones. Fault movement within the Sherwood Sandstone aquifer is unlikely to result in the dominant juxtaposition of intrafor-mational mudstones and sandstones. Fault zones in the
Sher-wood Sandstone will be dominated by cataclasis, grain size diminution and possibly cementation (Beach et al., 1997; Chadwick, 1997; Cowan, 1996; Rowe and Burley, 1997). However, in the extreme east of the area, the Boundary Fault, with its great displacement (>300 m), juxtaposes the low per-meability, mudstone-rich Upper Carboniferous against the Sherwood Sandstone, therefore it has probably got the lowest permeability values (Moor, 1902; Tellam, 1983) and so will have had greatest effect on groundwater movement.
On the basis of fault distribution patterns and water table elevations, the aquifer could be subdivided into several hy-drogeological sub-basins with boundaries defined largely by faults. However, the subtle regional fold (Fig. 1) may also influence groundwater movement patterns with groundwater flow being away from the antiform axis. These sub-basins (Fig. 8) are thus defined by the fold axis and the most sig-nificant faults (those that have affected water table elevation most extensively and those with the most significant impacts on geological outcrop patterns. Hydrogeological sub-basin 1 (B1) occupies the area to the north of the Knowsley anticline
5 10 0 4 8 River Mersey Wirral Liverpool 9 Liverpool bay 50 25 50 75 100 4000 1000 100 25 5000 50 100 25 200 100 1000 50 75 100 200 25 200 300 400 500 10000 3 3 5 10 3 0 4 8 3 RiverMersey Wirral Liverpool 9 Liverp ool bay 75 50 25 75 100 200 100 75 50 75 25 100 200 1000 300 50 75 100 200 300 4000 1000 25 50 75 100 25 10000 50 400 50 75 75 Formby Formby b) Cl concentration 2002 -0 5km a) Cl concentration 1993 -0 5km
Fig. 9. Aqueous chloride concentration in mg/L contoured for (a) 1993 and (b) 2002. The maps were prepared using the same data as
Fig. 5 but, contouring was based on the assumption that the aquifer is compartmentalised by the Boundary, Croxteth, Litherland-Kirkdale and Ecclestone West faults and the Knowsley anticline.
and is bounded by the Croxteth fault in the west and Bound-ary fault in the east. Sub-basin B2 lies to the south of the Knowsley anticline and is limited in the west by the southern extension of the Croxteth fault and the Carboniferous sedi-ments and Ecclestone West fault in the north and east. basin B3 lies to the east of the Eccleston West fault. Sub-basin B4 lies between the Croxteth fault to the east and the Litherland-Kirkdale faults to the west. Sub-basin B5 has its eastern margin defined by the linked Litherland and Kirkdale faults. At this stage, the interpretation is somewhat tentative being based solely on water table elevations in relation to topography and fault patterns, structural geology (faults and fold) and outcrop patterns. Independent geochemical data will now be employed to help ascertain the validity of the interpretation of compartmentalisation.
5.2 Sub-basin definition and groundwater geochemistry The previous analysis included no water geochemical evi-dence for the compartmentalisation of the aquifer into dis-crete sub-basins. Geochemical data should be capable of as-sessing the plausibility of the tentatively assigned sub-basins.
The initial contour maps of chloride and sulphate concen-tration (Figs. 5 and 6) have been redrawn and re-contoured (Figs. 9 and 10) using the new concept that the Croxteth, Ecclestone West and linked Litherland-Kirkdale faults limit water movement and that the Knowsley anticline also acted as a barrier to movement (thus compare Figs. 9 and 10 to Figs. 5 and 6). Note that the Boundary fault is the effective eastern limit of the aquifer as it brings aquiclude Carbonifer-ous rocks against Permo-Triassic aquifer (Fig. 1).
Chloride distribution maps for the two years (Figs. 5 and 9) reveal that the areas of very high chloride concentra-tion (that >1000 mg/l) predominantly lies very close to the Mersey Estuary or the open sea. In the western part, the con-tours of chloride concentration run approximately NNW-SSE and are parallel to, and bounded to the east by, the linked Litherland and Kirkdale faults. This seems to broadly con-cur with the definition of sub-basin B5. However, the very highest chloride concentrations in this area are constrained to an area west of a small fault near the coast. This is also the area that has some of the lowest water table elevations (up to 15 m below sea level). This area is conceivably a
5 10 3 0 4 8 3 River Mersey Wirral Liverpool 9 Liverpool bay A) SO 1993 4 2-concentration 50 100 50 25 25 25 50 75 100 200 300 400 25 50 75 100 100 200 400 100 200 100 75 50 75 75 50 100 0 5km 500 1000 50 50 Formby 5 10 3 0 4 8 3 River Mersey Wirral Liverpool 9 Liverpool bay 25 50 75 100 200 300 100 75 50 300 200 25 50 100 75 75 25 50 100 75 75 75 50 75 50 100 0 5km D) SO 2002 4 2-concentration 400 500 1000 25 50 75 Formby 100
Fig. 10. Aqueous sulphate concentration in mg/L contoured for (a) 1993 and (b) 2002. The maps were prepared using the same data as
Fig. 6, but contouring was based on the assumption that the aquifer is compartmentalised by the Boundary, Croxteth, Litherland-Kirkdale and Ecclestone West faults and the Knowsley anticline.
separate sub-basin (B6) and is likely to be defined by the fault that runs west of, and sub-parallel to, the linked Litherland and Kirkdale faults, which is known as the Kingsway fault (Fig. 2b). This fault was considered previously by (Barker, 1996) to be a sealed fault that limits eastwards seawater inva-sion. In the extreme southeast of the area (near Widnes), the elevated chloride concentrations in the groundwater (locally >4000 mg/l) seem to be sharply defined. This represents the B3 sub-basin. It is possible that the locally elevated chlo-ride concentrations are limited to the west by the Ecclestone West fault and Boundary fault (Figs. 5 and 9). Away from the coast, there are some locally elevated chloride concentration values not easily correlated with the values in neighbouring areas. In sub-basin B4 there is an area with chloride concen-trations >200 mg/l that is anomalous with respect to the re-mainder of the sub-basin. The Croxteth fault seems to define differences in chloride concentration between the tentatively assigned sub-basins B1, B2 and B4, where the Litherland-Kirkdale faults define the differences in chloride concentra-tion between the tentatively assigned sub-basins B5 and B4.
The sulphate concentration contour maps have some simi-larities with chloride concentration contour maps (Figs. 6 and 10). As for chloride, one of the areas with the highest sul-phate concentrations lie close to the Mersey River bounded by the linked Litherland and Kirkdale faults although sul-phate concentrations ∼=1000 mg/l only occur very close to the coast supporting the existence of a separate sub-basin in B5, here defined as B6 using the water geochemistry data (Figs. 6 and 10). Based on the sulphate as well as the chloride con-centration data, in the extreme southeast of the area, sub-basin B3 is defined to the west by the Eccleston West fault and Boundary fault. To the middle of B4 is an area of anoma-lously high sulphate concentration (>200 mg/l; Figs. 6 and 10). In the north of the study area, to the east of the Croxteth fault the sulphate concentration locally rises to >100 mg/l while to the west of the Croxteth fault the sulphate concentra-tion fall to <50 mg/l (Figs. 6 and 10). This seems to confirm that the Croxteth fault is an effective seal between discrete compartments (B1, B2 and B4). The chloride and sulphate concentration maps seem to support the Knowsley anticline
as a feature that effectively separates sub-basins B1 and B2 (Figs. 6 and 10).
The maps of water geochemistry broadly support the no-tion of sub-basins although the initial sub-division of the area based on water table and the occurrence of structural geo-logical features is not wholly confirmed. Initially assigned basins B1to B5 seem to be broadly robust. An extra sub-basin to the western edge of B5 may be operative and has been labelled B6.
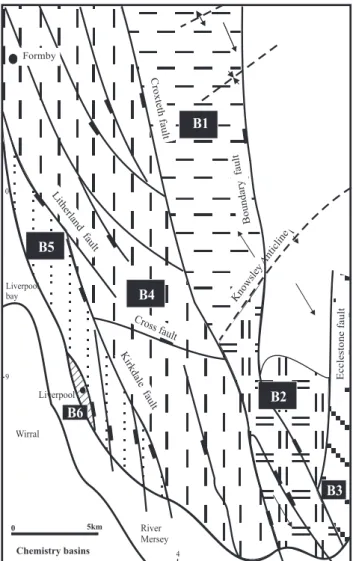
The newly identified compartments to the aquifer are de-lineated in Fig. 11. In this figure the aquifer is divided into areas (B1 to B6) that the water table head and geochemical data have identified. The compartments (B1 to B6) are seem-ingly isolated from each other. This has significant implica-tions for recharge patterns, pollution movement and public water supply issues.
The compartmentalisation of the aquifer based on con-toured maps of water table height (Fig. 8) and geochemistry (Figs. 9 and 10) can be tested further by examining individ-ual and averaged geochemical characteristics of each of these newly defined aquifer compartments. Although the faults are not the main reason for the geochemical variation between sub-basins, they can plausibly highlight any differences that exist. The use of averaged geochemical parameters can give an overall view of any geochemical differences. Illustrations employing all the geochemical data are not particularly help-ful since the figure is very crowded and is not easy to inter-pret. These averaged data have been added to binary cross-plots (Fig. 12). The average geochemical parameters and standard deviation cross-plots of each sub-basin (Fig. 12) in-dicate that the geochemical composition of groundwater in sub-basins B1, B2 and B4 are fairly similar but sub-basins B3, B5 and B6 are all quite different and seemingly unre-lated either to one another or to sub-basins B1, B2 and B4. The broadly similar geochemical compositions of waters in sub-basins B1, B2 and B4 could be a result of similar geo-chemical processes in these parts of the aquifer leading to similar evolutionary pathways. The wide inland extension of B3 sub-basin (Fig. 11) seems to result in a high degree of mixing between saline and fresh groundwaters leading to the wide range of geochemical parameters (as reflected by the magnitude of the standard deviation values) in this sub-basin. In contrast, B6 sub-basin where the tendency for mixing be-tween saline- and fresh-groundwater is limited by the sealed fault (Kingsway fault, Fig. 11) the variation range of geo-chemical parameters is very limited (Fig. 12). The geochem-ical evolution of groundwater in B5 is seemingly unique and is not particularly related to any other sub-basin.
Sub-basin B4 has a small degree of overlap with B1 and B2 (Fig. 12a) possibly suggesting that there is limited wa-ter movement across the Croxteth fault. The notion that B4 is discrete from B1 and B2 is largely supported by the geo-chemical data. B4 has moderately elevated sulphate concen-trations relative to B2 and moderately high magnesium con-centration relative to B1 and B2 (Fig. 12). There is some
de-Liverpool Wirral River Mersey Liverpool bay 4 9 0 Boundary fault 0 5km Ecclestone fault Cross fault Kirkdale fault Croxteth fault Litherland fault B2 B1 B3 B4 B5 B6 Formby Chemistry basins Knowsley Anticline
Fig. 11. Suggested division of hydrogeological sub-basins based on
water table height and water geochemical data.
gree of geochemical overlap between groundwater samples from sub-basins B1 and B2 although there is a significant difference between the cross-plotted data (Fig. 12) suggest-ing that these sub-basins are indeed discrete aquifers. B1 has very low chloride and moderately low sulphate whereas B2 has moderately low chloride and very low sulphate. In order to differentiate between the geochemical evolution of the groundwaters in B1, B2 and B4 average sulphate and chloride cross-plots have been developed (Fig. 13). This fig-ure indicates that, the main recharge of the groundwater in these three sub-basins seems to be the same, however, the groundwater evolution in each sub-basin follows a differ-ent direction. In B1, both parameters are inversely corre-lated where the sulphate concentration increases in the same way as chloride concentration. In B2 there is no correlation between the two parameters. High chloride anomalies are recorded only in the samples close to the Mersey River in B2 (Fig. 11). In B4 sulphate and chloride concentrations are
300 250 200 150 100 50 0 0 50 100 150 200 250 B1 B2 B4 B5 360 340 320 300 280 260 240 220 200 1000 2000 3000 4000 B6 B3 Cl mg/l- 60 40 20 0 150 B5 B6 B2 B1 B4 430 450 410 390 370 350 100 120 140 160 180 200 220 B3 M g m g /l 2 + HCO mg/l3 - 50 100 200 250 700 600 500 400 300 200 100 0 0 20 40 60 80 100 B6 B2 B1 B4 B5 N a m g /l + Ca mg/l++ B3 700 900 1100 1300 1500 650 750 850 950 (a) (b) (c) M g m g /l 2 + N a m g /l + Ca mg/l++ HCO mg/l3 - Cl mg/l- m g /l O 2 S 4 - m g /l O 2 S 4
-Figure 12 (new version)
Fig. 12. Geochemical cross-plots; (a) average chloride concentrations vs. average sulphate concentrations (b) average magnesium
concentra-tions vs. average bicarbonate concentraconcentra-tions, (c) average sodium concentraconcentra-tions vs. average calcium concentraconcentra-tions. Note, for simplification the very high chloride concentration samples (>4000 mg/l) in B6 were excluded in this graph as this sub-basin is separated from the others by the Kingsway fault.
directly correlated which may be a result of them having a related set of controls in this sub-basin.
The similarity in the overall groundwater geochemistry in compartments B1, B2 and B4 (Figs. 12 and 13), with their own localised head variations, seems to support the conclu-sion that faults are zones of low hydraulic conductivity. If there had been no barriers, then the regional movement of water in all three zones would likely have resulted in re-gional geochemical evolution patterns. Instead, the ground-water has broadly similar composition in all three discrete compartments and there has certainly not been regional scale change resulting in differences along regional flow paths.
Therefore the degree of compartmentalisation of the major aquifer in the area tested by the groundwater heads is broadly supported well by the variation in the geochemical composi-tion of groundwater.
6 Significance
It has been known that petroleum accumulations are com-monly divided into discrete fluid compartments for a number of years. The data typically used to assess the degree of com-partmentalisation include fluid pressure data, fluid contact (e.g. oil-water) depths, oil geochemistry, gas geochemistry,
associated water geochemistry, and the physical properties of petroleum (Smalley and England, 1992, 1994; Smalley et al., 1995). By analogy we have here used water table height variations (equivalent to fluid pressure variations and fluid contact depths in oil fields) and water geochemistry data (equivalent to petroleum geochemistry data). This approach has proved to be very effective in determining the degree of compartmentalisation in a near-surface aquifer. These data are typically available from aquifers in developed regions and the approach could be widely applied with only minor extra expense.
The compartmentalisation in the Sherwood sandstone aquifer is primarily a result of the occurrence of a series of major faults that traverse the sandstone-dominated bedrock. The faults have vertical displacements of up to several hun-dred meters and probably have meter-thick zones composed of low permeability fault gouge and cataclasite resulting from the ancient movements of the faults (Beach et al., 1997; Chadwick, 1997). Faults are also commonly implicated in the lateral compartmentalisation of oil fields although verti-cal compartmentalisation in oil fields can also be the result of stratification of permeable and impermeable sedimentary units, growth of diagenetically-cemented layers etc.
Why does the compartmentalisation of this coastal aquifer matter? The water table close to the coastline is, in some lo-cations, 10 m below sea level (as a result of anthropogenic activities). However, the landward movement of seawater in the aquifer has been locally limited by faults. Where the faults are sub-parallel to the coastline the landward invasion is spatially restricted to the near-shore region of the aquifer. In stark contrast, where the faults are approximately perpen-dicular to the coastline, the landward invasion of seawater is more extensive since there is nothing preventing the ad-vance into the coastal aquifer. Managing groundwater re-sources is done most effectively with knowledge of compart-mentalisation and its controls. These would enable predic-tion of groundwater movements. Adopting the nopredic-tion that the aquifer is merely a “tank of sand” (as is implicit in the re-gional hydrogeological map; Lewis et al., 1989) would lead to a whole host of errors in predicting occurrence and extent of saline intrusion.
The region in question has relatively high ground to the east where the Sherwood sandstone sub-crop could poten-tially be a site of active recharge to the entire aquifer. The existence of groundwater compartments due to NNW-SSE oriented sealing faults suggests that this scenario is perhaps unlikely. The NNW-SSE sealing faults will restrict E-W recharge. Recharge of the aquifer is thus most likely via ver-tical percolation of rainfall. This is supported by the occur-rence of a water table high in the SW of the area (under a local topographic high) and a long way from the relatively high ground in the east.
One of the practical implications for the occurrence of compartmentalisation is that any lateral spread of contaminants due to poor environmental protection will be
B1 0 50 100 150 200 250 0 25 50 75 100 125 150 175 200 225 B4 Cl mg/l -B2 B2 Samples near to the Mersey River High anomaly samples to the middle of the sub-basin 0 50 100 150 200 250 0 25 50 75 100 125 150 175 200 225 B4 Samples near to the Mersey River High anomaly samples to the middle of the sub-basin SO 4 2 - m g /l
Figure 13 (new version)
Fig. 13. The cross plots of concentrations of sulphate versus
chlo-ride for the B1, B2 and B4 sub-basins samples.
spatially restricted to the local compartment. Point-source pollution is unlikely to spread to the entire aquifer.
7 Conclusions
1. Analysis of water table height variations and groundwa-ter geochemistry reveals different sub-basins, or com-partments, within the Triassic Sherwood Sandstone aquifer in the Liverpool area in the UK.
2. NNW-SSE oriented geological faults, with vertical dis-placements of up to 300 m, traverse the Triassic and represent the vertical margins of discrete compartments within the aquifer.
3. The combination of fluid pressure gradients (as repre-sented by water table height), water geochemistry data and an appreciation of the dominant geological struc-tures in an aquifer (e.g. major faults) proved effective in defining the degree of compartmentalisation in the aquifer.
4. Lateral influx of seawater is limited by the occurrence of low hydraulic conductivity faults running sub-parallel to the coastline in the west of the aquifer. These faults are perpendicular to the coastline in the south of the aquifer and have permitted more extensive landward invasion of seawater.
5. Geochemical data show that mixing of groundwater be-tween different compartments is limited by NNW-SSE trending faults. This reveals that lateral recharge of the aquifer from higher ground in the east will be limited. Recharge must be by vertical percolation thus spatially limiting the extent of any groundwater contamination by anthropogenic activities.
Acknowledgements. The work was funded through a PhD award from the Egyptian Education and Cultural Bureau, London. The Department of Earth & Ocean Sciences at the University of Liverpool is duly acknowledged. The authors would like to thank the Environmental Agency staff J. Ingram and D. Billington for supplying us with the data set used in this study.
Edited by: J. Carrera
References
Aitken, J.: On faults in drift at Stockport, Cheshire. Transactions of the Manchester, Geological Society, 10, 46–49, 1871.
Barker, A. P.: Isotopic studies of groundwater diagenesis. PhD The-sis, Leeds University, 139 p., 1996.
Beach, A., Brown, J. J., Welbon, A. L., McCallum, J. E., Brock-bank, P., and Knott, S.: Characteristics of fault zones in sand-stones from NW England: application to transmissibility, in: Petroleum geology of the Irish Sea and adjacent areas, edited by: Meadows, N. S., Trueblood, S. P., Hardman, M., and Cowan, G., Special Publication of the Geological Society, 124, 315–324, 1997.
Chadwick, R. A.: Fault analysis of the Cheshire Basin, NW Eng-land, in: Petroleum geology of the Irish Sea and adjacent areas, edited by: Meadows, N. S., Trueblood, S. P., Hardman, M., and Cowan, G., Special Publication of the Geological Society, 124, 297–313, 1997.
Cowan, G.: The development of the North Morecambe gas field, East Irish Sea, UK, Petroleum Geoscience, 2, 43–52, 1996. Hull, E.: The geology of the country around Prescot, Lancashire,
3rd Ed. Mem. Geol. Surv. Gt. Brit., 1882.
Jones, R. C. B., Tonks, L. H., and Wright, W. B.: Wigan District, Mem. Geol. Surv. Gt. Brit., 1938.
Kent, P. E.: A deep borehole at Formby, Lancashire, Geological Magazine, 85, 22–35, 1948.
Land, D. R.: Hydrogeology of the southern part of the northwest region, Geol. Surv. on file report, 1964.
Lees, G. and Taitt, A. H.: The geological results of the search for oilfields in Great Britain, Quart. J. Geological Soc., 101, 255– 317, 1945.
Lewis, M. A., Doorgakant, P., Lawrence, A. M., Monkhous, R. A., (section Leader), with the assistance of Riden, J. of Welsh Wa-ter and Eggboro, M. D., and other staff of North West WaWa-ter: Hydrogeological map of Clwyd and the Cheshire basin, British Geological Survey, 1989.
Morton, G. H.: On the position of the wells for the supply of water in the neighbourhood, Proc. Liverpool Geological Soc., 8, 241– 267, 1866.
Moore, C. C.: A study of the volume composition of rocks and its importance to the geologist, Proc. Liverpool Geological Soc., 9, 129–162, 1902.
Reade, T. M.: A section of the Trias at Vyrnwy Street Everton dis-playing evidence of lateral pressure, Proc. Liverpool Geological Soc., 5, 158–159, 1884.
Reilly, T. E. and Pollock, D. W.: Factors affecting areas controlling recharge to wells in shallow aquifers, U.S. Geological Survey Water Supply Paper 2412, 1993.
Rowe, J. and Burley, S. D.: Faulting and porosity modifica-tion in the Sherwood Sandstone at Alderley Edge, northeastern Cheshire: an exhumed example of fault-related diagenesis, in: Petroleum geology of the Irish Sea and adjacent areas, edited by: Meadows, N. S., Trueblood, S. P., Hardman, M., and Cowan, G., Special Publication of the Geological Society, 124, 315–324, 1997.
Shackleton, R. M.: Geology in a scientific study of Merseyside, edited by: W. Smith, Published for Brit. Assoc. by Uni. Press of Liverpool, 1953.
Smalley, P. C. and England, W. A.: Assessing reservoir compart-mentalization during field appraisal: how geochemistry can help, SPE 25005, 1992.
Smalley, P. C. and England, W. A.: Reservoir compartmentalization assessed with fluid compositional data, SPE Reservoir Engineer-ing, 175–180, 1994.
Smalley, P. C., Dodd, T. A., Stockden, I. L., Raheim, A., and Mearns, E. W.: Compositional heterogeneities in oilfield forma-tion water: identifying them, using them, in: The geochemistry of reservoirs, edited by: Cubbitt, J. M. and England, W. A., Spe-cial Publication of the Geological Society, 86, 59–69, 1995. Stephenson, R.: Report on the supply of water to the town of
Liver-pool, Report to the Water Committee of Liverpool Town Council, 1850.
Taylor, B. J.: Report on underground water resources: the Permo-Triassic area of south Lancashire, Unpub. Rep., Geol. Surv. Manchr. Office, 1957.
Taylor, B. J.: Cemented shear-planes in the Pleistocene middle sands of Lancashire and Cheshire, Proc. Yorkshire Geological Soc., 31, 359–365, 1958.
Tellam, J. H.: Hydrochemical studies of the Lower Mersey basin Permo-Triassic sandstone aquifer system. PhD Thesis, Birming-ham University, 1983.
Tellam, J. H.: The groundwater chemistry of the Lower Mersey Basin Permo-Triassic sandstone aquifer system, UK: 1980 and Pre-industrialization-urbanisation, J. Hydrol., 161, 287–325, 1994.
Tellam, J. H., Lloyd, J. W., and Walters, M.: The morphology of a saline groundwater body: its investigation, description and pos-sible explanation, J. Hydrol., 83, 1–21, 1986.
University of Birmingham: Lower Mersey Basin Saline Groundwa-ter Study, final report to the North West WaGroundwa-ter Authority by the University of Birmingham, Summary report, 1981.
University of Birmingham: North Mersey Basin Saline Groundwa-ter Study, final report to the North West WaGroundwa-ter Authority by the University of Birmingham, Summary report, 1984.
Wedd, G. B., Smith, B., Simmons, W. C., and Wary, D. A.: The geology of Liverpool, Mem. Geol. Surv. Eng. and Wales, 1923.