HAL Id: hal-00408545
https://hal.archives-ouvertes.fr/hal-00408545
Submitted on 3 Feb 2021
HAL is a multi-disciplinary open access
archive for the deposit and dissemination of
sci-entific research documents, whether they are
pub-lished or not. The documents may come from
teaching and research institutions in France or
abroad, or from public or private research centers.
L’archive ouverte pluridisciplinaire HAL, est
destinée au dépôt et à la diffusion de documents
scientifiques de niveau recherche, publiés ou non,
émanant des établissements d’enseignement et de
recherche français ou étrangers, des laboratoires
publics ou privés.
Characterization of small-scale structures at the
magnetopause from ISEE measurements
L. Rezeau, A. Roux, C. T. Russell
To cite this version:
L. Rezeau, A. Roux, C. T. Russell. Characterization of small-scale structures at the magnetopause
from ISEE measurements. Journal of Geophysical Research, American Geophysical Union, 1993, 98
(A1), pp.179-186. �10.1029/92JA01668�. �hal-00408545�
JOURNAL OF GEOPHYSICAL RESEARCH, VOL. 98, NO. A1, PAGES 179-186, JANUARY 1, 1993
Characterization
of Small-Scale Structures
at the Magnetopause
From ISEE Measurements
L. REZEAU AND A. RouxCentre National d'Etudes des Tdldcornmunications, Centre de Recherches en Physique de I'Environnement, Issy-les.Moulineaux, France C. T. RUSSELL
Institute of Geophysics and Planetary Physics, University of California, Los Angeles
High-resolution data (coveting up to 8 Hz) from the flux gate magnetometers on the two ISEE spacecraft
are used to analyze ultralow-frequency (ULF) fluctuations observed at the magnetopause and in the adjacent
layers. Intersatellite correlations are computed to show that the same structure can be identified in the fluctuations observed on both spacecraft when the interspacecraft distance is small. Then the possibility of deducing the velocity of the structure from two-point measurements is discussed; it is shown that it can be
estimated only in certain cases.
1. INTRODUCTION
Data from several spacecraft have been used to give evidence for the presence of a variety of intense waves at the
magnetopause,
from OGO 5 to AMPTE (Active Magneto-
spheric
Particle
Tracer
Exp!orers)
[Holzer
et al., 1966;
Gurnett
et al., 1979; LaBelle and Treumann, 1988]. The importance of
these waves is related to the role they could play in the
dynamics
of the magnetopause
and
of the surrounding
regions.
In particular
it has been suggested
by several
authors
that
intense
plasma
waves could lead to anomalous
cross-B
diffusion
through
the magnetopause
[Thorne
and Tsurutani,
1991; Gendrin, 1983; Treumann et al., 1991]. The question which is still awaiting an answer is which kind of wave might be the most efficient. The ELF-VLF frequency range was
discussed
first
by Tsurutani
and Thorne
[1982]
and
Tsurutani
et
aI. [1989].
The ULF frequency
range
is also
a good
candidate,
since the level of the turbulence in that range is the highest;this
was
first suggested
by Gendrin
[1983].
The presence
of
intense fluctuations in the ULF range has also been reported in
flux transfer
events
(FTEs) by Anderson
et at. [1982] and
Farrugia et aL [1988].While the fact that ULF fluctuations are observed at
magnetospheric
boundaries
is well documented,
their
nature
is
still a matter of debate. One of the difficulties in interpreting
these waves comes from their fast variations in intensity and
from
their
unsteady
spectra
that exhibit
(or do not exhibit)
spectral
peaks.
Anderson
et al. [1991],
for instance,
have
observed
these
fluctuations
on a particular
crossing
of the
magnetopause
on AMPTE data.
They interpreted
them
as
electromagnetic
ion cyclotron
waves.
So did Farrugia
et aI.
[1988],
who
observed
similar
fluctuations
over
a short
period
inside
a FTE,
while
during
the
rest
of the
FTE
no interpretation
was
possible.
Another
case
study
(on
ISEE,
also
for northward
Copyright
1993
by the
American
Geophysical
Union.
Paper number 92JA01668.
0148-0227/93/92JA-01668505.00
interplanetary
magnetic
field), made
by Song
et al. [1990],
concluded that the observed fluctuations are not electro-
magnetic
ion cyclotron
waves,
since
their
polarization
is not
left-handed. Rezeau et al. [1989] used GEOS 2 data to characterize the nature of the ultralow-frequency fluctuations
observed
at the magnetopause,
with five conclusions:
(1) The
fluctuations are electromagnetic with •E/[B generally of the order of the Allyen velocity. (2) Their spectrum is generally a
smoothly
decreasing
function
of the frequency.
While always
valid in the boundary layer these two conclusions have to be
taken with caution inside the magnetopause layer itself
because
the spectra
of the electric component
sometimes
showed a maximum around the proton gyrofrequency which could indicate the presence of quasi-electrostatic waves; such a
conclusion should be confirmed by measurements of more than
one component
of the electric
field [Rezeau,
1988]. (3) The
direction of maximum variance of the magnetic components of the fluctuations was found to be always perpendicular to thestatic
magnetic
field while the direction
of minimum
variance
was not so well defined. (4) The fluctuations are very intense(up to 10
2 nT2). (5) They last short
times
(typically
a few
seconds). Thus, while the transverse nature of the fluctuations
suggests
that they are shear Alfven waves, their large
amplitude
and the short duration of the bursts are not
consistent with a left-handed ion cyclotron plane wave. In a
high • plasma,
the sense
of rotation
is not an unambiguous
means
of determining
the mode of propagation.
Indeed,
as
shown
for instance
by Belmont
and Rezeau
[1987],
in a high
•
plasma
the ion cyclotron-shear
Alfven
wave
can be right-
handed. The short duration and large amplitude of the bursts are
more difficult to interpret. Rezeau et al. [1989] suggest two
explanations
which are not mutually
exclusive.
First, the
observed
signature
may be that of a cylindrical
wave,
with an
axis more
or less aligned
with the magnetic
field. Second,
the
nonlinearity
of the Alfven
wave
may lead
to its localization
in
space.
Unfortunately
there exists no model describing
nonlinear Allyen waves developing in a high • plasma, as far as we know.
As it is very difficult,
with a single
spacecraft,
to analyze
small.scale structures that probably vary in space and time, the
180 REZF_AU Lrr AL.: SMALL-SCALE STRUCTURF_• AT TIlE MAGNETOPAUSE
data from ISEE 1 and 2 offer new possibilities regarding the distinction between spatial and temporal variations. Hence the purpose of this paper is to assess the hypothesis made by Rezeau et al. [1989] that the observed fluctuations correspond to small-scale nonlinear Alfven waves traveling along the magnetopause. To fulfill that goal, correlations between ISEE 1 and 2 will be made to try to identify the same structure on the two spacecraft. This will help to characterize the properties of the structure; an attempt will be made, in particular, to estimate its velocity. This will be done by using data from the flux gate magnetometers on ISEE 1 and 2. After subtraction of a running average over 5 s, the obtained frequency range is 0.2 to 8 Hz. This filtering of the data is applied to remove the large-scale variations of the field.
2. CORRELATION BETWEEN STRUCTURES OBSERVED ON BOTH SPACECRAFt
2.1. Comparison of the Signatures on the Two Spacecraft The first case that we consider takes place within a FTE observed at the inner edge of the boundary layer (Figure 1).
During the event the large scale variations of the magnetic
field are very similar on ISEE 1 and !SEE 2. The spacecraft move from the magnetosphere (0254:00) to the boundary layer (0255:30); in between, the magnetic field signature and the density enhancement indicate the presence of a FTE
[Paschmann et al., 1982]. The internal structure of the FTE
[Farrugia
et at., 1988] can be inferred
from the two humps
observed in the density: two density gradients (0254:20.
0254:40 and 0255:05-0255:25) are separated by a region with slower variations. In the lower panels, the power of the
fluctuations is plotted for the two spacecraft. It is clear that the
level of the fluctuations
increases
in the FTE. A striking
feature is also observed: there is a clear asymmetry in the level
of the fluctuations,
which is much
higher
on the boundary
layer side of the FTE than on its magnetospheric side.
It is also worth noticing
that the fluctuations
are highly
structured; a sharp peak is seen at 0255:02 on ISEE 2 followedby another one, 17 s later (Figure 1). Since some structures appear approximately at the same time on ISEE 1, one c•
wonder whether the events observed at the two spacecraft are
the magnetic signatures of localized structures passing by the
two spacecraft at successive times. The corresponding
waveforms are plotted in Figure 2. The first problem to solve is the following: once a given structure is identified on ISEE 2
(at 0255:02), is the maximum observed at approximately the
same time on ISEE 1 the signature of the same structure or the signature of another structure? To answer this question, the cross-correlation functions of the three components of the magnetic fluctuations measured at the two spacecraft locations are used. The correlation function is computed in the following way: we consider a time interval (duration T) on the spacecraft chosen as a reference, centered on the interesting structure (time to). For a given delay x the signal on the other spacecraft
60 40 20 250 2O0 150 100 50 0 ISEE, 8 November 1977 12 8 ISEE 2
200i
ISEE
1
150•
k
2:54:00 2:55:00 2: 56: 00.Fig. 1. Variations of magnetic field, density, and power of the fluctuations in the frequency range 0.2-8 Hz. The arrows
show the localized structures studied in section 2.
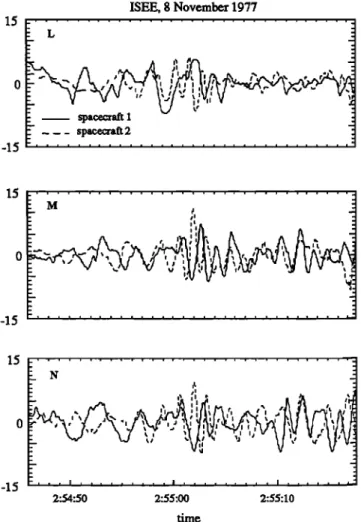
ISEE, 8 November 1977 15 L • I I
o
-
,'
i I i I i I t I t ! • i •0 ""
.t%, t
; I I ! I.
I'1
t,
I
-1• 15 _ N . -15 2:54:50 2:55:00 2:55:10 timeFig. 2. Wavefores of •e fluctuations
plotted • the LMN
REZEAU ET AL.' SMALL-SCALE STRUCTURF.3 AT TIlE MAGNETOPAUSE 181 is considered in the interval [t o + x - TI2; t o + x + T/2]. The
correlation function is normalized by the square root of the autocorrelation functions of the two signals, at times t o and
to + x, respectively.
The results
are plotted
in Figure
3a, with
spacecraft
2 chosen
as the reference,
with to TM
0255:02 and
T = 8 s. The frame of reference is the magnetopause (LMN)
frame. All components show approximately the same behavior: a clear oscillation (with about 1-s period) and about
the same value of the correlation function for small positive delays. For the M component a maximum equal to 0.6 is found for a delay of =2 s. A statistical test has been applied to this value to test its significance. Since the correlation function p
does not have a normal distribution, we follow the method described, for instance, by Bendat and Piersol [1986] and calculate the function w =0.5 ln[(l+p)/(1-p)], which has a normal distribution. The 95% confidence interval obtained for
0.5 a) 0 b) -0.5 ISEE, 8 November 1977 --b2L blL • -b2M blM ... b2N bin ß , ,' i ' ' ' ! , , ß i , , , i , , , • ß ß • _
__112,
, , , , . , , , , , I,, , , I, , , [, ,,
0.5 -0.5 0 4 8 12 delay •b2x blx -- -b2y bly ... bZz blz , ' ' ' i ß ß , i , ß . i ß ß , i , , ß i , ß ,2''
'-h'''
&'"
' 'a2
delaynT 2
b2x
blx -- -b2y
b!y ... b2z
blz
15 10_!
-1
_512 -8
-4
0
4
8
! 2
delayFig.
3. Correlation
functions
for the event
shown
in Figures
1 and 2. The central time is 0255:02 on spacecraft 2, and the
data
from spacecraft
1 are delayed.
(a) The functions
are
normalized
(see
text for details)
and
calculated
over
8 in the
LMN
frame.
(b) Same
in the
minimum
variance
frame
of ISEE
2
(x,y,z). (c) Same as Figure 3b, but the functions
are not
normalized.
p is [0.48; 0.70], which suggests that the two structures are the same. Of course it is not a 100% correlation, which would mean that the two spacecraft are crossing exactly identical structures; looking at Figure 1, it is clear that the amplitude of the signature is weaker for ISEE 1 than for ISEE 2. The correlation functions of the other components look similar, but with lower values of the maxima that are obtained for different delays. Another feature to note is that the maximum
value of the correlation function is also reached for a larger
delay (10 s for the M component), as though ISEE 1 was crossing a second structure similar to the first one, although possibly oriented differently (the N components show a strong correlation for the second event, whereas the correlation was
weak for the first one).
This correlation study indicates that the two spacecraft are likely to cross successively the same structure, or even a chain of structures (that probably evolved between the two
o bs erv ati o ns).
2.2. Characterization of the Structure
This structure will now be characterized on both satellites by
using standard methods usually applied on a single spacecraft,
and the results obtained for the two spacecraft will be
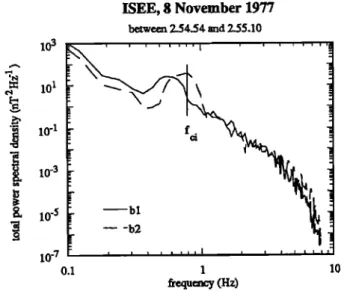
compared. The spectra displayed in Figure 4 are very similar: the general trend is a smooth decreasing law, with an enhancement just below 1 Hz. This enhancement corresponds
to the frequency of the oscillations observed on the correlation
functions. Looking more precisely, one finds that there is a
small shift between the two maxima (0.6 Hz on ISEE 1 and
0.8 Hz on ISEE 2). The spectra p!otted in Figure 4 are the sum
of the spectral densities of the three components; but it is also necessary to study the components separately, to determine
the polarization of the fluctuations. For that purpose, a minimum variance analysis has been performed on the data over 8 s. The main results are summarized in Table 1, where the directions of variance are compared to the direction of the
magnetic field and to the direction of the normal N. The directions obtained on ISEE 1 are also compared to those
obtained on ISEE 2. The polarization is better defined on
spacecraft 2, where the ratio of the minimum to the maxknum
103 ISEE, 8 November 1977 10-7 between 2.54.54 and 2.55.10 0.1 1 10 frequency (Hz)
Fig. 4. Comparison
of the total spectral
densities
of the
fluctuations
on the two spacecraft
(sum of the spectra
of the
three components).182 REZEAU BT AL.: SMALL-SCALE STRUC'I'UR• AT THE MAGNETOPAUSE
TABLE 1. Results of Minimum Variance Analysis
Spacecraft Central Time Variance Ratio Angie ul,N Angie u3,N Angie ul,B Angie u3,B
Ill I I I I II Illll. II II I I II I I
1 0255.03 0.19 52 42 77 34
2 0255.02 0.07 46 44 88 62
ul,ul u2,u2 u3,u3 B,B
35
,,
22 39 9
Here u!, u2, and u3 are the directions of maximum, intermediate, and minimum variances, N is the average normal to the magnetopause, and
variance ratio is the ratio of minimum to maximum variances. The bottom part of the table shows angles between vectors calculated on both
spacecraft.
variance is smaller. The main properties of the minimum variance frames are the following: the directions of maximum variance are almost perpendicular to the static magnetic field
(77 ø and 88ø), and the direction of minimum variance is not
parallel to the magnetic field nor to the magnetopause norma/. This confirms the results obtained on board GEOS 2, where
the most prominent characteristic was also a direction of maximum variance perpendicular to the static magnetic field.
Furthermore, the variance frames are similar on both
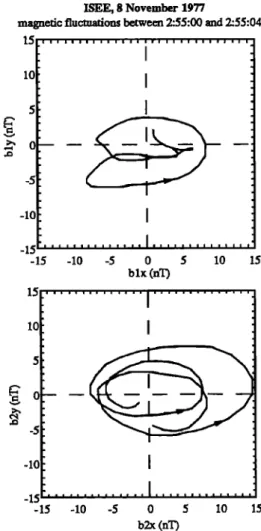
spacecraft. To compare more precisely the polarizations, the hodograms are plotted in the plane of maximum variance obtained on spacecraft 2 (Figure 5). The polarizations look similar: elliptic polarization, with the same sense of rotation (right-hand with respect to the minimum variance direction and with respect to the magnetic field). This right-hand polarization is at variance with the findings of Farrugia et al. [1988]. On the hodogram of spacecraft 2, it is clear that the amplitude of the field first increases and then decreases; this can also be seen in the waveforms of the fluctuations plotted in the spacecraft 2 variance frame (Figure 6). All these
observations confirm that the same structure is likely to be
observed on both spacecraft. The next question is: what else
can be deduced from these two-point measurements, once we
know that it is the same structure? In particular, is it possible
to estimate the velocity of the structure?
2.3. Estimate of the Velocity of the Structure
To help the intepretation, a simple example is considered: a
thin cylindrical current tube moving by the spacecraft at a constant velocity. Minimum variance analysis applied to the
magnetic signature of a current tube gives the direction of the
axis of the structure (minimum variance direction) and the
direction of its velocity relative to the spacecraft (intermediate
variance direction) [Rezeau et al., 1989]. Thus if the variance
frames obtained on the two spacecraft are parallel, the common
direction of intermediate variance is the direction of the
velocity, or at least the direction of its projection on the plane perpendicular to the current. To estimate the magnitude of the velocity, one can use the correlation function. In Figure 7a the magnetic field signature of a thin cylindrical current tube,
moving at 100 km s 'l, is plotted in the minimum variance
frame (z is parallel to the direction of the current, and x to the direction of the velocity). The structure is seen by two spacecraft 255 km apart, and the correlations between the
waveforms are plotted in Figure 7b. The correlation functions show a clear extremum (almost equal to 1) for a delay of-2.5 s, which is exactly equal to the ratio between the projection of the spacecraft separation in the direction of the velocity
(250 kin), and the velocity (100 km s'l). This result
shows
that it is possible to estimate at least one component of the velocity of a moving current tube (the component which is perpendicular to the symmetry axis of the structure).ISEE, 8 November 1977
magnetic fluctuations between 2:55:00 and 2:55:04
•o
]
;>-, •--. --.- -- -5-15
'[ ... [ ...
-15 -10 -5 0 5 10 15 blx (nT) •o 5• 0--
-10-15
-15 -!0 -5 0 5 10 [5 b2x (nT)Fig. 5. Hodograms
of the fluctuations
in the plane defined
by maximum and intermediate variance directions (ca!cuiated on ISEE 2). The sense of rotation is indicated by arrows.
REZEAU El' AL.: SMAIX,-SCALE STRUCrURF_,S AT THE MAGNETOPAUSE 18_3 15 -15 15 -15 ISEE, 8 November 1977 , , , , . , , ...., ,•...,. , , , , , •, ß , . , , ,
x
,. spacecraft 1 • - spacecraft 2 i ß , i ... ß , i , ß . , i , , ,,t . i ! i It
i ! ! I Sl
I I i I I I ß
I I ! ß
i . ] ! I I • I ß
i
15 0 -15 2:54:50 2:55:0 2:55:10Fig. 6. Waveforms of the fluctuations plotted in the
minimum variance frame of ISEE 2 (nanoteslas), for the same
time period as Figure 2.
Let us apply the same method to the case studied previously
from ISEE data. The minimum variance analysis gives the direction of intermediate variance: its components are (-0.996,
0.051, 0.076) in the LMN frame. One possib!e hypothesis to
be checked is whether the structure is being carried by the plasma; to assess this hypothesis, we must compare this velocity to the projection of the ion velocity on the plane
perpendicular to the axis of the structure (actually, it is the
only component of the flow velocity that can be measured if the structure is assumed to have a cylindrical symmetry). In
GSE coordinates the ion velocity direction was found to be
approximately characterized by A =-45 ø and ß =-90 ø at that time [Paschrnann et al., 1978]. Once this velocity direction is
projected in the LMN frame, we get (-0.864, -0.355, -0.357).
This direction
is compared
first to the minimum
variance
direction; since they are found to be almost perpendicular, the velocity of the structure can be compared to the velocity of the plasma (both of them being in the maximum variance plane).
The
angle
between
them
is equal
to 35 ø, and
consequenfiy
the
two velocity vectors are not too far from being parallel.Let us now compute the correlation functions in the variance
frame
(Figure
3b). The method
is the same
as for Figure
3a, but
the
results
are quite different.
For the x component,
the same
features
as before
are found
again,
but the behavior
of the other
components is quite different: the same oscillation exists in
the y component,
but weaker;
for the z component
this fast
oscillation is absent, but another, slower one has appeared.- - -cl•ay
I •,,. t L, I I 1 I I I
--110
...
0
de. JaylO
Fig. 7. (a) Magnetic signatures of a current tube passing by two spacecraft. The crosses indicate the components of the
field on spacecraft 2. The frame of reference is the m'mimum
variance frame (or, equivalently, x along the velocity of the
structure, and z parallel to the direction of the current). (b) The
correlation functions between the signatures shown in Figure
7a.
For the x component, the maxima are similar: 0.65 and 0.7 for
delays of 2 and 10 s. From the smallest delay and from the
interspacecraft distance along the direction of intermediate variance (110 km), the magnitude of the velocity is deduced:
about
55 km s
'!. The plasma
instrument
measures
at that
time a
velocity
of 65 km s
'1. Considering
the lack of precision
of our
estimates, these results are consistent with the magnetic
structure being carried by the plasma flow, along the magnetopause.
2.4. Interpretation
The present study, which is based on dual-spacecraft data and
comparison with a model, confirms the conclusion drawn by Rezeau et al. [1989] on the basis of GEOS 2 data. Short-
duration bursts jn ULF fluctuations observed at, or close to, the
magnetopause are the magnetic signatures of small-scale
structures passing by the spacecraft. The maximum variance of
the observed fluctuations is found to be perpendicular to the
magnetic field. This, together with the observations carried out on magnetic and electric components of the fluctuations observed in the same region (magnetopause and boundary
layer) by GEOS 2 [Rezeau et al., 1989], !cads to the conclusion that these fluctuations are A!fvenic (of shear Allyen type). This spatial confinement of the fluctuations is likely to be due to nonlinear effects: a hypothesis that is supported by their large amplitudes (•JB/B • 0.25). Several studies have been devoted to nonlinear Alfvenic solirons [e.g., Sheerin and Ong, 1980]. An interesting model has been elaborated by Chmyrev et al. [1988] for ionospheric Alfvenic structures:' they demonstrate that a drift instability associated with a density
184 REZF•U ET AL.: SMALL-SCALE STRUCTURF.• AT THE MAGN'LzrOPAUSE
gradient can generate chains of Alfvenic vortices. In our case,
this idea is interesting since (1) a density gradient is present at the inner edge of the boundary layer, and (2) the observed magnetic signatures are consistent with a chain of structures
(in Figure 1, the structure which has been studied above is
followed by another, similar one; the correlation function does
show two maxima with similar values as shown in Figure 3).
The problem with the above interpretation is that the plasma
is assumed to have a small [• value, whereas it is clear that [• is usually of the order of 1 at the magnetopause [Sonnerup et at., 1981]; by now, no equivalent model exists for high beta
plasma. It can be checked that in the case we have studied, the
polarization of the fluctuations (right-hand polarization) is consistent with the polarization obtained in the frame of a linear theory when [•--0.5 [Belmont and Rezeau, 1987]. Then,
since [• is large, the kinetic aspect of the Alfven wave is more
likely to be due to temperature than to the electron inertia. The difficulty in establishing a proper model of kinetic Alfven waves comes first from the high • and second from the determination of the free energy source that leads to the generation of these structures. The density gradient is not the only possible instability factor; actually, the fluctuations are observed also on magnetopause crossings, when there is a magnetic field rotation and not always a density gradient (when the density gradient is distinct from the magnetic
discontinuity). Thus two different mechanisms might take place to generate these structures.
3. DISCUSSION
It has been shown that it is possible to identify the same
small-scale structure on two spacecraft 350 km apart and to infer some of its properties from these dual measurements. Let
us now assess the generality of the methods that have been
applied to this particular event.
3.1. Suitability of the Correlation to Identify a Structure
The above structure has been identified by comparing
signatures on both spacecraft and especially by computing
normalized correlation functions. It is not clear that the
correlation between the two signatures of a given structure
should always be conclusive. For instance, if we consider the
signature of a stationary localized structure, there might be an effect of "perspective": for a current tube signature, the typical width of the magnetic signature is inversely proportional to the distance of closest approach [Rezeau et aI., 1990]. Thus if
the distances of closest approach are different for the two
spacecraft, this is equivalent to correlating functions with different widths (corresponding to different frequencies); consequently, the correlation function is not necessarily close to 1, although the "object" is the same. This effect might explain why in the case studied in section 2, slightly different frequencies, 0.6 and 0.8 Hz, were obtained from the Fourier analysis of data collected at the two spacecraft locations. This would also explain why the maximum of the normalized
correlation function only reached 0.6.
3.2. Influence of the Width of the Spectra
The spectra of the fluctuations are very broad, and all frequencies are present most of the time (Figure 4). A given frequency is likely to be present in the signal, on both spacecraft, even with a low intensity. Thus the efficiency of
the correlation function, normalized by the power of the signal, to select specific frequencies (present at the two spacecraft locations) depends strongly on the actual
intensities. A means of selecting interesting events (intense
together with correlated) could be to use unnormalized
correlation functions; yet in this case, the maximum value of
the function is more difficult to interpret. Figure 3c shows the
unnormalized correlation functions for the case of ISEE data on
November 8, 1977, around 0255:02 (same as Figure 3b). Two
of the features appearing in the normalized correlation functions do not show up in the unnormalized correlation functions: the local maxima observed for a delay of -9 s have a lower amplitude, and the rather high values obtained for the
z component turn out to have no significance since this
component has no power.
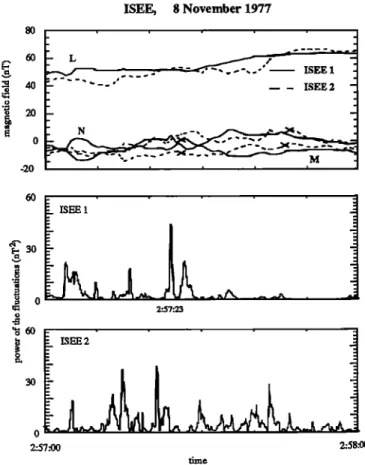
Another example is studied in Figures 8 and 9. It is located again at the inner edge of the boundary layer which is crossed from boundary layer to magnetosphere 2 min after the crossing studied previously. A maximum in the power on board ISEE 1 is observed at 0257:24. Looking at the correlation functions,
this event seems to be correlated mainly with the event observed 9 s before on ISEE 2. The confidence interval for the normalized correlation function (L component) is [0.58; 0.77]. The minimum variance frames calculated for these two events are similar (less than 20 ø of difference). Thus in this
case again, the same structure is likely to be observed by both spacecraft. It can be noticed also that, as in the case previously studied, other maxima can be observed in the correlation
function (for a delay of -3 s, for instance); consequently it is likely that a chain of correlated structures is crossed by the spacecraft. ISEE, 8 November 1977 ß , , 40 - -- - ISEE 2 0 -20 2:57:23 ISEE 2 3O 0 2:57:00 2:58:00 time
Fig. 8. Variations of magnetic field (top panel), and power of the fluctuations (lower panels).
REZEAU ET AL.' SMALL-SCALE STRUCrURF. S AT THE MAGNETOPAUSE 185 8 November 1977 2 • blL b2L - bIM b2M ... bin b2N 3 -3 -24 - 16 -8 0 8 16 24 delay z
Fig. 9. Unnormalized correlation functions for the event identified at 0257:23 on ISEE 1 (Figure 8).
The consequence of the two points discussed above is that in some cases we can efficiently identify the same structure passing by the two spacecraft from the use of the correlation functions, especially when the two spacecraft are located at the same distance from a given structure, which means that the interspacecraft distance is small. In a more general context, another method should be found to identify a structure when the apparent frequencies are different on the two spacecraft. 3.3. Improvement of the Model
The velocity of the structure has been estimated by
combining minimum variance analysis with interspacecraft correlation functions. This was tested on a current tube model. Let us now briefly discuss a more realistic model which takes into account the fact that the fluctuations are Alfvenic and localized but does not assume stationarity in the frame of the
structure. Rezeau et al. [1989] have discussed the case of a
cylindrical Alfven wave, in the linear approximation for a cold
plasma. In the case of hot plasma, the solution is the product of Bessel functions of the radial distance (order 1 and 0) by a
sinusoidal function describing the parallel propagation. An
example of the signature of such an Alfvenic structure is shown
in Figure 10: it is assumed to be developing under the same conditions as on November 8, 1977, at 0255. It is also
assumed to be moving at the plasma velocity past the two ISEE spacecraft. Two parameters are free in the model: the parallel
phase velocity and the parallel wavelength; the perpendicular
extension is then set by the model. The parallel phase velocity
is chosen equal to 367 krn s '1, and the wave length is adapted
to obtain an oscillation at a frequency comparable to the
experimental one. The comparison between Figure 6 and Figure 10 shows that the cylindrical Alfven wave is a
reasonable model to fit ULF fluctuations: the model field has
components in all directions (parallel and perpendicular to the
magnetic field), and the same kind of apparent localization is
observed. The minimum variance analysis applied to these components allows us to find the direction of minimum
variance of the structure (at 1 ø of the direction of the static
magnetic field) and the direction of the velocity. But the
maxima of the correlation functions do not give the exact
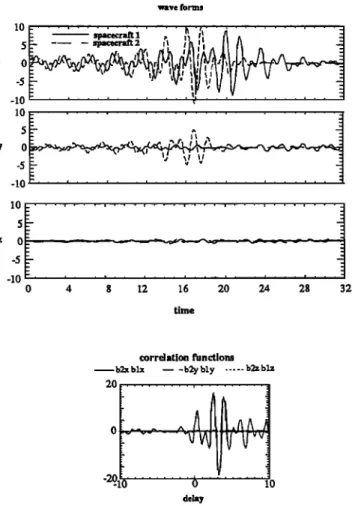
magnitude of the velocity (the delay is 2 s instead of 6 s). The reason for this indeterminacy could be that the structure is not stationary. wave form• ' "• ""' , ß '-", ,' • • ' , "- ß .t ß ß • , ß ." , . . ß '"s ß . ß
10
5g-• ... spacecrattl
--- - spacecraft:2 •' • 'I /• ^
t• •, I! t• o -5 -10 lO -5 -10 10 ' ' ' • ' ß ' * ' a .... ' , ' ' ' • ' ' ß '" ' ' ' • ' ß ß , ß ß '.!
-10 0 4 8 12 16 20 24 28 32 time 2O -2o40, correlation functions --b2x blx w -b2y bly ... b2z blz ... 6 ... ioFig. 10. Magnetic signatures of a linear cylindrical kinetic Alfven wave seen by two spacecraft. The frame of reference is the minimum variance frame (z is parallel to the symmetry axis of the structure, and z to the velocity). Below are the correlation functions of the three components (normalized).
The vertical units are arbitrary.
3.4. Discussion of the Model
The cylindrical Alfven model can provide a reasonable fit, but it is difficult to understand why such a localized structure should develop at some places rather than at others. Given the
large amplitude of the structure (SB/B • 0.25), it is tempting to think that the spatial confinement of the structure results from
a filamentation of the plasma due to the nonlinearity. Then the
spatial extension would result from the balance between
nonlinear effects and dispersion. Nonlinear models proposed by Sheerin and Ong [1980] or Chmyrev et al. [1988] give
evidence for cylindrical localized structures, or chains of
structures localized along the generating discontinuity which
wou!d fit very well with our findings. As discussed above, the
assumption made by these authors that [• is much smaller than 1 is not valid in the present context.
4. CONCLUSION
ULF fluctuations appear as short-duration (a few seconds), intense (SB/B up to 0.25) bursts. Single-point measurements
do not allow us to assess whether this short duration results from temporal or spatial variations. By using the two ISEE
spacecraft, 350 km apart, we were able to identify the same
186 ••,U ET AL.' SMALL-SCALE STRUCTURES AT THE MAGNETOPAUSE
the two signatures, This suggests that the short duration of the ULF bursts primarily results from the fast motion of a spatially localized structure moving by the spacecraft. The delay between the two magnetic signatures is consistent with the
structure
moving
at about
55 Pan
s
'l, which
is of the same
order
and is in the same direction as the measured flow velocity along the magnetopause at that time. Given the variability of the flow, the above findings should only be considered as an indication and not as a definitive proof.Comparison
between
the magnetic
signatures
of the
observed structures and that of a model cylindrical structure has
been carried out. It shows a good a•reement, thereby suggesting that IS EE ! and 2 were Observing cy!indrical Alfvenic structures carried by the flowing plasma. ß
In the cases studied in this, paper the interspacecraft distance
was less than 500 km, and still there were large differences in
the observations of the magnetopause and adjacent regions by the two spacecraft. This means that the boundaries have time
to evolve and to move between the observations at the two
spacecraft locations. To be able to study a small-scale structure
from its signatures on both spacecraft, the first condition is that the boundary on which it is observed is similar at the two
locations;
otherwise
it would
not be possible
to recognize
the
structure. The conclusions which come out of this study for
•uture
multiple-spacecraft
studies
of the boundaries
are that
(1)
correlations are only possible for short interspacecraft distances and (2) it is necessary to develop new tools to make the best use of multiple-spacecraft data in cases. where the correlation functions do not provide unambiguous results.
Acknowledgments. We are grateful to J. T. Gosling, S. I. Barne and
G. Paschmann
for
freely
providing
the
FPE
data
used
in this
study.
The Editor thanks B. T. Tsurutani and another referee for their
assistance in evaluating this paper.
REFE•N•S
Anderson, B. J., S. A. FuseHer, and D. Murr, Electromagnetic ion
cyclotron waves observed in the plasma depletion layer, Geophys.
Res. Lett., 18, 1955-1958, 1991.
Anderson, R. R., C. C. Harvey, M. M. Hoppe, B. T. Tsurutard, T. E.
Eastman, and J. Etcheto, Plasma waves near the magnetopause, J. Geophys. Res., 87, 2087-2107, 1982.
Belmont, G., and L. Rezeau, Finite Larmor radius effects: The two-fluid
approach, Ann. Geophys., Set. A, 5, 59-70, 1987.
Bendat, J. S., and A. G. Piersol, Random Data: Analysis and
measurements procedures, J'ohn Wiley, New York, 1986.
Chmyrev, V. M., S. V. Biliehenko, O. A. Pokhotelov, V. A. Marchenko,
V. I. Lazarev, A. V. Streltsov, and L. Stenflo, A!fven vortices and
related phenomena in the ionosphere and the magnetosphere, Phys.
Scr., 38, 841-854, !988.
Farmgia, C. J., R. P. Rijnbeek, M. A. Saunders, D. I. Southwood, D. Y.
Rodgers, M. F. Smith, C. P. Chaloner, D. S. Hall, P. J. Christiansen,
and L. J. C. Woolliseroft, A multi-instrument study of flux transfer
event structure, J. Geophys. Res., 93, 14,465-14,477; 1988.
Gendrin, R., Magnetic turbulence and diffusion processes in the
magnetopause boundary layer, Geophys. Res. Lett., 20, 769-771,
1983.
Gumett, D. A., R. R. Anderson, B. T. Tsumtani, E. I. Smith,
G. Paschmann, G. Haerende!, S. J. Bame, and C. T. Russell, Plasma
wave turbulence at the magnetopause: Observations from ISEE 1 and
2, J. Geophys. Res., 84, 7043-7058, 1979.
Holzer, R. E., M. G. McLeod, and E. J. Smith, Preliminary.r•sults from
the OGO 1 search coil magnetometer: Boundary posltions and magnetic noise spectra, o r. Geophys. Res., 7•, 1481-1486, 1966. LaBe!le, J., and R. A. Treumann, Plasma waves at the dayside
magnetopause, Space Sci. Rev., 47, 175-202, 1988.
Paschmann, G., N. Sckopke, G. Haerendel, J. Papamastorakis, S. J.
Bame, J. R. Asbridge; J. T. Gosling, E. W. Hones, Jr., and E. R. Tech,
ISEE plasma observations near the subsolar magnetopause, Space
$ci. Rev., 22, 717, !978.
Paschmann, G., G. Haerendel, I. Papamastorakis, N. Sckopke, S. J.
Bame, 2[. T. Gosling, and C. T. Russell, Plasma and magnetic field
characteristics of magnetic flux transfer events, or. Oeophys. Res., 87, 2159-2168, 1982.
Rezeau L., Turbulence des ondes d'Alfven au voisinage de la
magn6topause terrestre, thesis, Paris 6 Univ., 1988.
Rezeau, L., A. Morane, S. Pertaut, A. Roux, and R. Schmidt,
Characterization of Alfvenic turbulence in the magnetopause
boundary layer, or. Geophys. Res., 94, 101-1!0, 1989.
Rezeau, L., A. Roux, and N. Cornilleau-Wehfiin, Multipo'mt study of
small scale gtructures at the magnetopause, in Proceedings of
International Workshop on Space Plasma Physics Investigations by
Cluster and Regatta, Graz, February 1990, Eur. Space Agency Spec. Publ., ESA SP-306, 103-108, 1990.
Sheerin, Y. P., and R. S. B. Ong, Solitary Alfven waveguide structures in
a magnetized plasma, J. Plasma Phys., 24, 157-162, 1980.
Song, P., R.,C. Elphic, C. T. Russell, J. T. Gosling, and C. A. Cattell,
Structure and properties of the subsolar magnetopause for northward
IMF: ISEE observations, J. Geophys. Res., 95, 6375-6387, 1990.
Sonnerup, B. U. {•., G. Paschmann, I. Papamastorakis, N. Sckopke,
G. Haerendel, S. J. Bame, J. R. Asbridge, J. T. Gosling, and C. T.
Russell, Evidence for magnetic field reconnection at the Earth
magnetopause, J. Geophys. Res., 86, 10.049-10.067, 1981.
Thorne, R. M., and B. T. Tsurutani, Wave particles interactions in the
magnetopause boundary layer, in Physics of Space Plasmas, SPI
Conf. Proc. Reprint Ser., vol. 10, edited by T. Chang, G. B. Crew, and
J. R. Jasperse, p. 1-32, Scientific, Cambridge, Mass., 1991.
Treumann, R. A., J. LaBel/e, and R. Pottelette, Plasma diffusion at the
magnetopause: The case of lower hybrid drift waves, or. Geophys.
Res., 96, 16,009-16,013, 1991.
Tsurutani, B. T., and R. M. Thorne, Diffusion processes in the
magnetopause boundary layer, Geophys. Res. Lett., 9, 1247-!250,
!982.
Tsumtani, B. T., A. L. Brinca, E. J. Smith, R. T. Okida, R. R. Anderson,
and T. E. Eastman, A statistica! study of ELF-VLF plasma waves at
the magnetopause, J. Geophys. Res., 94, !270-!280, 1989.
L. Rezeau and A. Roux, CNET-CNRS, 38-40 rue du G6n6ra!
Leclerc, F-92131 Issy-!es-Moulineaux, France.
C. T. Russel/, IGPP, University of Calffo•a, Los Angeles, CA 90024.
(Received January 6, 1992;
revised July 3, 1992;