A model for episodic degassing of an andesitic magma intrusion
Texte intégral
Figure


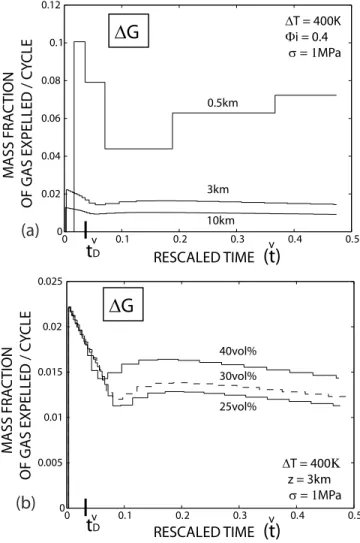
![Figure 9. Evolution of the time interval Dt between two consecutive gas pulses, in days, plotted as a function of the rescaled time t, for different values of the initial crystal content F i in [25 – 40] vol %](https://thumb-eu.123doks.com/thumbv2/123doknet/14792664.602100/14.918.90.452.82.356/figure-evolution-interval-consecutive-plotted-function-rescaled-different.webp)

Documents relatifs
Eventually, we evaluate the applicability of monitoring flow conditions from observed ground deformation by using simplified conduit flow models, coupled with elastic deformation in
Also, on the basis on the observations that quantum mechanics shows that the electron seems to follow several trajectories simultaneously and the theory
Le diagnostic a été évoqué devant un abcès cervical (1cas), une médiastinite(3cas) , par exploration chirurgicale (3cas) et suite a une plaie par arme
The study of welding processes currently appears as an area of research both open and complex because it requires to share of knowledge in different fields of physics
The study of welding processes currently appears as an area of research both open and complex because it requires to share of knowledge in different fields of physics
Elle n’a pas pensé qu’il était tard et qu’il faisait froid : il y avait dans sa tête une foule de questions qui la préoccupaient depuis tellement longtemps.. Lorsque
-Excuse moi….J’ai oublié de te prévenir….J’ai décidé de fermer pour la semaine…..Avec tous ces blocages de rond points autour de chez nous, je n’ai pas reçu les
Judith ce demande milles fois par jour ce qui pourrait ce passer si elle raconte tout, mais elle sait que en elle à besoin elle doit parler ….. Elle prends alors on telephone
