HAL Id: hal-00301813
https://hal.archives-ouvertes.fr/hal-00301813
Submitted on 22 Sep 2005HAL is a multi-disciplinary open access
archive for the deposit and dissemination of sci-entific research documents, whether they are pub-lished or not. The documents may come from teaching and research institutions in France or abroad, or from public or private research centers.
L’archive ouverte pluridisciplinaire HAL, est destinée au dépôt et à la diffusion de documents scientifiques de niveau recherche, publiés ou non, émanant des établissements d’enseignement et de recherche français ou étrangers, des laboratoires publics ou privés.
Volatile organic emissions from the distillation and
pyrolysis of vegetation
J. P. Greenberg, H. Friedli, A. B. Guenther, D. Hanson, P. Harley, T. Karl
To cite this version:
J. P. Greenberg, H. Friedli, A. B. Guenther, D. Hanson, P. Harley, et al.. Volatile organic emissions from the distillation and pyrolysis of vegetation. Atmospheric Chemistry and Physics Discussions, European Geosciences Union, 2005, 5 (5), pp.9097-9126. �hal-00301813�
ACPD
5, 9097–9126, 2005VOC emissions from vegetation pyrolysis J. P. Greenberg et al. Title Page Abstract Introduction Conclusions References Tables Figures J I J I Back Close
Full Screen / Esc
Print Version Interactive Discussion
EGU
Atmos. Chem. Phys. Discuss., 5, 9097–9126, 2005 www.atmos-chem-phys.org/acpd/5/9097/
SRef-ID: 1680-7375/acpd/2005-5-9097 European Geosciences Union
Atmospheric Chemistry and Physics Discussions
Volatile organic emissions from the
distillation and pyrolysis of vegetation
J. P. Greenberg, H. Friedli, A. B. Guenther, D. Hanson, P. Harley, and T. KarlNational Center for Atmospheric Research, Boulder, Colorado, 80307-3000, USA
Received: 4 August 2005 – Accepted: 6 September 2005 – Published: 22 September 2005 Correspondence to: J. P. Greenberg ([email protected])
ACPD
5, 9097–9126, 2005VOC emissions from vegetation pyrolysis J. P. Greenberg et al. Title Page Abstract Introduction Conclusions References Tables Figures J I J I Back Close
Full Screen / Esc
Print Version Interactive Discussion
EGU
Abstract
Leaf and woody plant tissue (Pinus ponderosa, Eucalyptus saligna, Quercus
gam-belli, Saccharum officinarum and Oriza sativa) were heated from 30 to 300◦C and
volatile organic compound (VOC) emissions were identified and quantified. Major VOC emissions were acetic acid, furylaldehyde, methyl acetate, pyrazine, terpenes, 2,3-5
butadione, phenol and methanol, as well as smaller emissions of furan, acetone, ac-etaldehyde, acetonitrile and benzaldehyde. Total VOC emissions from distillation and pyrolysis were on the order of 10 mgC/gC dry weight of vegetation, as much as 33% and 44% of CO2 emissions (gC(VOC)/gC(CO2)) measured during the same experi-ments, in air and nitrogen atmospheres, respectively.
10
The emissions are similar in identity and quantity to those from smoldering com-bustion of woody tissue and of different character than those evolved during flaming combustion. VOC emissions from the distillation of pools and the pyrolysis of veg-etation heated under low turbulence conditions produces concentrations near leaves that reach the lower limits of flammability and the emissions may be important in the 15
propagation of wildfires. VOC emissions from charcoal production are also related to distillation and pyrolysis; the emissions of the highly reactive VOCs from production are as large as the carbon monoxide emissions.
1. Introduction
Combustion of vegetation occurs in several consecutive stages: distillation, endother-20
mic pyrolysis, exothermic pyrolysis, ignition, flaming combustion and smoldering com-bustion. Gaseous organic and inorganic emissions, as well as readily condensable compounds (tars), are produced during these stages. However, the composition and rates of emission vary significantly among the different combustion stages.
Numerous reports have identified and quantified volatile organic compound (VOC) 25
re-ACPD
5, 9097–9126, 2005VOC emissions from vegetation pyrolysis J. P. Greenberg et al. Title Page Abstract Introduction Conclusions References Tables Figures J I J I Back Close
Full Screen / Esc
Print Version Interactive Discussion
EGU
gional (e.g. Wotawa and Trainer, 2000) and global (Crutzen and Andreae, 1990) influ-ence of emissions on atmospheric chemistry and radiation is very large, because many of the gaseous emissions are very reactive and primary and secondary aerosols from fires scatter or absorb solar radiation. Emission ratios (expressed relative to CO2 or CO emissions) or emission factors (g emission/kg fuel burned) for VOCs have been de-5
rived from laboratory experiments, measurements of fires at ground-level, or by aircraft in smoke plumes. Samples are often collected into canisters and analyzed at a remote laboratory by GC-FID or GC-MS (e.g., Greenberg et al., 1984; Friedli et al., 2001) or are analyzed by on-line techniques (Lobert et al., 1991; Yokelson et al., 1996; Bertschi et al., 2003). Smoke plume studies typically do not characterize VOC emissions from 10
different stages of combustion, since most plumes include a combination of all stages. The work presented is focused on those emissions that occur during the pre-flaming stage of fires. These emissions arise during the initial heating of vegetation up to 300◦C, before exothermic pyrolysis begins. Leaf and woody plant tissue were studied. The emissions measured are first used to infer their influence on fire propagation. The 15
VOC emissions are then compared with emissions from smoldering combustion, which constitutes a large, difficult to characterize VOC source. The emissions are finally applied to charcoal production, a globally significant form of biomass burning.
2. Experimental information
2.1. Experimental setup 20
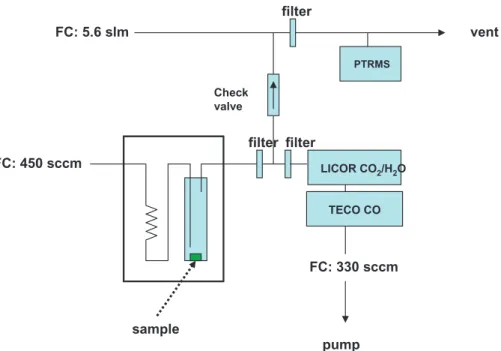
The experimental setup is shown schematically in Fig. 1. Vegetation samples were placed at the bottom of a roasting chamber (100 ml Pyrex cold finger). Purge gas was introduced through the central tube and flow exited through the side tube. Gas flow through the chamber was controlled by a mass flow controller (Unit Instrument Company, Yorba Linda, CA). A gas chromatograph oven (model HP5880A, Hewlett-25
roast-ACPD
5, 9097–9126, 2005VOC emissions from vegetation pyrolysis J. P. Greenberg et al. Title Page Abstract Introduction Conclusions References Tables Figures J I J I Back Close
Full Screen / Esc
Print Version Interactive Discussion
EGU
ing chamber. Purge gas was preheated through a stainless steel coil (2.2 mm ID × 4 m), which also sat within the oven. The effluent flow was split into 2 streams: one went directly to analyzers for CO2and CO; the flow rate through this branch was con-trolled by the mass flow controller of the CO instrument. The second branch was diluted further (approximately 8:1) with purge gas flow by way of another mass flow controller; 5
an aliquot of this flow was continuously sampled for VOCs by proton transfer reaction mass spectrometry. Filters (Pall-Gelman glass fiber Acrodisc, 1 µm pore size) were placed at several points in the sample flow path to trap condensable products (tars) before they entered the analytical instruments. All sample lines were Teflon.
The oven was programmed from 30◦C to 300◦C (higher temperatures were avoided 10
to preclude exothermic pyrolysis) at a program rate of 10◦C/min, with initial and final temperature holds of 2 and 15 min, respectively. Only ultra-high purity air or nitrogen was used.
2.2. Vegetation
Experiments were conducted with leaf material from 5 species: Gamble oak (Quercus 15
gambelli), ponderosa pine (Pinus ponderosa), eucalyptus (Eucalyptus saligna), sugar
cane (Saccharum officinarum), and rice (Oriza sativa) and woody plant tissue from 2 species (P ponderosa, E saligna). Plant species were chosen to represent genera in landscapes frequently consumed by wildfires or agricultural burning. Sugar cane stubble and rice straw are often burned after harvest in tropical areas.
20
Typically three experiments were made with each species in air and one in nitro-gen. E. saligna, Q. gambelli, O. sativa and S. officinarum leaves were harvested from young greenhouse-grown plants; P. ponderosa needles and wood were harvested from a mature tree growing outside in Boulder, CO. Green woody tissue from a greenhouse-grown, juvenile E saligna was also tested. Vegetation samples were cut from living veg-25
etation. The fresh cuttings were weighed to the nearest 0.1 mg. Three additional cut-tings were weighed fresh, then placed in drying oven (60◦C) overnight, then reweighed to allow for the calculation of the dry weight of vegetation tested. After experiments,
ACPD
5, 9097–9126, 2005VOC emissions from vegetation pyrolysis J. P. Greenberg et al. Title Page Abstract Introduction Conclusions References Tables Figures J I J I Back Close
Full Screen / Esc
Print Version Interactive Discussion
EGU
the residue left in the roasting chamber was also weighed. 2.3. Proton transfer reaction mass spectrometry (PTRMS)
PTRMS was used to measure many VOCs produced in the roasting process. The lab-built instrument has been described in detail previously (Hanson et al., 2003). In the technique, a proton (from H3O+) was transferred to the VOC reactant by soft collision 5
in a drift tube and passed through an orifice into a quadrupole mass spectrometer. Selected masses, corresponding to sample VOCs (parent or fragments ions), were monitored and quantified.
Calibration of responses for target VOCs were determined by several methods. When accurate and stable compressed gas mixtures containing target VOCs were 10
available (acetonitrile, isoprene, terpenes, benzene, toluene), these were diluted to sample concentration ranges with a dynamic dilution system. For some VOCs (methanol, acetaldehyde, and acetone), calibrated permeation tubes (VICI Metronics, Poulsbo, WA) were used in a permeation tube calibration system (Kintek, La Marque, TX) to produce desired concentrations. For VOCs where no authentic standards were 15
available, responses were calculated using measured PTRMS transmission character-istics and rate constants for the ion reaction of VOC with water ion clusters (Warneke et al., 2003).
2.4. Gas chromatography-mass spectroscopy (GCMS)
For each vegetation species studied, VOCs were also determined by GCMS (Hewlett-20
Packard model 5921MS/5890GC, Palo Alto, CA). Samples were collected into elec-tropolished stainless steel canisters when oven temperatures were 250–300◦C. Can-isters were flushed with PTRMS sample stream air for several minutes before sample flow was captured. Samples were analyzed according to methods previously described (Greenberg et al., 1999).
ACPD
5, 9097–9126, 2005VOC emissions from vegetation pyrolysis J. P. Greenberg et al. Title Page Abstract Introduction Conclusions References Tables Figures J I J I Back Close
Full Screen / Esc
Print Version Interactive Discussion
EGU
2.5. Carbon dioxide (CO2)
CO2 was analyzed continuously by a non-dispersive infrared analyzer (model 6262, LICOR Inc, Lincoln, NE) connected in series with the undiluted sample outflow. Sam-ple air was pulled at atmospheric pressure and at constant rate (by way of the pump and flow controller of the CO instrument). CO2concentrations were calibrated against 5
a commercially prepared compressed gas standard (1428 ppm CO2, Scott Specialty Gases, Plumsteadville, PA).
2.6. Carbon monoxide (CO)
CO in the undiluted sample flow was measured by UV absorption (Themo-Environmental Corp., Model 14C, Franklin, MA). CO concentrations were calibrated 10
against NIST SRM#2612a.
2.7. Thermo-gravimetric analysis (TGA)
Q. gambelli oak leaf and P. ponderosa needle samples were analyzed by
thermo-gravimetric analysis (Cahn Instruments, model TGA 131 thermo-graphic analyzer, ThermoElectron Corp., Newington, MA), which tracks mass loss of samples as a func-15
tion of temperature. Ten to 60 mg of sample were placed in the microbalance of the TGA and heated at 10◦C/min from room temperature to 700◦C. The decrease in mass and the rate of change of mass as a function of temperature were recorded. The heating was carried out in a 200 ml/min flow of air or nitrogen in separate experiments.
ACPD
5, 9097–9126, 2005VOC emissions from vegetation pyrolysis J. P. Greenberg et al. Title Page Abstract Introduction Conclusions References Tables Figures J I J I Back Close
Full Screen / Esc
Print Version Interactive Discussion
EGU
3. Results
3.1. GCMS
VOCs emitted during the heating of the vegetation were analyzed and components identified by GCMS. Emissions were dominated by oxygenated volatile organic com-pounds. Major emissions from the five species studied were largely the same and 5
include (in order of molecular weight) methanol, acetonitrile, acetaldehyde, acetone, acetic acid, furan, methyl acetate, pyrazine, 2,3 butadione, phenol, furylaldehyde, ben-zaldehyde, and terpenes. No major alkane, alkene or aromatic emissions were ob-served by GCMS or PTRMS at these temperatures, consistent with the physics of the pyrolysis process (Yokelson et al., 1996). It is likely that some VOCs, especially oxy-10
genated VOCs, were not efficiently transferred from canisters to the GCMS system (Friedli et al., 2001). Quantitative GCMS analysis was not made for samples from canisters.
3.2. PTRMS, CO2, and CO
Individual ions for PTRMS analysis were selected through comparison with GCMS 15
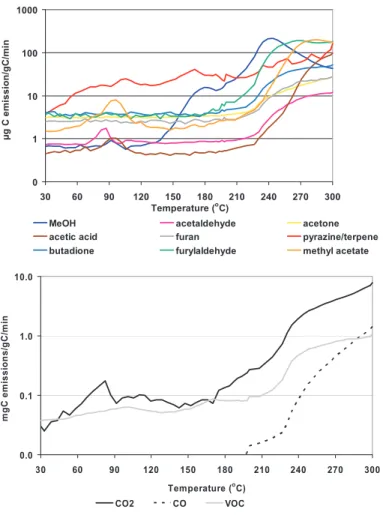
analyses. Emissions of VOCs from E. saligna are shown in Fig. 2, which also in-cludes results for CO and CO2 experiments conducted simultaneously with PTRMS experiment. In all experiments, the emissions of CO2 were the largest by volume. At lower temperatures, CO emission rates exceed those for VOCs, but near the higher temperature limit (300◦C) CO and VOC emission rates were approximately the same. 20
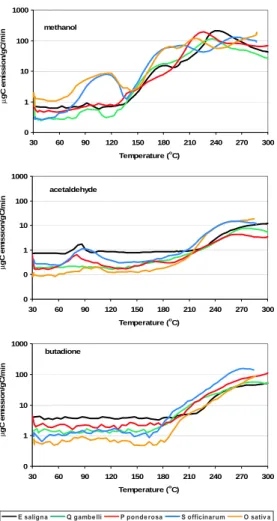
Emissions for most VOCs have similar temperature profiles for the 5 vegetation species (Fig. 3). (Acetic acid, methyl acetate, phenol and benzaldehyde were not selected for measurements of Q. gambelli; benzaldehyde was not selected for measurements of P.
ponderosa.)
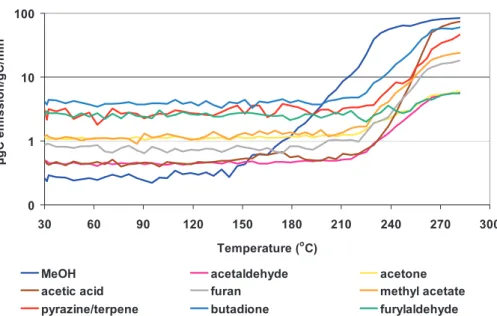
Emissions from woody plant tissue species (P. ponderosa and E. saligna) are shown 25
ACPD
5, 9097–9126, 2005VOC emissions from vegetation pyrolysis J. P. Greenberg et al. Title Page Abstract Introduction Conclusions References Tables Figures J I J I Back Close
Full Screen / Esc
Print Version Interactive Discussion
EGU
to those found for leaf tissue. 3.3. TGA
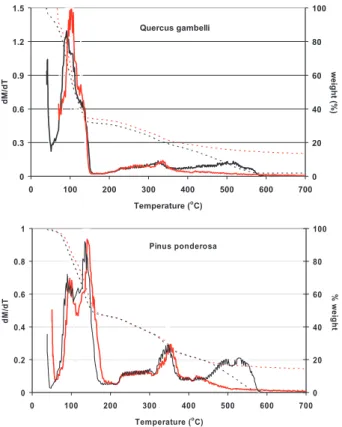
Qualitatively, the patterns from TGA for Q. gambelli and the P. ponderosa are sim-ilar (Fig. 5). Water and some stored organic compounds are distilled below 150◦C. Between approximately 150◦C and 360◦C, volatile organic compounds (VOCs), CO 5
and CO2 are released in both nitrogen and air and correspond to the pyrolysis (py-rolytic decomposition) of hemicellulose and cellulose in the vegetation. Above 360◦C, the behavior of the processes in air and nitrogen diverge: in air, exothermic pyrolysis proceeds with additional CO2 and CO emitted between 400 and 600◦C; above 600◦C only ash remains. In nitrogen, there is apparently little release of CO and CO2 at the 10
temperatures above 400◦C. 3.4. Mass balance
Table 1 compiles data for moisture content, emissions and residue after heating. Tar collected on the filters was not weighed and is, therefore, not included in the mass balance. More carbon was released in the emissions in the air than in nitrogen exper-15
iments. The carbon content of the residue was not determined analytically, but was computed to achieve mass balance (assuming that the contribution of tars was negli-gible). The residue of the air and nitrogen experiments had approximately the same carbon content.
3.5. Emission rate uncertainties 20
Calibrations for several of the VOCs determined (acetonitrile, terpenes) were made from compressed gas standards; the concentration of these standards was confirmed in comparison with other compressed gas standards using GC-FID (Apel et al., 1994). The accuracy of these standards was judged to be within 5%. For methanol, acetalde-hyde and acetone, calibrations were made with respect to calibrated permeation tubes. 25
ACPD
5, 9097–9126, 2005VOC emissions from vegetation pyrolysis J. P. Greenberg et al. Title Page Abstract Introduction Conclusions References Tables Figures J I J I Back Close
Full Screen / Esc
Print Version Interactive Discussion
EGU
Permeation tubes were weighed periodically to determine the mass emission rate of the VOCs. The tube emission rates determined agreed within 10% of the emission rates specified by the supplier.
In the cases of most VOCs measured by PTRMS, no primary standard was available. For these VOCs the concentrations were calculated (after Warneke et al., 2003) using 5
literature rate constants for the reaction of the VOC with H3O+, mass spectrometer transmission characteristics (determined experimentally), and the reaction time within the drift tube. Since most VOCs have a reaction rate with H3O+determined by collision rate, the rate constants for the reactions are similar and an average rate constant was used when none were available from literature (Spanel and Smith, 1999, and 10
references therein). The uncertainty associated with concentration estimates for these VOCs may be as large as a factor of 2.
Any losses of VOCs in the experimental system were assumed negligible for the VOCs reported here. Higher molecular weight VOCs (tars) that condensed on filters were not measured.
15
Calibration for CO2was made using a primary standard of CO2in air (1430±20 ppm). The concentrations determined were estimated to be accurate to within 5%. CO deter-minations were made with respect to NIST SRM #2612a (9.6±0.12 ppm CO in nitro-gen); uncertainties were estimated to be approximately 10%.
Mass flow meters were calibrated against bubble flow meters for the lower flow 20
ranges (<500 sccm) and against a wet test meter (Precision Scientific CO, Chicago, IL) for larger flows. The uncertainties in flows are less than a few percent. Fresh and dry leaf or wood tissue was measured to the nearest 0.1 mg for 3 samples of each species to determine moisture content; the uncertainty of the moisture content is within 10%.
25
Errors were propagated using uncertainties in flow rates, vegetation moisture con-tent and calibration standards. The errors in the emission rates for methanol, acetalde-hyde and acetone (determined from permeation tubes) were approximately 15%; for terpenes and acetonitrile, where a dynamic dilution of flow from a compressed gas
ACPD
5, 9097–9126, 2005VOC emissions from vegetation pyrolysis J. P. Greenberg et al. Title Page Abstract Introduction Conclusions References Tables Figures J I J I Back Close
Full Screen / Esc
Print Version Interactive Discussion
EGU
standard produced calibration mixtures, the uncertainty was also on this order. In the case of those VOCs whose concentrations were calculated from rate constants and ion transmission properties of the PTRMS, the uncertainties in the emissions rates were dominated by the uncertainty in the calculation of response factors and were probably on the order of a factor of 2. Uncertainties in CO2and CO emissions are estimated to 5
be approximately 15%.
4. Discussion
4.1. Combustion process
Combustion may be divided into several phases (Browne, 1958), each with distinct emissions and emission rates. Distillation occurs at temperatures up to 200◦C; water, 10
methanol, terpenes and other VOCs stored in liquid pools are emitted during distilla-tion. These emissions are the largest weight loss fraction, since they include water, which represented 50–80% of the weight of fresh vegetation (Table 1). Endothermic, low temperature pyrolysis (thermal degradation of organic compounds) takes place be-tween 200 and 280◦C; methanol, acetic acid, and other oxygenated VOCs are released 15
during this stage. Significant emissions of CO2 and CO from the breakdown of hemi-cellulose and hemi-cellulose also occur during endothermic pyrolysis (Fig. 2). Between 280 and 500◦C, exothermic pyrolysis occurs; a combustible mixture of VOCs and tars are emitted, but were not quantified or identified in the experiments.
Additional CO2and CO emissions observed between 400 and 600◦C are produced in 20
exothermic pyrolysis reactions involving oxygen and are not seen in the TGA nitrogen experiments (Fig. 5). In both air and nitrogen, water vapor emitted comes not only from distillation of stored water but also from dehydration of cellulose during pyrolysis. Consequently, the residue of pyrolysis has a higher carbon percent composition than the fresh vegetation (approximately 44% by weight for cellulose). The residue (Table 1) 25
ACPD
5, 9097–9126, 2005VOC emissions from vegetation pyrolysis J. P. Greenberg et al. Title Page Abstract Introduction Conclusions References Tables Figures J I J I Back Close
Full Screen / Esc
Print Version Interactive Discussion
EGU
ponderosa leaf tissue, but enriched to over 80% for S. officinarum and O. sativa leaf
tissue. At high carbon enrichment, the residue is called charcoal. Charcoal, a black-body radiation absorber, has a low temperature of spontaneous ignition compared to other pyrolysis products. Reactions among pyrolysis products and with oxygen may be catalyzed by charcoal (Browne, 1958).
5
An ignition point is finally reached when the process becomes exothermic and flam-ing combustion begins. Aromatic, olefinic and aliphatic organic compounds are re-leased in the flaming stage, along with additional CO and CO2. After flaming is ex-tinguished, smoldering combustion continues (Yokelson et al., 1997; Bertschi et al., 2003).
10
4.2. Emission comparison among species
Emissions were lowest at the lowest temperatures and highest near 300◦C for most VOCs (Fig. 3). Methanol, acetaldehyde, acetone, acetic acid and methyl acetate had local maxima between 90 and 120◦C in vegetation species where they were moni-tored (acetic acid and methyl acetate were not monimoni-tored for Q gambelli); from the 15
TGA (Fig. 5) and PTRMS (Fig. 2) analyses, we assume that water and these VOCs were present in fresh plant tissue and were distilled early in the temperature program (60–150◦C). Most other emissions occurred at significantly higher temperatures (200– 300◦C). Several VOCs showed at least 2 local maxima in emissions up to 300◦C, in-dicating that their emission may have more than one source. For example, methanol 20
is both present initially as a dissolved component in leaf water and also is released in the de-methylation of pectin at higher temperatures (Fall, 1999). The two grasses,
S. offcinarum and O. sativa, emitted little furylaldehyde compared to leaves from the
woody plant species. O. sativa emitted more acetic acid than other species, while P.
ponderosa emitted more terpene and phenol. Q gambelli also emitted significantly
25
more furyl aldehyde.
Pyrazine and terpenes both give the characteristic m/z 81 in PTRMS analysis. For
ACPD
5, 9097–9126, 2005VOC emissions from vegetation pyrolysis J. P. Greenberg et al. Title Page Abstract Introduction Conclusions References Tables Figures J I J I Back Close
Full Screen / Esc
Print Version Interactive Discussion
EGU
these species do not have stored terpenes. For P. ponderosa and E. saligna, which contain stored terpenes, m/z 81 probably represents terpene at temperatures below 200◦C and a mixture of pyrazine and terpenes at higher temperatures. Near 300◦C, CO2was the largest component of emissions; CO2emissions were also detected even at the lowest temperatures of the air experiments.
5
For all species, VOC emissions in the temperature range 30–300◦C were approxi-mately the same in pattern and magnitude in air and nitrogen experiments. The excep-tion was found for furylaldehyde, which was emitted from the grasses at a significantly higher rate in nitrogen than air. The ratio of VOCs to CO2 emissions is higher in the nitrogen experiments, while the ratio of CO to CO2 remains approximately the same 10
(Table 2). Reactions of plant tissue with oxygen likely contribute to additional CO2and CO emissions.
TGA analyses indicated additional emissions of VOCs up to 350◦C, above which no substantial emissions were seen until approximately 500◦C. The additional emissions between 300 and 350◦C were assumed to be comprised of the same VOCs emitted at 15
300◦C, since many VOCs had near their maximum emissions at about 300◦C. Emis-sions above 500◦C are probably CO2 and CO emissions from the reaction of oxygen with organic material, since these emissions were not seen in the nitrogen experiments. Some VOCs may not have been measured by PTRMS because parent or fragment ions were not monitored during experiments or because the PTRMS technique was not 20
sensitive to those VOCS (e.g., alkanes). Additional VOCs identified in GCMS analy-ses were not quantified. The GCMS analysis range was from butane to approximately penta-decane. Tar, which were collected on filters, are not included in the emission totals, nor are any VOCs which may not have been transferred through the Teflon sam-ple tubing (although any loss was likely negligible). Several VOC emissions previously 25
reported for pyrolysis and distillation of leaf and wood tissue were not measured or quantified. For example, Yokelson et al. (1996) reported emission factors for the dis-tillation and pyrolysis stages for formaldehyde in laboratory experiments. The mass balance computed in Table 1 gives similar percentage carbon in residue as reported
ACPD
5, 9097–9126, 2005VOC emissions from vegetation pyrolysis J. P. Greenberg et al. Title Page Abstract Introduction Conclusions References Tables Figures J I J I Back Close
Full Screen / Esc
Print Version Interactive Discussion
EGU
for charcoal (Pennise et al., 2001); it is assumed, therefore, that VOC emissions mea-sured comprise the major weight fraction of total emissions.
Integrated emissions for the temperature range 30 to 300◦C are shown in Fig. 6a; Fig. 6b shows emission factors at 300◦C, where many VOCs had their maximum emis-sion rate under experimental conditions.
5
4.3. Comparison of leaf and tissue emissions
Woody tissue is composed primarily of hemicellulose, cellulose and lignin; leaves are composed largely of hemicellulose and cellulose. Hemicellulose decomposes between 200 and 260◦C, followed by cellulose at 240 to 350◦C, and finally by lignin at 280 to 500◦C (Browne, 1958). Consequently, the major emissions (in the temperature range 10
30–300◦C) from woody tissues (Fig. 4) were similar in identity and magnitude to the emissions from leaf tissues for E. saligna and P. ponderosa. However, there are sev-eral exceptions. Methanol and acetic acid emission factors from the pyrolysis of P.
ponderosa and E. saligna woody tissue are similar to those reported previously for
smoldering woody tissue, but were significantly higher than emission factors measured 15
for leaf tissue (Table 3). Furylaldehyde has a much higher emission factor in P.
pon-derosa wood than in needles, but, on the contrary, furylaldehyde emissions from E. saligna wood were much lower than emissions from the leaves. Woody plant tissue
for both species had much lower terpene/pyrazine (m/z 81) emissions than leaves or needles; this may indicate that terpenes make up a smaller percentage of sample 20
woody tissue composition than leaf tissue, since pyrazine is a product of the pyrolysis of cellulose in both leaf and woody tissue.
4.4. Fire induced emissions in forest canopies
Fire propagates when fuel is heated to a temperature where its volatile emissions are of sufficient concentration that they may be ignited by an attached flame, spark, glow-25
ACPD
5, 9097–9126, 2005VOC emissions from vegetation pyrolysis J. P. Greenberg et al. Title Page Abstract Introduction Conclusions References Tables Figures J I J I Back Close
Full Screen / Esc
Print Version Interactive Discussion
EGU
forests has been estimated at approximately 750 gm−2, with most of the foliage at some level near the middle of the canopy (Guenther et al., 1995). For a well-mixed volume of the mid-canopy (1 m3) containing 250 g of foliage (upper limit to what may be expected) heated at 300◦C for 1 min, emission concentrations of <0.02% (volume emissions/volume of air) would result, much lower than the lower flammability limits of 5
individual VOCs (Table 4). Advection in the pre-flaming forest on the order of 10 ms−1 (Taylor et al., 2004) would significantly reduce the time for heating and decrease con-centrations, even if advected air is from adjacent volumes also heated to 300◦C. How-ever, concentrations of emissions near leaves may be considerably higher than the average for a well-mixed volume of the canopy. Assuming a specific leaf mass of 10
233 gm−2 for P ponderosa and 75 gm−2 for Q gambelli and E saligna (Geron et al., 1994), a 1 mm leaf boundary layer, low turbulence and 300◦C, concentration approach-ing 2% (v/v) may be reached in 20, 50, and 180 s for P ponderosa, E saligna and
Q gambelli, respectively. The result is consistent with that of Dimitrakopoulos (2000),
who, from TGA measurements of mean volitization rates, concluded that Pinus species 15
should be more combustible than Quercus species.
Emission contributions from reservoirs, such as sap (in branches or trunk), were not included in the flammability estimate. The estimate also does not include contribu-tions from any VOC emissions from woody tissue. The ratio of leaf biomass to twig biomass (diameter <5 mm) has been estimated at 2:1 for Picea (spruce) and 1:1 for 20
Populus (balsam poplar) species (Yarie and Meade, 1988). Twigs and leaves both are expected to heat rapidly in front of fires and the inclusion of emissions from twigs may increase the concentrations of VOCs produced and reduce the time for the generation of flammable mixtures.
4.5. Smoldering combustion 25
Significant emissions of VOCs occur during smoldering combustion, after the flaming stage ends (Yokelson et al., 1997; Bertschi et al., 2003). After flames have been
ex-ACPD
5, 9097–9126, 2005VOC emissions from vegetation pyrolysis J. P. Greenberg et al. Title Page Abstract Introduction Conclusions References Tables Figures J I J I Back Close
Full Screen / Esc
Print Version Interactive Discussion
EGU
tinguished, glowing zones continue to heat adjacent vegetation; the heating produces distillation and pyrolysis emissions.
Emissions from smoldering combustion are usually included with the emissions mea-sured in smoke plumes (Andreae and Merlet, 2001); however, smoldering combustion may continue for several days after the active flaming stage. Smoldering has higher 5
emission factors for oxygenated VOCs than the average factors measured in smoke plumes. Many emission inventories used in regional and global chemistry-transport models do not differentiate among the various stages of combustion and generally use emission factors for smoke plumes (Liousse et al., 2004). Emission factors for oxy-genated VOCs are generally highly uncertain or not reported (Liousse et al., 2004) 10
and, therefore, may not be included as emissions in biomass burning emission inven-tories.
4.6. Emissions from charcoal production
Charcoal fuel production typically proceeds with a large volume of organic material (logs, branches, slash) either loaded into a kiln or simply covered with earth. Heat is 15
applied from some external source and heated air (350–400◦C) is circulated through the organic matter (Lacaux et al., 1994). At these temperatures, distillation and py-rolysis emissions are the largest fraction of VOC emissions from charcoal production (Fig. 5). The carbon content of the residue of the experiments (approximately 70–90% for leaves from woody plants, Table 1) is similar to the carbon content of about 75% for 20
typical charcoal production kilns (Pennise et al, 2001). Pennise et al. (2001) also cal-culated greenhouse gas contributions from charcoal production. Their results indicate that VOCs were equivalent to approximately 10% of the carbon emitted as CO2in the production process. However, the carbon in VOC emissions may be as high as 30% of the carbon emitted as CO2(Table 1), or even higher if VOCs detected but not quan-25
tified or unmeasured are included. Additionally, Yevich and Logan (2003) estimated global contribution of CO2, CO, CH4 from charcoal production; VOC emissions from distillation and pyrolysis are on the order of CO emissions in their estimate (Table 5).
ACPD
5, 9097–9126, 2005VOC emissions from vegetation pyrolysis J. P. Greenberg et al. Title Page Abstract Introduction Conclusions References Tables Figures J I J I Back Close
Full Screen / Esc
Print Version Interactive Discussion
EGU
5. Conclusions
The distillation and pyrolysis of leaf and woody tissue produce mostly the same VOCs with similar emission factors for most VOCs. The VOC emissions from these pro-cesses are mostly oxygenated hydrocarbons. The emissions are similar to those from smoldering combustion, a later stage of the combustion process. Emission factors for 5
biomass burning are most often given for fire plumes, which integrate emissions from all stages of combustion. The emission factors for several oxygenated VOCs reported here are not described explicitly or are very uncertain in current biomass burning in-ventories. Since smoldering combustion may continue for an extended period after the end of flaming combustion, a separate treatment of smoldering combustion emissions 10
is needed to include the effect of these reactive VOCs in regional and global air quality simulations.
Calculations indicate that emissions from the distillation and pyrolysis of leaves mixed within the canopy and caused by heat from nearby fires would not produce suf-ficiently high concentrations to reach the lower limit of flammability. However, emission 15
concentrations may be much higher in the small volume around the vegetation under low turbulent conditions. Ignition may occur from a spark originating in the fire front or from hot charcoal in the pyrolyzed canopy.
Emissions from charcoal production are rich in oxygenated VOCs, many of which participated very actively in atmospheric chemistry, producing ozone, other oxidants 20
and carbon monoxide. The chemistry may not only have regional air quality implica-tions, but may also have global effects on the organic carbon budget and the global warming potential of the emitted VOCs. Distillation and pyrolysis during charcoal pro-duction produce VOC emissions on the order of CO emissions and greenhouse gas contributions as high as 40% of the carbon emitted as CO2.
ACPD
5, 9097–9126, 2005VOC emissions from vegetation pyrolysis J. P. Greenberg et al. Title Page Abstract Introduction Conclusions References Tables Figures J I J I Back Close
Full Screen / Esc
Print Version Interactive Discussion
EGU
References
Apel, E. C., Calvert, J. G., and Fehsenfeld, F. C.: The nonmethane hydrocarbon intercompari-son experiment, J. Geophys. Res., 99(D8), 16 651–16 664, 1994.
Anrdeae, M. O. and Merlet, P.: Emissions of trace gases and aerosols from biomass burning, Global Biogeochem. Cycles, 15(4), 955–966, 2001.
5
Bertschi, I., Yokelson, R. J., Ward, D. E., Babbitt, R. E., Susott, R. A., Goode, J. G., and Hao, W. M.: Trace gas and particle emissions from fires in large diameter and belowground biomass fuels, J. Geophys. Res., 108(13), 8472, doi:10.1029/2002JD002100, 2003.
Browne, F. L.: Theories of the combustion of wood and its control: A literature survey, Forest Products Laboratory, U.S. Department of Agriculture, Report No. 2136, 1–59, 1958.
10
CRC Handbook of Chemistry and Physics, 85th edition, edited by: Lide, D. R., CRC Press, Cleveland, available at:http://hbcpnetbase.com, 2004.
Crutzen, P. J. and Andreae, M. O.: Biomass burning in the tropics: Impact on atmospheric chemistry and biogeochemical cycles, Science, 250, 1669–1678, 1990.
DeBell, L. J., Talbot, R. W., and Dibb, J.: A major regional air pollution event in the northeast 15
United States caused by extensive fires in Quebec, Canada, J. Geophys. Res., 109(D01304), doi:10.01029/2004JD00004840, 2004.
Dimitrakopoulos, A. P.: Thermographic analysis of Mediterranean plant species, J. Anal. and Appl. Pyrolysis, 60, 123–130, 2000.
Fall, R.: Biogenic emissions of volatile organic compounds from higher plants, in: Reactive 20
Hydrocarbons in the Atmosphere, edited by: Hewitt, C. N., Academic Press, London, 41–96, 1999.
Friedli, H. R., Atlas, E., Stroud, V. R., Giovanni, L., Campos, T., and Radke, L. F.: Volatile organic trace gases emitted from North American wildfires, J. Geophys. Res., 15(2), 435– 452, 2001.
25
Geron, C. D., Guenther, A. B., and Pierce, T. E.: An improved model for estimating emissions of volatile organic compounds from forests in the eastern United States, J. Geophys. Res., 99(D6), 12 773–12 791, 1994.
Guenther, A., Hewitt, C. N., Erickson, D., Fall, R., Geron, C., Graedel, T., Harley, P., Klinger, L., Lerdau, M., McKay, W. A., Pierce, T., Scholes, B., Steinbrecher, R., Tallamraju, R., Taylor, J., 30
and Zimmerman, P.: A global model of natural volatile organic carbon emissions, J. Geophys. Res., 100(D5), 8873–8892, doi:10.1029/94JD02950, 1995.
ACPD
5, 9097–9126, 2005VOC emissions from vegetation pyrolysis J. P. Greenberg et al. Title Page Abstract Introduction Conclusions References Tables Figures J I J I Back Close
Full Screen / Esc
Print Version Interactive Discussion
EGU
Greenberg, J. P., Zimmerman, P. R., Heidt, L., Lueb, R., and Pollock, W.: Hydrocarbon and carbon monoxide emissions from biomass burning in Brazil, J. Geophys. Res., 89(D1), 1350– 1354, 1984.
Greenberg, J. P., Guenther, A., Zimmerman, P., Baugh, W., Geron, C., and Davis, K.: Tethered Balloon measurements of biogenic VOCs in the atmospheric boundary layer, Atmos. Env., 5
33, 855–867, 1999.
Greenberg, J. P., Guenther, A. B., Madronich, S., Baugh, W., Ginoux, P., Druilhet, A., Delmas, R., and Delon, C.: Biogenic VOC emissions and chemistry along the EXPRESSO transect in central Africa, J. Geophys. Res., 104(D23), 30 659–30 671, 1999.
Hanson, D., Greenberg, J. P., Henry, B., and Kosciuch, E.: Proton transfer reaction mass 10
spectroscopy at high drift tube pressure, Int. J. Mass Spec., 224, 507–518, 2003.
Honrath, R. E., Owen, R. C., Martin, M. V., Reid, J. S., Lapina, R., Fialho, P., Dzioho, M. P., and Westphal, D. L.: Regional and hemispheric impacts of anthropogenic and biomass burning emissions on summertime CO and O3, J. Geophys. Res., 109(D24310), doi:10.1029/2004JD005147, 2004.
15
Lacaux, J.-P., Brocard, D., Lacaux, C., Delmas, R., Brou, A., Yoboue, V., and Koffi, M.: Tradi-tional charcoal making: an important source of atmospheric pollution in the African tropics, Atmos. Res., 35, 71–76, 1994.
Liousse, C., Andreae, M. O., Artaxo, P., Barbosa, P., Cachier, H., Gregoire, J. M., Hobbs, P., Lavoue, D., Mouillot, F., Penner, J., Scholes, M., and Schultz, M. G.: Deriving global 20
quantitative estimates for spatial and temporal distributions of biomass burning emissions, in: Emissions of Atmospheric Trace Compounds, edited by: Granier, C., Artaxo, P., and Reeves, C. E., Advances in Global Change Research, Kluwer Academic Publishers, Dordrecht, 71– 113, 2004.
Lobert, J. M., Scharffe, D. H., Hao, W. M., Kuhlbusch, T. A., Seuwen, R., Warneck, P., and 25
Crutzen, P. J.: Experimental evaluation of biomass burning emissions: nitrogen and carbon containing compounds, in: Global Biomass Burning: Atmospheric, Climatic and Biospheric Implications, edited by: Levine, J. S., 289–304, MIT Press, Cambridge, Mass., 1991. Pennise, D. M., Smith, K. R., Kithinji, J. P., Rezende, M. E., Raad, T. J., Zhang, J., and Fan,
C.: Emissions of greenhouse gases and other airborne pollutants from charcoal making in 30
Kenya and Brazil, J. Geophys. Res., 106(D20), 24 143–24 155, 2001.
Simoneit, B. R. T., Schauer, J. J., Nolte, C. G., Oros, D. R., Elias, V. O., Fraser, M. P., Rogge, W. F., and Cass, G. R.: Levoglucosan, a tracer for cellulose in biomass burning and atmospheric
ACPD
5, 9097–9126, 2005VOC emissions from vegetation pyrolysis J. P. Greenberg et al. Title Page Abstract Introduction Conclusions References Tables Figures J I J I Back Close
Full Screen / Esc
Print Version Interactive Discussion
EGU
particles, Atmos. Environ., 33, 173–182, 1999.
Spanel, P. and Smith, D.: Selected ion flow tube studies of the reactions of H3O+, NO+, and O+2 with several aromatic and aliphatic hydrocarbons, Int. J. Mass Spectrom. Ion Proc., 181, 1–10, 1998.
Taylor, S. W., Wotton, B. M., Alexander, M. E., and Dalrymple, G. N.: Variation in wind and 5
crown fire behavior in a northern jack-pine-black spruce forest, Can. J. For. Res., 34, 1561– 1576, 2004.
Wotawa, G. and Trainer, M.: The influence of Canadian forest fires on pollution concentrations in the United States, Science, 288, 324–328, 2000.
Warneke, C., De Gouw, J. A., Kuster, W. C., Goldan, P. D., and Fall, R.: Vaildation of 10
atmospheric VOC measurements by proton-transfer-reacton mass spectroscopy using a gas-chromatographic pre-separation method, Environ. Sci. Technol., 37(11), 2494–2501, doi:10.1021/es026266i, 2003.
Yarie, J. and Mead, B. R.: Twig and foliar biomass estimation evaluation for major plant species in the Tanana River Basin of interior Alaska, Research paper #PNW-RP-401, Pacific North-15
west Research Station, U.S. Forest Service, September, 1988.
Yokelson, R. J., Griffith, D. W. T., and Ward, D. E.: Open path Fourier transform infrared studies of large scale laboratory biomass fires, J. Geophys. Res., 101(D15), 21 067–21 080, 1996. Yokelson, R. J., Susott, R., Ward, D. E., Reardon, J., and Griffith, D. W. T.: Emissions from
smoldering combustion of biomass measured by open-path Fourier transform infrared spec-20
ACPD
5, 9097–9126, 2005VOC emissions from vegetation pyrolysis J. P. Greenberg et al. Title Page Abstract Introduction Conclusions References Tables Figures J I J I Back Close
Full Screen / Esc
Print Version Interactive Discussion
EGU Table 1. Mass balance.
% moisture1 % emissions2 % residue2
Q. gambelli, air 51 5 78 N2 3 74 P. ponderosa, air 59 9 94 N2 3 86 E. saligna, air 54 6 72 N2 4 73 S. officinarum, air 83 7 58 N2 4 65 O. sativa, air 77 15 90 N2 7 94 1
(gH2O/g fresh weight)*100% 2
ACPD
5, 9097–9126, 2005VOC emissions from vegetation pyrolysis J. P. Greenberg et al. Title Page Abstract Introduction Conclusions References Tables Figures J I J I Back Close
Full Screen / Esc
Print Version Interactive Discussion
EGU
Table 2. Emission ratios (gC (CO2):gC (CO): gC (VOC)).
Air Nitrogen Q. gambelli 100:10:14 100:10:20 P. ponderosa 100:15:33 100:5:61 E. saligna 100:12:26 100:16:44 S. officinarum 100:14:12 100:14:25 O. sativa 100:16:8 100:13:21 P. ponderosa (wood) 100:16:19 E. saligna (wood) 100:17:7
ACPD
5, 9097–9126, 2005VOC emissions from vegetation pyrolysis J. P. Greenberg et al. Title Page Abstract Introduction Conclusions References Tables Figures J I J I Back Close
Full Screen / Esc
Print Version Interactive Discussion
EGU Table 3. Comparison with previously reported emission factors (gC emissions/kgC fuel).
Pyrolysis phase
Pine needles methanol acetic acid Yokelson et al. (1996)1 0.6 3.6
This work 1.2 2.0
Smoldering phase
methanol acetic acid phenol
Bertschi et al. (2003)2 6 5 5 Yokelson et al. (1997) Banana 4 4 3 Maple 7 14 24 This work3 P. ponderosa 11 11 2 E. saligna 10 8 38 1
may include some emissions from flaming combustion 2
average of several wood smoldering combustion experiments 3
ACPD
5, 9097–9126, 2005VOC emissions from vegetation pyrolysis J. P. Greenberg et al. Title Page Abstract Introduction Conclusions References Tables Figures J I J I Back Close
Full Screen / Esc
Print Version Interactive Discussion
EGU Table 4. Lower limit of flammability1.
VOC (v/v %) Methanol 7 Acetonitrile 3 Acetaldehyde 4 Acetone 3 Acetic acid 4 Furan 2 Methyl acetate 3 Phenol 2 Furylaldehyde 2 1
ACPD
5, 9097–9126, 2005VOC emissions from vegetation pyrolysis J. P. Greenberg et al. Title Page Abstract Introduction Conclusions References Tables Figures J I J I Back Close
Full Screen / Esc
Print Version Interactive Discussion
EGU Table 5. Emissions from charcoal production (Tg pollutant yr−1)1.
Region charcoal production CO2 CO CH4 VOC2
Africa 10 15 2 0.4 2
Asia 9 13 1 0.2 2
Latin America 12 12 11 0.3 2
1
after Yevich and Logan (2003) 2
ACPD
5, 9097–9126, 2005VOC emissions from vegetation pyrolysis J. P. Greenberg et al. Title Page Abstract Introduction Conclusions References Tables Figures J I J I Back Close
Full Screen / Esc
Print Version Interactive Discussion EGU FC: 450 sccm filter FC: 330 sccm LICOR CO2/H2O TECO CO pump FC: 5.6 slm filter PTRMS Check valve sample filter vent
Fig. 1. Experimental setup. Preheated air (or nitrogen) flowed through a cold finger that
con-tained the vegetation sample. The apparatus sat within a temperature programmed oven. The sample flow was measured undiluted by CO2and CO analyzers. Flow was diluted further for PTRMS analysis. Glass fiber filters were placed before analyzers to trap condensable tars.
ACPD
5, 9097–9126, 2005VOC emissions from vegetation pyrolysis J. P. Greenberg et al. Title Page Abstract Introduction Conclusions References Tables Figures J I J I Back Close
Full Screen / Esc
Print Version Interactive Discussion EGU Eucalyptus 0 1 10 100 1000 30 60 90 120 150 180 210 240 270 300 Temperature (oC) µ g C e m is s ion/ g C /mi n
MeOH acetaldehyde acetone
acetic acid furan pyrazine/terpene
butadione furylaldehyde methyl acetate
0.0 0.1 1.0 10.0 30 60 90 120 150 180 210 240 270 300 Temperature (oC) m g C em issi o ns/ gC /m in Eucalyptus 0 1 10 100 1000 30 60 90 120 150 180 210 240 270 300 Temperature (oC) g C e m is s ion/ g C /mi n
MeOH acetaldehyde acetone
acetic acid furan pyrazine/terpene
butadione furylaldehyde methyl acetate
0.0 0.1 1.0 10.0 30 60 90 120 150 180 210 240 270 300 Temperature (oC) m g C em is si o ns/ gC /m in CO2 CO VOC
Fig. 2. Emission factors (µgC/gC) of the most abundant VOCs emissions versus temperature
(top figure) and total VOC, CO2and CO emission (lower figure) for Eucalyptus leaf tissue. 9122
ACPD
5, 9097–9126, 2005VOC emissions from vegetation pyrolysis J. P. Greenberg et al. Title Page Abstract Introduction Conclusions References Tables Figures J I J I Back Close
Full Screen / Esc
Print Version Interactive Discussion EGU 0 1 10 100 1000 30 60 90 120 150 180 210 240 270 300 Temperature (o C) g C e m iss io n /g C /
E saligna Q gambelli P ponderosa S officinarum O sativa butadione 0 0 1 10 100 1 30 60 90 120 150 180 210 240 270 300 Temperature (o C) g C e m iss io n /g C / acetaldehyde 0 1 10 100 1000 30 60 90 120 150 180 210 240 270 300 Temperature (o C) g C e m iss io n /g C / methanol min min min µ µ µ 0 1 10 100 1000 30 60 90 120 150 180 210 240 270 300 Temperature (o C) g C e m iss io n /g C /
E saligna Q gambelli P ponderosa S officinarum O sativa butadione 0 0 1 10 100 1000 30 60 90 120 150 180 210 240 270 300 Temperature (o C) g C e m iss io n /g C / acetaldehyde 0 1 10 100 1000 30 60 90 120 150 180 210 240 270 300 Tem g C e m iss io n /g C / methanol min min min µ µ µ 0 1 10 100 1000 30 60 90 120 150 180 210 240 270 300 Temperature (o C) g C e m iss io n /g C /
E saligna Q gambelli P ponderosa S officinarum O sativa butadione 0 0 1 10 100 1000 30 60 90 120 150 180 210 240 270 300 Temperature (o C) g C e m iss io n /g C / acetaldehyde 0 1 10 100 1000 30 60 90 120 150 180 210 240 270 300 Temperature (o C) g C e m iss io n /g C / methanol m in m in min µ µ µ 0 1 10 100 1000 30 60 90 120 150 180 210 240 270 300 Tempe rature (o C) gC e m is s ion /g C /m in
E saligna Q gambe lli P ponde rosa S officinarum O sativ a butadione 0 0 1 10 100 1000 30 60 90 120 150 180 210 240 270 300 T e mpe rature (o C) g C e m is s io n /g C /min
ace talde hyde 0 1 10 100 1000 30 60 90 120 150 180 210 240 270 300 Tempe rature (o C) gC e m is s io n /g C /m in me thanol
Fig. 3. Comparison of emission factors (top: methanol, middle: acetone; bottom:
2,3-butadione) versus temperature for leaf tissue of Q gambelli, P ponderosa, E saligna, S
ACPD
5, 9097–9126, 2005VOC emissions from vegetation pyrolysis J. P. Greenberg et al. Title Page Abstract Introduction Conclusions References Tables Figures J I J I Back Close
Full Screen / Esc
Print Version Interactive Discussion EGU Eucalyptus wood 0 1 10 100 30 60 90 120 150 180 210 240 270 300 Temperature (oC) µ gC emi ssio n /g C /min
MeOH acetaldehyde acetone
acetic acid furan methyl acetate
pyrazine/terpene butadione furylaldehyde
Fig. 4. Emission factors (µgC/gC) of the most abundant VOCs emissions versus temperature
ACPD
5, 9097–9126, 2005VOC emissions from vegetation pyrolysis J. P. Greenberg et al. Title Page Abstract Introduction Conclusions References Tables Figures J I J I Back Close
Full Screen / Esc
Print Version Interactive Discussion EGU Quercus gambelli 0 0.3 0.6 0.9 1.2 1.5 0 100 200 300 400 500 600 700 Temperature (o C) dM /d T 0 20 40 60 80 100 we ig h t ( % ) Pinus ponderosa 0 0.2 0.4 0.6 0.8 1 0 100 200 300 400 500 600 700 Temperature (o C) dM /d T 0 20 40 60 80 100 % w e ig h t Quercus gambelli 0 0.3 0.6 0.9 1.2 1.5 0 100 200 300 400 500 600 700 Temperature (o C) dM /d T 0 20 40 60 80 100 we ig h t ( % ) Pinus ponderosa 0 0.2 0.4 0.6 0.8 1 0 100 200 300 400 500 600 700 Temperature (o C) dM /d T 0 20 40 60 80 100 % w e ig h t
Fig. 5. Thermo-gravimetric analysis of P. ponderosa needle and Q. gambelli leaf tissue.
Ex-periments were made in air (black line) and nitrogen (red line). Shown are the rate of change of mass with time (solid line, left scale) and percent weight remaining (dotted line, right scale). Distillation emissions occurred before 175◦C, followed by endothermic pyrolysis emissions (up to approximately 350◦C). Additional emissions from exothermic pyrolysis occurred at higher temperatures. Results were similar for both air and nitrogen, except at temperatures greater than 400◦C, where the presence of oxygen produces additional CO2and CO emissions.
ACPD
5, 9097–9126, 2005VOC emissions from vegetation pyrolysis J. P. Greenberg et al. Title Page Abstract Introduction Conclusions References Tables Figures J I J I Back Close
Full Screen / Esc
Print Version Interactive Discussion EGU integrated emissions (g/kg) 0 1000 2000 3000 4000 met hanol ace toni trile ace tald ehyd e acet one acet ic ac id fura n meth yl ace tate pyr azine/ terpe ne buta dion e phe nol furyl aldehyd e ben zald ehyde VOC m gC /k gC
Q gambelli P ponderosa E saligna S officinarum O sativa
Emission Factors (gC/kgC)at 300 o
C 0 50 100 150 200 250 300 met han ol acet oni trile acet aldehy de aceto ne acet ic ac id fura n met hyl acet ate pyr azin e/te rpen e butad ione phen ol fury l alde hyde benz aldeh yde VOC E F ( g C/ k g C/ m in )
Q gambelli P ponderosa E saligna S officinarum O sativa
(a) integrated emissions (g/kg) 0 1000 2000 3000 4000 met hanol ace toni trile ace tald ehyd e acet one acet ic ac id fura n meth yl ace tate pyr azine/ terpe ne buta dion e phe nol furyl aldehyd e ben zald ehyde VOC gC /k gC
Q gambelli P ponderosa E saligna S officinarum O sativa
Emission Factors (gC/kgC)at 300 o
C 0 50 100 150 200 250 300 met han ol acet oni trile acet aldehy de aceto ne acet ic ac id fura n met hyl acet ate pyr azin e/te rpen e butad ione phen ol fury l alde hyde benz aldeh yde VOC E F ( m g C/ k g C/ m in )
Q gambelli P ponderosa E saligna S officinarum O sativa (b)
Fig. 6. (a) integrated emission factors for the most abundant VOC measured in the
distilla-tion/pyrolysis experiments (30–300◦C, mgC VOC emission/kgC dry weight);(b) Emission
fac-tors at 300◦C for the most abundant VOC measured in the distillation/pyrolysis experiments (mgC VOC emission/kgC dry weight/min).