HAL Id: hal-00296882
https://hal.archives-ouvertes.fr/hal-00296882
Submitted on 8 Jun 2005
HAL is a multi-disciplinary open access
archive for the deposit and dissemination of
sci-entific research documents, whether they are
pub-lished or not. The documents may come from
teaching and research institutions in France or
abroad, or from public or private research centers.
L’archive ouverte pluridisciplinaire HAL, est
destinée au dépôt et à la diffusion de documents
scientifiques de niveau recherche, publiés ou non,
émanant des établissements d’enseignement et de
recherche français ou étrangers, des laboratoires
publics ou privés.
Reconstruction of reflectivity vertical profiles and data
quality control for C-band radar rainfall estimation
A. Fornasiero, P. P. Alberoni, G. Vulpiani, F. S. Marzano
To cite this version:
A. Fornasiero, P. P. Alberoni, G. Vulpiani, F. S. Marzano. Reconstruction of reflectivity vertical
profiles and data quality control for C-band radar rainfall estimation. Advances in Geosciences,
European Geosciences Union, 2005, 2, pp.209-215. �hal-00296882�
Advances in Geosciences, 2, 209–215, 2005 SRef-ID: 1680-7359/adgeo/2005-2-209 European Geosciences Union
© 2005 Author(s). This work is licensed under a Creative Commons License.
Advances in
Geosciences
Reconstruction of reflectivity vertical profiles and data quality
control for C-band radar rainfall estimation
A. Fornasiero1,3, P. P. Alberoni1, G. Vulpiani2, and F. S. Marzano2
1ARPA Emilia-Romagna – Servizio Idrometeorologico, Bologna, Italy 2CETEMPS, Center of Excellence, University of L’Aquila, L’Aquila, Italy 3CIMA, Universit`a di Genova e della Basilicata, Savona, Italy
Received: 10 December 2004 – Revised: 11 May 2005 – Accepted: 16 May 2005 – Published: 8 June 2005
Abstract. Microwave Doppler radars are considered a fairly
established technique to retrieve rain rate fields from mea-sured reflectivity volumes. However, in a complex oro-graphic environment radar observations are affected by sev-eral impairments which should be carefully evaluated. To-gether with the enhancement of ground-clutter effects, the major limitation is represented by partial or total beam block-ing caused by natural obstructions which very often impose to scan at high-elevation angles. These range-related limita-tions tend to reduce the potential role of operational weather radars in monitoring precipitation amount at ground within mountainous areas since, if either the nature or intensity of rainfall varies with height (e.g., melting effects during strat-iform rain), radar returns at higher altitudes may be not rep-resentative of surface rain rate. Therefore, before to use the radar data, it is necessary to reduce, as much as possible, this evaluation errors and to estimate the reliability of the pro-cessed data. Near to the quality control, are needed qual-ity indexes, taking into account each correction and elab-oration step, that could be useful to retrieve a final quality value. In this work, we analyse the main factors that could be affect the efficiency of a reconstruction methodology of near-surface reflectivity fields from high-elevation reflectiv-ity bins, in presence of complex orography. A climatologic schema is applied to infer near-surface reflectivity at a given range interval. The technique is developed in polar coordi-nates partially taking into account the antenna beam width degradation at longer ranges and overall computational effi-ciency for operational purposes. Thereafter, it is applied on a rainfall event observed by a C-band Doppler radar operating in S. Pietro Capofiume (Bologna, Italy) and the relation be-tween the reconstruction error and possible quality indicators is analysed and discussed.
Correspondence to: A. Fornasiero
1 Introduction
Rain rate fields represent a useful information not only for hydro-geological applications, but also for microwave com-munication planning and for assimilation purposes within numerical weather forecast models (as pointed out, among others, by Borga et al., 2000; Bauer et al., 2002; Marzano et al., 2004a). In presence of a complex orography, charac-terized by hilly and mountainous scenarios, this task is fairly involved especially if needed at a ground resolution less than few kilometers square. Rain gauge networks denote many limitations related to their sparse and spot-like data distribu-tion (Ciach and Krajewski, 1999; Fornasiero et al., 2004). Nevertheless, they represent “standard” means for remote-sensor calibration and validation.
Radar observations are affected by several physical effects which should be carefully evaluated, especially in a complex orographic environment (Kitchen and Blackhall, 1992; Joss and Lee, 1995; Andrieu and Creutin, 1995; Marzano et al., 2004b; Fornasiero et al., 2004). Together with the enhance-ment of ground-clutter effects, the major limitation is rep-resented by partial or total beam blocking caused by natu-ral obstacles which very often impose scanning higher eleva-tion angles larger than 1.5◦. These range-related limitations tend to reduce the potential role of operational weather radars in monitoring precipitation amount at ground within moun-tainous areas since, if either the nature or intensity of rain-fall varies with height (e.g., melting effects during stratiform rain), radar returns at higher altitudes may be not directly representative of surface rain rate (Germann and Joss, 2002; Marzano et al., 2004).
A conventional approach to the reconstruction of surface rain rate fields is to estimate the vertical profile of reflec-tivity factor (VPR) by using proper spatial and time aver-ages of radar volume data (Koistinen, 1991). This approach, which might be classified as “static”, is strongly affected by the variability of rain at medium and small scales. Various regimes can be present over large areas, mainly stratiform, convective and orographically enhanced. Stratiform rain is
210 A. Fornasiero et al.: Reflectivity vertical profiles and data quality control
recognizable by a decreasing reflectivity profile and by the presence of a bright band, just below the freezing level and with a thickness dependent on the thermal lapse rate and fall velocity. On the contrary, convective rain is featured by a VPR mainly constant with altitude due to the mixing of ice and water hydrometeors sustained by strong updrafts and downdrafts. Finally, orographic rain may present largely variable reflectivity at low levels due to windflow over moun-tain slopes. As opposed to a “static” approach to rain field re-construction, a “dynamic” (or adaptive) technique should be able to exploit “real-time” or “quasi real-time” measured re-flectivity data available at unobstructed heights to estimate the unknown radar reflectivities at lower levels, including that near the surface.
This ability to retrieve VPR at small scales can be ad-dressed by resorting to either a classification or to an esti-mation method. In the first case, the main goal is to identify a typical VPR given an upper-level set of reflectivity data (Gray et al., 2002; Koistinen and Pohjola, 2002; Franco et al., 2002). The considered VPR classes can be simply strati-form and convective or, using a more sophisticated approach, can be categorized according to the fine variability of the re-flectivity measurements. On the other hand, in order not to be limited by the definition of a “typical” profile, the training data set, possibly classified, can be used to set up inversion algorithms able to use, in a statistical way, the information of measured reflectivity every scan (Marzano et al., 2002). A major limitation of both the approaches is related to the choice and statistically significance of the training data set. A real-time operational aim may strongly orient the decision on the solution strategy for VPR reconstruction. All process-ing steps must employ computprocess-ing resources for a time much less than that taken for a complete radar volume scan. This means that the processing of the volumetric data must be fast enough and avoid any large data backlog.
In order to accomplish this task, two ways may be envis-aged. The first approach, here referred to as “on line”, is to estimate a space-time average VPR from near-real time volume data within fairly limited areas and amount of time (e.g., from 5 up 140 km and from 15 min to few hours) (Ger-mann and Joss, 2002). The simplicity of the “on-line” VPR reconstruction would ensure a high-speed profile correction procedure. The second approach, referred to as “off-line”, is to resort to a training of the VPR retrieval algorithm by using historical radar volume data sets, possibly classified in time and space (Franco et al., 2002; Marzano et al., 2004). After the training step is accomplished by using inversion techniques, the application of the VPR “off-line” reconstruc-tion algorithm would become straightforward and fast. Both approaches have strengths and drawbacks: i) the “on-line” approach does not involve any historical data set even though a data pre-analysis should be necessary, but it has basically to resort to the use of simple estimation techniques; ii) the “off-line” approach can deal with more accurate inversion meth-ods, but requires a training period of activity. The choice between the two strongly depends on the goals. To a certain extent, a synergistic approach might be the optimal solution.
As, previousy pointed out by Kitchen and Jackson (1993) and Kitchen (1997), the accuracy of reconstructing a near-surface rain field is intrinsically connected to its range depen-dence. If we consider, for example, an antenna beamwidth of 1◦, the transverse dimension of the resolution volume ranges from 0.3 km at 20 km to 2 km at 120 km. It is obvious that non-uniform beam filling and smoothing effects can become significant as more as far from the radar site. A way to reduce this intrinsic limit is to perform an “identification” of VPR, i.e. deconvolve the radar observation by knowing the radar antenna pattern in order to retrieve the non-smoothed VPR (Andrieu and Creutin, 1995). It is worth mentioning that the identification of VPR is a different procedure from the recon-struction of VPR since in the latter case, after performing or not a VPR identification (possibly accomplishing it beyond a range of 60 km).
The overall objective of our efforts is to propose a com-bined processing technique to check for anomalous prop-agation and beam blockage coupled with a reconstruction methodology of near-surface reflectivity fields from high-elevation reflectivity bins in presence of complex orography. In particular in this work we focus our attention to identify the factors that condition the quality of the VPR. Climatolog-ical and adaptive schemes are applied to infer near-surface reflectivity at a given range interval. The techniques are de-veloped in polar coordinates taking into account the antenna broadening at longer ranges and the overall computational efficiency for operational purposes. A case study, related to rainfall events observed by a C-band Doppler radar, is illus-trated and preliminary results discussed.
2 Radar data and case study
Data were provided by C-band operational Doppler of S. Pietro Capofiume (Bologna, Italy), placed along the Reno river valley in northern Italy. This dual-polarization radar is placed on a tower with a Cassegrain parabolic antenna (without radome cover), providing a half-power beam-width of 0.9◦and a directivity of about 45-dB. The klystron peak-power is 250 kW at 5.6 GHz with an alternating horizontal-vertical polarization transmission and dual pulse repetition frequency (PRF) system for unfolding capability. Pulse widths of 0.5 µs (i.e., short pulse with a resampled bin reso-lution of 250 m) and 1.5 µs (i.e., long pulse with a resampled bin resolution of 1000 m). The receiver sensitivity is equal to −113 dBm. The typically used maximum range is 250 km (with long pulse) and 125 km (with short pulse) for the inten-sity and velocity mode, respectively. A self-contained soft-ware is used to remotely operate and archive radar data.
Radar data are acquired with a prescribed scanning strat-egy during operational activity, consisting of 15 elevations with an angular spacing of 1◦. Procedures to correct for gas absorption and to remove ground-clutter echoes using a Doppler filter are routinely applied. Side-lobe effects at very short ranges (less than 20 km) for low elevations are avoided by choosing higher elevations not affected by this effect.
A. Fornasiero et al.: Reflectivity vertical profiles and data quality control 211
Figure 1.
10/12/2003 16:07UTC. RHI (Range Height Indicator) of Reflectivity factor (dBZ) at
different azimuths.
Figure 2.
Spatial-Time mean VPR at 25 km distance from radar, obtained using rings width of 5
km (above) and of 1 km (below). The VPR is calculating using the whole dataset event, composed
of 51 polar volumes.
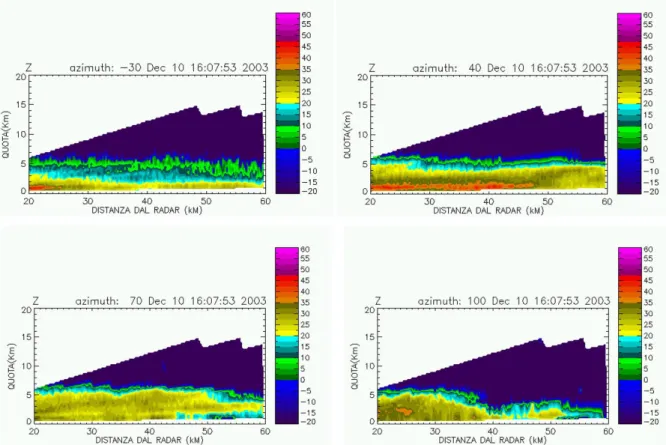
Fig. 1. 10/12/2003, 16:07 UTC. RHI (Range Height Indicator) of Reflectivity factor (dBZ) at different azimuths.
The case study is related to an event, occurred from 10 December 2003 to 11 December 2003 in the North of Italy. In the time range between 3 p.m. of 10th and 4 a.m. of 11th it has been collected 51 polar volumes, every 15 min and using the 15-elevations scan strategy ranging from 0.5◦to 15◦.
The case analysed was mainly characterised by a strati-form structure as shown (Fig. 1) in the vertical cut of the re-flectivity factor (hereinafter refer as rere-flectivity Z), neverthe-less some “mixed” areas not clearly classifiable are present in the event considered. Indeed while at −30◦and 40◦azimuth degrees the cloud structure highlight a stratiform behaviour, where it is quite evident the presence of a strong bright band echo at 40◦, at 70◦and 100◦the pattern is quite different and the VPR shape is not totally conserved (the bright band is not so evident).
This can introduce a worsening in the quality of the mean VPR reconstruction, in particular in absence of a preliminary pixel to pixel rain classification.
3 Retrieval of the vertical profile of reflectivity
As already mentioned, the easiest way to reconstruct the VPR is to calculate its mean shape and, assuming it to be uniform in the whole radar domain, to retrieve the reflectivity at the desired level by the simple adding of a constant quantity (in dBZ units), as is further discussed in the following.
The assumption of a uniform-shape of VPR can be made more strength if we distinguish the different types of precip-itation and retrieve distinct VPRs for each type. In this work the uniformity hypothesis has been restricted, in range, at rings of 5 km width, initially, and thereafter of 1 km of width, but without classification of the pattern type. As stated be-fore, the main goal of the study is, in fact, to identify the fac-tors that condition the quality of the VPR, even if the tested method is not yet the optimum. The choice to retrieve an av-erage VPR for each constant-width ring also reflect the effect of the radar beam broadening that implies an increase of the radar cells volume with the distance. To calculate the VPR, it has been chosen the 3-D azimuth sector, relatively free of obstacles and covering the Po valley, between −90◦and 135◦ and into the distance range [20, 60] km from the radar. Inside each circular sector, as define above, the individual points for each considered elevations is given by 1R/dR, where 1R is the sector width and dR the minimum resolution (i.e. 250 m for the considered case). The total number of points of each “mean” profile is equal to n ∗ 15 where 15 are the elevations in the operational mode.
We have observed that, in spite of the averaging in time (over the whole event) and azimuth direction done, a cer-tain amount of range variability is still present. In Fig. 2 it is represented the “time-azimuth averaged” profile at 25 km distance obtained using the 5-km rings and the 1-km rings and assuming for Z a minimum threshold of 0 dBZ. It is well
212 A. Fornasiero et al.: Reflectivity vertical profiles and data quality control
Figure 1.
10/12/2003 16:07UTC. RHI (Range Height Indicator) of Reflectivity factor (dBZ) at
different azimuths.
Figure 2.
Spatial-Time mean VPR at 25 km distance from radar, obtained using rings width of 5
km (above) and of 1 km (below). The VPR is calculating using the whole dataset event, composed
of 51 polar volumes.
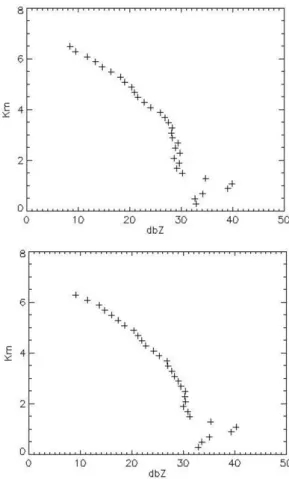
Fig. 2. Spatial-Time mean VPR at 25 km distance from radar, ob-tained using rings width of 5 km (above) and of 1 km (below). The VPR is calculating using the whole dataset event, composed of 51 polar volumes.
evident, in this figure, which up to 3 km above the ground a quite high variability is present within each elevation. Causes for this are probably due to the portion of the radar beam, out-side the 3 dB width, that intercepts the bright band and to the inhomogeneous beam filling. Of course this problem is much more evident in the profile at the 5-km horizontal resolution that at 1-km. In order to overcome this problem a vertical in-terpolation at 0.2 km steps has been carried out (see Fig. 3). Observing the reconstructed VPR, in order to reduce the os-cillations still visible above the bright band, the best choice appears to be the use of the 1 km width for the rings.
4 VPR correction and quality control issues
Once the mean shape of the VPR in each circular sector has been identified the reflectivity value at the desired height can be obtained by adding a constant to the data at lowest avail-able elevation. As uniform mean shape, we intend that the value of Z at each height h, normalized with respect to the value at a generic height href, is constant. This assumption can be done for each pair of heights. Thus, if we know the mean VPR and we aim to retrieve the Z value at the height
Figure 3.
As Fig. 2, but after a vertical interpolation every 0.2 km.
Figure 4.
10/12/2003 16:00 UTC. Reflectivity map without (on the left) and with VPR
reconstruction (on the right). The boundary of the selected area used to retrieve the mean VPR is
indicated in black on the left panel.
Fig. 3. As Fig. 2, but after a vertical interpolation every 0.2 km.
h1from the value at height h2, we have (following, among
others, Koistinen, 1991; and Koistinen and Pohjola, 2002):
ci,1,2= ^ Zi(h1) ^ Zi(h2) (1)
where ˇZ is the mean value of Z available from the VPR and
ci,1,2is the related constant, note that the “i” index refers to
the i-th circular sector. The previous equation expressed in dBZ unit (i.e. in logarithmic scale) is used for estimate the unknown value of the reflectivity factor; it becomes:
ˆ
ZidBZ(h1) = ci,1,2dB+ZidbZ(h2) (2)
where ZidBZis the observed value at the lower and ˆZidBZis
the estimated one.
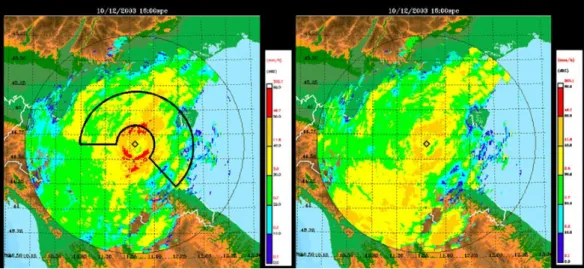
As an example of the correction the reflectivity maps in a single instant, with and without VPR correction, are shown in Fig. 4. The main problem seems to be the extension of the VPR outside the selected bounds. In particular, near the radar and outside the selected sector data are partially affected by the bright band, this leads to an underestimation of the abso-lute correction in this area that is visible on the right panel. The position of the freezing level respect to the selected area, and its variability into the map, could be considered as an-other index of the VPR correction quality.
A. Fornasiero et al.: Reflectivity vertical profiles and data quality control 213
Figure 3.
As Fig. 2, but after a vertical interpolation every 0.2 km.
Figure 4.
10/12/2003 16:00 UTC. Reflectivity map without (on the left) and with VPR
reconstruction (on the right). The boundary of the selected area used to retrieve the mean VPR is
indicated in black on the left panel.
Fig. 4. 10/12/2003, 16:00 UTC. Reflectivity map without (on the left) and with VPR reconstruction (on the right). The boundary of the selected area used to retrieve the mean VPR is indicated in black on the left panel.
The rain type variability, the antenna pattern, the inhomo-geneous beam filling, among others factors, can compromise the uniform shape assumption, so that a quality control of the VPR reconstruction and of its representativeness is nec-essary. Indeed, if we compare the mean VPRs at different distances from radar and a single time instantaneous VPRs (see Fig. 5), we can appreciate the VPR variability in range and time due not only to geometric reasons (i.e. the beam broadening), but also to meteorological causes. It is quite ev-ident for example that at 3 km height the “mean” VPRs are within, roughly, 5 dBZ interval while the instantaneous one are within 15–20 dBZ interval. The reader should note that this is a key factor in the evaluation of the representativity of
Zreconstruction.
In order to assess the quality of the estimated data, we have calculated, for each range bins in the whole free sector where the mean VPRs are estimated, the Z values at the lower el-evation (Z0), supposed that they are missing due to possible
obstacles. Thus the error between the retrieved values and the “true” observed values of Z0has been computed,
accord-ingly to the definition as follows:
εi = ˆZi,dBZ(h1) − Zi,dbZ(h1) = ˆZi,0−Zi,0 (3)
Again, as a representative example, the azimuthal-average value of the error εi has been calculated vs. distance, for a single instant and displayed in Fig. 6. These errors are com-pared with the mean errors obtained used, as proxy for the value Z0, the second elevation data as an estimate, as could
be usually done in an operational context. In this figure it is shown how the 1-km rings width permits to reduce the bias, within a [−2, 2] dB interval, with respect to the 5-km width choice. Notice that the error due to VPR correction is considerably lower than that one obtained by the use of the “supposed first” available elevation, a [−4, 5] dB interval.
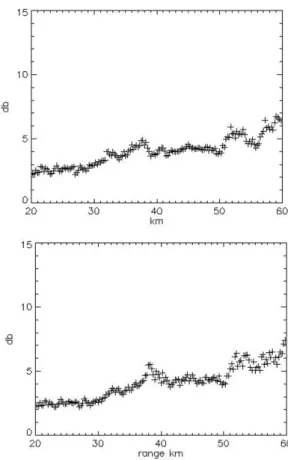
In the same way, it has been evaluated the instantaneous root mean square error (rmse) versus distance (see Fig. 7),
Figure 5.
VPR estimated at 1 km annular rings ranging from 20 to 60 km from the radar every 5 km
steps. Upper panel: Mean VPRs over the whole event. Lower panel:: Instantaneous VPRs at
10/12/2004 15:00 UTC.
Fig. 5. VPR estimated at 1 km annular rings ranging from 20 to 60 km from the radar every 5 km steps. Upper panel: Mean VPRs over the whole event. Lower panel: Instantaneous VPRs at 10/12/2004, 15:00 UTC.
compared with the standard deviation the “Z1−Z0” quantity.
The reason is that this quantity could be estimated in real-time to give a quality indicator on the VPR reconstruction.
214 A. Fornasiero et al.: Reflectivity vertical profiles and data quality control
Figure 6.
Azimuthal mean differences (dB) between estimated Z and observed one using different
methodologies for the 10/12/2003 16:00 UTC data. Upper panel: Z
1-Z
0.Middle panel:
Z
ˆ
i,0−
Z
i,0iusing 1km rings width. Lower panel:
i
i
i
Z
Z
ˆ
,0−
,0using 5km rings width.
Fig. 6. Azimuthal mean differences (dB) between estimated Zand observed one using different methodologies for the 10/12/2003, 16:00 UTC data. Upper panel: Z1−Z0. Middle panel: ˆZi,0−Zi,0
using 1 km rings width. Lower panel: ˆZi,0−Zi,0using 5 km rings
width.
The trend of these plots is quite similar, so we are con-fident that the standard deviation of (Z1−Z0) is a possible
indicator of the quality of the VPR correction.
5 Conclusions
A preliminary work on the analysis of VPR reconstruction has been carried out. When this, as well as other correction techniques, is applied to the volumetric radar data in order to
Figure 7.
10/12/2003 16:00 UTC. Upper panel: root mean square error of the reconstructed data at
Z
0using 1 km ring width. Lower panel: standard deviation of the Z
1-Z
0quantity, vs. distance from
radar.
Fig. 7. 10/12/2003, 16:00 UTC. Upper panel: root mean square error of the reconstructed data at Z0using 1 km ring width. Lower
panel: standard deviation of the Z1−Z0quantity, vs. distance from
radar.
estimate the surface rainfall amount, it is important to give also, if it is possible, an estimate, disregarding that could be a very rough one, of the uncertainty, or if you want of the quality, of the products. Within in this context, the present work, aims to address the down to ground extrapolation.
In this regards the results show the following:
– A very import variability, both spatial and temporal, is
present in the instantaneous VPR;
– A careful choice as to be taken in the definition of range
resolution for the definition of “mean” VPR;
– The VPR technique is able to reconstruct data with an
mean error slightly higher than the nominal 1 dBZ error present in the original data;
– The real-time standard deviation, which could be
esti-mated from the lowest elevations, is a promising quan-tity to assess the quality of the reconstruction technique. A more deep analysis, over a number of different meteoro-logical situations, will be carried out in future. Following the results obtained, with this preliminary work, we are confident that a quality index, based on range resolution and estimated vertical variation, could be established for the VPR method-ology and used in a more broad environment.
A. Fornasiero et al.: Reflectivity vertical profiles and data quality control 215
Acknowledgements. This work is partially supported by CARPE
DIEM, a research project supported by the European Commission under the 5th FP (Contract No. EVG1-CT-2001-0045), from the GNDCI through the project RAM (U.O.3.63, CNR contract number 03.00075.GN42) and by INTERREG IIIB CADSES “RISK AWARE” (3B064).
Edited by: L. Ferraris
Reviewed by: anonymous referees
References
Andrieu, H. and Creutin, J. D.: Identification of vertical profiles of radar reflectivity for hydrological applications using an in-verse method, Part I: Formulation, J. Appl. Meteor., 34, 225–239, 1995.
Bauer, P., Mahfouf, J. F., Olson, W. S., Marzano, F. S., Di Michele, S., Tassa, A., and Mugnai, A.: Error analysis of TMI rainfall estimates over ocean for variational data assimilation, Quart. J. Roy. Meteor., 128, 2129–2144, 2002.
Borga, M., Anagnostou, E. N., and Frank, E.: On the use of real-time radar rainfall estimates for flood prediction in mountainous basins, J. Geophys. Res., 105, D2, 2269–2280, 2000.
Ciach, G. J. and Krajewski, W. F.: Radar-rain gauge comparisons under observational uncertainties, J. Appl. Meteor., 38, 1519– 1525, 1999.
Fornasiero, A., Amorati, R., Alberoni, P. P., Ferraris, L., and Tara-masso, A. C.: Impact of combined beam blocking and anoma-lous propagation correction algorithms on radar data quality, 3rd European Radar Conference, Visby, pp. 216–222, 2004. Franco, M., Sempere-Torres, D., Sanchez-Diezma, R., and Andrieu,
H.: A methodology to identify the vertical profile of reflectivity from radar scans and to estimate the rain rate at ground at differ-ent distances, 2nd European Radar Conference, Delft, pp. 299– 304, 2002.
German, U. and Joss, J.: Mesobeta profiles to extrapolate radar pre-cipitation measurements above the Alps to ground level, J. Appl. Meteor., 41, 542–557, 2002.
Gray, W. R., Uddstrom, M. J., and Larsen, H. R.: Radar surface rainfall estimates using a typical shape function approach to cor-rect for the variations in the vertical profile of reflectivity, Int. J. Rem. Sens., 23, 2489–2504, 2002.
Joss, J. and Lee, R.: The application of radar-gauge comparisons to operational precipitation profile corrections, J. Appl. Meteor., 34, 2612–2630, 1995.
Kitchen, M.: Towards improved radar estimates of surface precipi-tation rate at long range, Quart. J. Roy. Meteor. Soc., 123, 145– 163, 1997.
Kitchen, M. and Blackhall, R. M.: Orographic rainfall over low hills and associated corrections to radar measurements, J. Hydrology, 139, 115–139, 1992.
Kitchen, M. and Jackson, P. M.: Weather radar performance at long range – Simulated and observed, J. Appl. Meteor., 32, 975–985, 1993.
Koistinen, J.: Operational correction of radar rainfall errors due to the vertical reflectivity profile, Proc. 25th Radar Meteorology Conf., Paris (F), pp. 91–94, 1991.
Koistinen, J. and Pohjola, H.: Operational vertical reflectivity pro-file correction in radar network composites in Finland, Second European Radar Conference, Delft (NL), 18–23 Nov., 2002 (ab-stract).
Marzano, F. S., Vulpiani, G., and Picciotti, E.: Reconstruction of rain rate fields in complex orography from C-band radar volume data, 2nd European Radar Conference, Delft (NL), 18–23 Nov. 2002, pp. 227–232, 2002.
Marzano, F. S., Picciotti, E., and Vulpiani, G.: Rain field and re-flectivity vertical profile reconstruction from C-band radar volu-metric data, IEEE Trans. Geosci. Rem. Sens., 42, 4, 1033–1046, 2004a.
Marzano, F. S., Palmacci, M., Giuliani, G., Cimini, D., and Turk, J.: Multivariate Statistical Integration of Satellite Infrared and Microwave Radiometric Measurements for Rainfall Retrieval at the Geostationary Scale, IEEE Trans. Geosci. Rem. Sens., 42, 4, 1018–1032, 2004b.