HAL Id: hal-00303188
https://hal.archives-ouvertes.fr/hal-00303188
Submitted on 23 Nov 2007HAL is a multi-disciplinary open access
archive for the deposit and dissemination of sci-entific research documents, whether they are pub-lished or not. The documents may come from teaching and research institutions in France or abroad, or from public or private research centers.
L’archive ouverte pluridisciplinaire HAL, est destinée au dépôt et à la diffusion de documents scientifiques de niveau recherche, publiés ou non, émanant des établissements d’enseignement et de recherche français ou étrangers, des laboratoires publics ou privés.
Dependence of cloud fraction and cloud top height on
surface temperature derived from spectrally resolved
UV/vis satellite observations
T. Wagner, S. Beirle, T. Deutschmann, M. Grzegorski, U. Platt
To cite this version:
T. Wagner, S. Beirle, T. Deutschmann, M. Grzegorski, U. Platt. Dependence of cloud fraction and cloud top height on surface temperature derived from spectrally resolved UV/vis satellite observations. Atmospheric Chemistry and Physics Discussions, European Geosciences Union, 2007, 7 (6), pp.17117-17146. �hal-00303188�
ACPD
7, 17117–17146, 2007Dependence of cloud fraction and cloud
height on temperature T. Wagner et al. Title Page Abstract Introduction Conclusions References Tables Figures ◭ ◮ ◭ ◮ Back Close
Full Screen / Esc
Printer-friendly Version Interactive Discussion Atmos. Chem. Phys. Discuss., 7, 17117–17146, 2007
www.atmos-chem-phys-discuss.net/7/17117/2007/ © Author(s) 2007. This work is licensed
under a Creative Commons License.
Atmospheric Chemistry and Physics Discussions
Dependence of cloud fraction and cloud
top height on surface temperature derived
from spectrally resolved UV/vis satellite
observations
T. Wagner1,2, S. Beirle1, T. Deutschmann2,1, M. Grzegorski2,1, and U. Platt2
1
MPI for Chemistry, Mainz, Germany
2
Institut f ¨ur Umweltphysik, University of Heidelberg, Heidelberg, Germany Received: 13 November 2007 – Accepted: 16 November 2007
– Published: 23 November 2007
Correspondence to: T. Wagner (thomas.wagner@mpch-mainz.mpg.de)
ACPD
7, 17117–17146, 2007Dependence of cloud fraction and cloud
height on temperature T. Wagner et al. Title Page Abstract Introduction Conclusions References Tables Figures ◭ ◮ ◭ ◮ Back Close
Full Screen / Esc
Printer-friendly Version Interactive Discussion
Abstract
Cloud climate feedback constitutes the most important uncertainty in climate modelling, and currently even its sign is still unknown. In the recently published report of the in-tergovernmental panel on climate change (IPCC), from 20 climate models 6 showed a positive and 14 a negative cloud radiative feedback in a doubled CO2 scenario. The
5
radiative budget of clouds has also been investigated by experimental methods, espe-cially by studying the relation of satellite observed broad band shortwave and longwave radiation to sea surface temperature. Here we present a new method for the investi-gation of the dependence of cloud properties on temperature changes, derived from spectrally resolved UV/vis satellite observations. Our study differs from previous
in-10
vestigations in three important ways: first, we directly extract cloud properties (amount and altitude) and relate them to surface temperature. Second, we retrieve the cloud altitude from the atmospheric O2 absorption instead from thermal IR radiation. Third,
our correlation analysis is performed using 7.5 years of global monthly anomalies (with respect to the average of the same month for all years). For most parts of the globe
15
(except the tropics) we find a negative correlation of cloud fraction versus surface-near temperature. In contrast, for the cloud top height a positive correlation is found for al-most the whole globe. Both findings might serve as an indicator for an overall positive cloud climate feedback. Another peculiarity of our study is that the cloud-temperature relationships are determined for fixed locations (instead to spatial variations over
se-20
lected areas) and are based on the “natural” variability over several years (instead the anomaly for a strong El-Nino event). Thus our results might be especially representa-tive for the extrapolation to long term climate changes. Climate models should aim to reproduce our findings: if substantial differences are found, this might indicate that im-portant details are not yet well captured by these models. If good agreement is found,
25
from the models reliable information on the magnitude and the detail mechanisms of cloud climate feedback could be gained.
ACPD
7, 17117–17146, 2007Dependence of cloud fraction and cloud
height on temperature T. Wagner et al. Title Page Abstract Introduction Conclusions References Tables Figures ◭ ◮ ◭ ◮ Back Close
Full Screen / Esc
Printer-friendly Version Interactive Discussion
1 Introduction
Clouds have a strong impact on both, the short-wave solar radiation and on the outgo-ing thermal radiation (e.g. Ramanathan and Inamdar, 2006). If cloud cover increases, less solar radiation reaches the ground, but also more thermal radiation from the sur-face will be trapped in the atmosphere. Both effects influence the sursur-face-near
temper-5
ature (ST) with opposite signs, and their net effect depends on various cloud proper-ties, especially on the cloud altitude (Stephens, 2005; Cess et al., 1992; Hartmann et al., 2001; Fu et al., 2002; Cess and Udelhofen, 2003; Webb et al., 2006; Kubar et al., 2007). Today, the magnitude, and even the sign of cloud feedback is still not known (see e.g. the IPCC 4th assessment report (Solomom et al., 2007) and references therein).
10
Besides modelling studies (Cess et al., 1990; Soden and Held, 2006; Webb et al., 2006; Cess et al., 1996; Larson and Hartmann, 2003; Bony and Dufresne, 2005; Williams et al., 2006), climate feedbacks have been investigated also from experi-mental data and their combination with model results. Most studies investigated the relation of broad band short wave and long wave radiation and cloud properties to
15
spatial variations of the surface temperature (Ramanathan et al., 1989; Harrison et al., 1990; Stephens and Greenwald, 1991). Other studies investigated seasonal vari-ations, anomalies during strong El-Nino events or temporal trends (Cess et al., 1992, 2003; Bony et al., 1997a, b; Tian and Ramanathan, 2002). Most of these studies were restricted to specific areas, e.g. the continents or the tropics.
20
In this study we investigate the cloud response for fixed locations on a global scale using correlation analyses of monthly anomalies of cloud fraction and cloud top height (derived from the atmospheric O2absorption) with those of ST. The cloud fraction and
cloud top height information is derived from 7.5 years of observations of the Global Ozone Monitoring Experiment (GOME) on board the European research satellite
ERS-25
2. We relate the GOME results to ST observations for the same period (ST data are obtained from the Goddard Institute for Space Studies (Hansen et al., 2001; Reynolds et al., 2002) (GISS, seehttp://www.giss.nasa.gov/data/update/gistemp/).
ACPD
7, 17117–17146, 2007Dependence of cloud fraction and cloud
height on temperature T. Wagner et al. Title Page Abstract Introduction Conclusions References Tables Figures ◭ ◮ ◭ ◮ Back Close
Full Screen / Esc
Printer-friendly Version Interactive Discussion
2 The GOME Instrument
The GOME instrument aboard the European research satellite ERS-2 measures sun-light reflected from the Earth’s atmosphere and surface covering the wavelength range between 240 and 790 nm with moderate spectral resolution (Burrows et al., 1999) (0.2–0.4 nm FWHM). The satellite operates in a nearly polar, sun-synchronous orbit
5
at 780 km altitude with an equator crossing time of approximately 10:30 a.m. local time. This has to be taken into consideration for the interpretation of our results, which might be only representative for mid-morning because of the diurnal variation of clouds (Bergman and Salby, 1996). The ground pixels cover an area of 320 km east to west by 40 km north to south. Simultaneous to the spectral channels, also broad band
intensi-10
ties are measured by the so called polarization monitoring devices (PMD). Compared to the spectral channels, they have a much finer spatial resolution of 20×40 km2. The Earth’s surface is entirely covered within 3 days, and poleward from about 70◦ latitude
within 1 day.
3 Cloud products derived from GOME
15
3.1 Cloud fraction
An effective cloud fraction (CF) is derived using the Heidelberg Iterative Cloud Retrieval Utilities (Grzegorski et al., 2006) (HICRU), which is based on the PMD observations. The CF is a product of the cloud top albedo (depending on the cloud optical depth) and the geometrical cloud fraction; it is almost independent from cloud height. From
20
sensitivity studies we estimate the absolute uncertainty of an individual measurement over surfaces free of snow and ice to range from 2% for almost clear pixels to 5% for CF>20% (expressed in absolute CF).
ACPD
7, 17117–17146, 2007Dependence of cloud fraction and cloud
height on temperature T. Wagner et al. Title Page Abstract Introduction Conclusions References Tables Figures ◭ ◮ ◭ ◮ Back Close
Full Screen / Esc
Printer-friendly Version Interactive Discussion 3.2 O2absorption
The O2 absorption at 630 nm is analysed using differential optical absorption
spec-troscopy (Platt, 1994) (DOAS); details of the retrieval can be found in Wagner et al. (2006a). One specific advantage of the DOAS method is that it is based on dif-ferential absorption structures and is therefore hardly affected by instrumental
degra-5
dation. The statistical uncertainty of the retrieved O2 absorption is negligible (<0.3%) for monthly mean values. The observed O2absorption depends on CF and the
effec-tive cloud top height (CTH) of the cloudy part of the observed scene. 3.3 Retrieval of the cloud top height using radiative transfer modeling
The calculation of the effective cloud top height (CTH) from the observed effective cloud
10
fraction (CF) and O2absorption is based on the results of atmospheric radiative transfer
modelling of the O2absorption. While the results of such simulations provide the best
means for the interpretation of the O2absorption measurements, it is also instructive to discuss the general dependencies of the observed O2absorption on cloud properties:
1) First observed O2 absorption depends on the CTH: with increasing CTH an
in-15
creasing fraction of the atmospheric O2 absorption is shielded. Thus high clouds strongly reduce the observed O2absorption (shielding effect).
2) Second, the observed O2 absorption depends on the cloud top albedo: with
in-creasing brightness of the cloud top (depending mainly on the cloud optical depth) an increasing number of the measured photons originates from atmospheric layers at the
20
cloud top (having “seen” a larger O2 absorption). In addition, multiple scattering
in-side the clouds (also depending on the cloud optical depth) can further increase the atmospheric absorption paths. Both effects increase the observed O2absorption (the
strongest increase is found for large cloud optical depth) and we will refer to them as albedo effect. For low cloud altitudes the albedo effect can even overcompensate the
25
shielding effect.
3) Third, the measured O2 absorption depends on the CF. The higher the CF is, the
ACPD
7, 17117–17146, 2007Dependence of cloud fraction and cloud
height on temperature T. Wagner et al. Title Page Abstract Introduction Conclusions References Tables Figures ◭ ◮ ◭ ◮ Back Close
Full Screen / Esc
Printer-friendly Version Interactive Discussion higher is the deviation of the measured O2absorption from the value for the cloud free
case.
We investigated the dependence of the measured O2absorption on CF and CTH in a
quantitative way using our full spherical Monte-Carlo radiative transfer model TRACY-2 (Deutschmann and Wagner, TRACY-2006; Wagner et al., TRACY-2007). For the modeling of the
5
O2absorption of an individual satellite ground pixel, we use the independent pixel
ap-proximation: the O2absorption of the total ground pixel is the average of the modeled O2 absorptions for the clear and for the cloudy parts (weighted by their geometrical
fractions and their respective top of atmosphere albedos). For the modeling of the cloudy part we assumed the following standardised cloud properties: optical depth:
10
50, asymmetry parameter: 0.85; single scattering albedo: 1, vertical thickness: 1 km. Note that the albedo of these clouds is about 80%. Finally, the O2 absorptions are
normalised with respect to the maximum O2 absorptions found for the same solar
zenith angle. This normalization has the advantage that the calculation of the CTH can be performed using a single inversion scheme for a wide range of solar zenith
an-15
gles (SZA<80◦). In the normalization procedure we also applied a correction for the
effect of non-linearity between the measured O2 absorption (for the resolution of the
instrument) and the corresponding integrated O2concentration along the atmospheric
absorption path (Wagner et al., 2003; 2005).
The calculations were performed for three different values of the surface albedo (2%,
20
10%, 30%). The modeled O2absorptions as a function of CF and CTH are shown in
Fig. 1. The calculated relationships – in particular for low CF – are strongly dependent on the surface albedo.
Based on the modeled dependence of the O2 absorption we calculated the global
distribution of the mean CTH from the average values of the CF and the O2absorption
25
for the period January 1996–July 2003 (Figs. 2 and 3). For these calculations we also made use of the average values of the surface albedo as derived by Koelemeijer et al. (2003) (see Fig. 4). For each 2×2 degree grid of the globe the CTH was determined by linear interpolation of the modeled dependencies (Fig. 1) to the respective measured
ACPD
7, 17117–17146, 2007Dependence of cloud fraction and cloud
height on temperature T. Wagner et al. Title Page Abstract Introduction Conclusions References Tables Figures ◭ ◮ ◭ ◮ Back Close
Full Screen / Esc
Printer-friendly Version Interactive Discussion values of the CF, CTH and surface albedo. The determined global map of CTH is
shown in Fig. 5. Note that in our current algorithm, we had to exclude continental areas with low CF (<7%) and high surface elevation (>1.2 km). For such conditions, the measured O2absorption is reduced, because the total atmospheric column is smaller than for zero elevation. In our current algorithm, this decreased O2absorption would be
5
apparently interpreted as shielding effect due to clouds. In connection with the strong dependence of the O2 absorption on CF (see Fig. 1) this would lead to unrealistically high CTH. In future versions of our algorithm this limitation can be, however, generally corrected using information on the global surface elevation and respective adaptation of the radiative transfer modeling.
10
It should be noted that the derived global distributions of CF and CTH show overall good agreement with those of the ISCCP (Schiffer and Rossow, 1983; Rossow and Schiffer, 1999,http://isccp.giss.nasa.gov/climanal.html). It is important to keep in mind that no exact agreement can be expected because of the different sampling times, spectral ranges, spatial resolutions and methodologies.
15
4 Results
In this chapter we present correlation analyses of the cloud properties derived from GOME observations with ST. They are performed as follows: from the individual ob-servations of the CF and O2 absorption (and also ST) we calculated monthly average values for the period January 1996 to July 2003. From these monthly averages,
anoma-20
lies for individual months are derived (deviation from the mean value of the respective month for all years). Using these monthly anomalies we performed correlation analy-ses of the CF versus ST and the O2 absorption versus ST. Note that the amplitude of the ST anomalies for the selected period ranges between about 2 K and 15 K, depend-ing on location on earth, with the highest amplitudes over the continents (see Fig. 6).
25
Global maps of the calculated correlation coefficients of the CF and the O2absorption
versus ST are shown in Fig. 7. Over large parts of the globe negative correlations 17123
ACPD
7, 17117–17146, 2007Dependence of cloud fraction and cloud
height on temperature T. Wagner et al. Title Page Abstract Introduction Conclusions References Tables Figures ◭ ◮ ◭ ◮ Back Close
Full Screen / Esc
Printer-friendly Version Interactive Discussion are found for both quantities indicating that a positive (negative) anomaly of ST is
as-sociated with a negative (positive) anomaly in CF or O2 absorption. One prominent
exception is the pronounced positive correlation of the CF versus ST over the tropical oceans close to the equator.
From the correlation analyses we also determined the slopes of the regression of
5
the monthly CF anomalies versus those of the ST (Fig. 8, top). The changes in CF with increasing ST are negative for most parts of the globe, except over the tropical oceans close to the equator. These findings are in good agreement with those of Bony et al. (1997a), who found a negative correlation of CF (and cloud optical depth) for ST<26◦C and a positive correlation for ST>26◦C.
10
We also determined the slopes of the regression for the O2 absorption anomalies versus those of the ST (see Fig. 9). From these correlations and those of the CF ver-sus ST (Fig. 8, top), we calculated the changes in the CTH per degree ST (Fig. 8, bottom) using radiative transfer modelling. Over almost the whole globe, positive tem-perature anomalies are correlated with increases of CTH. Very strong changes in CTH
15
are found over the tropical oceans close to the equator. Again our findings are in good agreement with those of Bony et al. (1997a), who found a weak positive correlation of CTH for ST<26◦C and strong positive correlation for ST>26◦C. They find a strong
increase of cloud top height (from about 500 mb to 200 mb) for a temperature increase from about 26◦ to 29◦. Also Larson and Hartmann (2003) found an increasing CTH of
20
tropical clouds for increasing ST. They found in particular that over tropical oceans, the frequency of situations with large scale uprising air and high clouds increases strongly for surface temperatures >26◦C.
4.1 Results for time series without the strong ENSO 1997/98
It is interesting to compare the results of the correlation analyses for periods including
25
or excluding the strong ENSO event 1997/98. In Fig. 10 the variations of CF and CTH with changing ST are shown, based on correlation studies excluding the period August 1997–July 1998. Comparing these results with those shown in Fig. 8, we find that
ACPD
7, 17117–17146, 2007Dependence of cloud fraction and cloud
height on temperature T. Wagner et al. Title Page Abstract Introduction Conclusions References Tables Figures ◭ ◮ ◭ ◮ Back Close
Full Screen / Esc
Printer-friendly Version Interactive Discussion over most parts of the globe the results are almost identical. Only over parts of the
tropical oceans substantial differences are found. These findings indicate that results of our correlation studies are representative also for the natural temperature variations beyond strong ENSO events.
4.2 Discussion of various error sources
5
As stated in Sects. 3.1 and 3.2, the errors of the data products (CF and O2absorption)
are typically by far smaller (2% to 5% for the CF, and ∼0.3% for the O2 absorption)
than the observed dependencies per degree ST change. Nevertheless, there are a number of additional error sources (especially important for the correlation analyses), which are discussed in detail in this section.
10
One important question is whether the observed variation of the O2absorption might be simply caused by the changes of atmospheric pressure and temperature associated with variations of ST. In particular at mid latitudes cloud free situations are e.g. typically accompanied by high pressure systems. However, from a quantitative analysis it turns out that the magnitude (and for most regions also the sign) of the observed O2
ab-15
sorption changes can not be explained by the direct influence of these meteorological parameters. It should be also noted that for large SZA (> about 80◦, corresponding
to latitudes poleward of about 60◦), several effects can lead to increasing
uncertain-ties compared to observations at lower SZA. First, because of the long atmospheric light paths, the relative contribution of Rayleigh scattering to the total observed
radi-20
ance increases. Second, because of the increased O2 absorption, the non-linearity between the measured O2 absorption and the integrated O2 concentration along the
atmospheric absorption path increases (see above). Third, and probably most im-portant, the probability of interference with snow and ice-covered surfaces increases. The first two effects might lead to an error in the magnitude (but not the sign) of the
25
calculated CTH change. The third effect, however, might even affect the sign of the cal-culated change in CTH (and also CF) per degree ST for some regions of the world. We estimate this potential source of errors from individual correlation analyses for different
ACPD
7, 17117–17146, 2007Dependence of cloud fraction and cloud
height on temperature T. Wagner et al. Title Page Abstract Introduction Conclusions References Tables Figures ◭ ◮ ◭ ◮ Back Close
Full Screen / Esc
Printer-friendly Version Interactive Discussion seasons (see Sect. 4.3).
In our radiative transfer calculations simplified homogenous cloud layers were as-sumed. In the presence of complex cloud formations, the photon paths between sep-arated cloud fragments can become important because they can enhance the O2 ab-sorption. In the case of horizontally broken cloud fields, the additional horizontal photon
5
paths typically increase the O2absorption compared to a homogenous cloud layer with
similar total optical depth. Taking this effects into account, the observed decrease of the O2 absorption with increasing ST might be partly also caused by a change in the
horizontal homogeneity of the cloud cover (towards a horizontally more homogenous distribution). However, from sensitivity studies using our radiative transfer model, we
10
find that the magnitude of the observed changes in the O2 absorption can hardly be explained by this effect.
Also vertical inhomogeneities (cloud layers) can increase the O2 absorption due to
enhanced photon paths between separate cloud layers. From radiative transfer cal-culations we found that this effect is especially pronounced if rather thin cloud layers
15
(optical depth <5) are located above cloud layers with higher optical depth. For such cases, an increase of the height of the thin cloud layer can even increase the O2 ab-sorption (the shielding effect is then slightly overcompensated by the increased path lengths of the photons “reflected” between the cloud layers). Thus, in principle, an ob-served decrease of the O2 absorption could even indicate a decrease of a thin cloud
20
layer above the thick cloud layer located below. However, again this effect is rather small, and can by far not explain the observed changes in the O2absorption. We
con-clude that only a change in the height of cloud layers with high optical depth (optical depth > about 10) can explain the observed large changes in the O2absorptions due to
the shielding effect. Changes of the inhomogeneities in vertical and horizontal direction
25
might explain only part of the observed O2absorption changes.
In summary, we conclude that except in polar regions (see Sect. 4.3), the results of the correlation analyses can be interpreted in a quantitative way for the CF. For the CTH, the results of the correlation analyses can be only considered as qualitative
ACPD
7, 17117–17146, 2007Dependence of cloud fraction and cloud
height on temperature T. Wagner et al. Title Page Abstract Introduction Conclusions References Tables Figures ◭ ◮ ◭ ◮ Back Close
Full Screen / Esc
Printer-friendly Version Interactive Discussion information. However, we believe that even qualitative information is very useful here,
since currently even the sign of cloud feedback is still unknown. 4.3 Results derived for specific seasons
At mid and high latitudes the results of our correlation analyses can be potentially influ-enced by the variations of snow and ice cover during winter. This influence becomes
5
especially important, because it can be expected that for positive temperature anoma-lies the probability of snow and ice should be reduced compared to average conditions. As a consequence, the CF should be apparently decreased (because the HICRU algo-rithm can not discriminate between bright surfaces and clouds) leading to a negative correlation between CF and ST. Similarly, the O2 absorption should be also reduced
10
for reduced snow and ice cover because of the albedo effect. Again this would lead to a negative correlation between the O2absorption and ST.
Because of these potential interferences, the results of our correlation analyses at high latitudes must in principle be treated with care during winter months. One possibil-ity to estimate the potential error caused by snow and ice is to perform the correlation
15
studies for separate seasons. The corresponding results for such seasonal correla-tion studies of CF with changing temperature are shown in Fig. 11. The results for most parts of the world are very similar (but with larger amplitudes and larger scatter) as analyzed for the whole time series (Fig. 8, top). However, especially in the north-ern hemispheric winter, also positive correlations can be found between the CF and
20
ST over parts of northern America and Siberia. Since the possible interference with snow and ice should lead to a negative feedback, we can conclude that the ice- and snow-induced interference should be rather small.
The corresponding results for the seasonal correlations of the O2 absorption with changing temperature are shown in Fig. 12. Again, the results are very similar to those
25
obtained for the whole time series (Fig. 9). For all seasons a negative correlation between the O2 absorption and ST is found for northern hemisphere high latitudes. From these results, we can not rule out that part of these negative correlations might
ACPD
7, 17117–17146, 2007Dependence of cloud fraction and cloud
height on temperature T. Wagner et al. Title Page Abstract Introduction Conclusions References Tables Figures ◭ ◮ ◭ ◮ Back Close
Full Screen / Esc
Printer-friendly Version Interactive Discussion be caused by interference with snow and ice. However, from the seasonal correlation
analyses for the CF and ST we conclude that the influence of ice and snow should be rather small. In Fig. 13 the changes in CTH associated with variations in ST are shown.
5 Conclusions
The observed dependencies of CF and CTH on surface-near temperature can provide
5
information on cloud climate feedback. However, since cloud climate feedback involves complex interactions, depending especially on cloud type, location and season, the interpretation of our results with respect to climate feedback is not straightforward. Therefore, the major conclusion of our study is that the results should aim to serve as a test case for climate models. Another limitation of our results is that they are only
10
representative for a fixed time of the day.
Nevertheless, it is instructive to draw some general conclusions from the observed correlations. We therefore relate our results to the general dependencies of cloud forcing, which can be summarised as follows:
a) in general, clouds tend to cool the Earth-atmosphere-system. However, this
de-15
pends especially on season and latitude. The cooling effect of clouds is especially strong in the summer hemisphere. (Stephens, 2005; Ramanathan et al., 1989; Harri-son et al., 1990).
b) cloud heating increases with increasing cloud top height (Stephens, 2005; Cess et al., 1992; Kubar and Hartmann, 2007).
20
Based on the first dependency, no clear general conclusions can be drawn here. The only significant conclusion might be that especially in the summer hemisphere, the negative correlation between ST and CF indicates a positive cloud feedback (see results in Sect. 4.3). From the second dependency, however, we conclude that over almost the whole globe, our results indicate a positive cloud feedback.
25
One important general question is whether the observed dependencies might be ex-trapolated to a future temperature increase caused by climate change. While this
ACPD
7, 17117–17146, 2007Dependence of cloud fraction and cloud
height on temperature T. Wagner et al. Title Page Abstract Introduction Conclusions References Tables Figures ◭ ◮ ◭ ◮ Back Close
Full Screen / Esc
Printer-friendly Version Interactive Discussion tion is in general difficult to answer, our data sets might have some specific advantages
to address this aspect. They describe cloud-temperature relationships for the “natural” variability at fixed locations over 7.5 years (while other studies investigate changes as-sociated with strong changes asas-sociated with e.g. volcanic eruptions or ENSO events, or investigating the spatial variability). Thus our results might be especially well suited
5
for long term future predictions. Indeed, similar relationships between the CF, O2
ab-sorption and ST are found in the spatial distribution of trends (Wagner et al., 2006b) for the period January 1996–December 2002. However, the only means to provide reliable future predictions, are results of climate models. Our results should thus be used as a test case for such models. If these models are not able to reproduce the observed
10
dependencies of CF and CTH on SF, this might indicate important deficiencies in mod-eling details of cloud physics. In the case of good agreement, this comparison should provide new insights in the magnitude and the detailed mechanisms of cloud climate feedback.
Acknowledgements. We like to thank the European Space Agency (ESA) operation center
15
in Frascati (Italy) and the “Deutsches Zentrum f ¨ur Luft- und Raumfahrt” (DLR, Germany) for making the ERS-2 satellite spectral data available. Surface-near temperature data are from the Goddard Institute for Space Studies (GISS) (Hansen et al., 2001; Reynolds et al., 2002),
http://www.giss.nasa.gov/data/update/gistemp/).
References
20
Bergman, J. W. and Salby, M. L.: Diurnal variations of cloud cover and their relationship to climatological conditions, J. Climate, 9, 2802–2820, 1996.
Bony, S., Lau, K.-M., and Sud, Y. C.: Sea surface temperature and large-scale circulation influences on tropical greenhouse effect and cloud radiative forcing, J. Climate, 2055–2077, 1997a.
25
Bony, S., Sud, Y., Lau, K.-M., Susskind, J., and Saha, S.: Comparison and assessment of NASA/DAO and NCEP-NCAR reanalyses over tropical oceans: atmospheric hydrology and radiation, J. Climate, 1441–1462, 1997b.
ACPD
7, 17117–17146, 2007Dependence of cloud fraction and cloud
height on temperature T. Wagner et al. Title Page Abstract Introduction Conclusions References Tables Figures ◭ ◮ ◭ ◮ Back Close
Full Screen / Esc
Printer-friendly Version Interactive Discussion
Bony, S. and Dufresne, J.-L.: Marine boundary layer clouds at the heart of tropi-cal cloud feedback uncertainties in climate models, Geophys. Res. Lett., 32, L20806, doi:10.1029/2005GL023851, 2005.
Burrows, J. P., Weber, M., Buchwitz, M., Rozanov, V., Ladst ¨atter-Weißenmayer, A., Richter, A., DeBeek, R., Hoogen, R., Bramstedt, K., Eichmann, K.-U., Eisinger, M., and Perner, D.: The
5
Global Ozone Monitoring Experiment (GOME): Mission Concept and First Scientific Results, J. Atmos. Sci., 56, 151–175, 1999.
Cess, R., Potter, G. L., Blanchet, J. P., et al.: Intercomparison and interpretation of cloud-climate feedback processes in nineteen atmospheric general circulation models, J. Geophys. Res., 95, 16 601–16 615, 1990.
10
Cess, R. D. Kwon, T. Y., Harrison, E. F., et al.: Interpretation of seasonal cloud-climate inter-actions using Earth Radiation Budget Experiment data, J. Geophys. Res., 97, 7613–7617, 1992.
Cess, R. D., Zhang, M. H., Ingram, W. J., Potter, G. L., Alekseev, V., Barker, H. W., Cohen-Solal, E., Colman, R. A., Dazlich, D. A., Del Genio, A. D., Dix, M. R., Dymnikov, V., Esch, M.,
15
Fowler, L. D., Fraser, J. R., Galin, V., Gates, W. L., Hack, J. J., Kiehl, J. T., Treut, H. L., Lo, K. K. W., McAvaney, B. J., Meleshko, V. P., Morcrette, J. J., Randall, D. A., Roeckner, E., Royer, J. F., Schlesinger, M. E., Sporyshev, P. V., Timbal, B., Volodin, E. M., Taylor, K. E., Wang, W., and Wetherald, R. T.: Cloud feedback in atmospheric general circulation models: An update, J. Geophys. Res., 101, 12 791–12 794, 1996.
20
Cess, R. D. and Udelhofen, P. M.: Climate change during 1985–1999: Cloud in-teractions determined from satellite measurements, Geophys. Res. Lett., 30, 1019, doi:10.1029/2002GL016128, 2003.
Deutschmann, T. and Wagner, T.: TRACY-II Users manual, University of Heidelberg (http://
satellite.iup.uni-heidelberg.de/∼tdeutsch/manual.pdf), 2006.
25
Fu, Q., Baker, M., and Hartmann, D. L.: Tropical cirrus and water vapor: an effective infrared iris feedback?, Atmos. Chem. Phys., 2, 31–37, 2002.
Grzegorski, M., Wenig, M., Platt, U., Stammes, P., Fournier, N., and Wagner, T.: The Heidelberg iterative cloud retrieval utilities (HICRU) and its application to GOME data, Atmos. Chem. Phys., 6, 4461–4476, 2006,http://www.atmos-chem-phys.net/6/4461/2006/.
30
Hansen, J., Ruedy, R., Sato, M., Imhoff, M., Lawrence, W., Easterling, D., Peterson, T., and Karl, T.: A closer look at United States and global surface temperature change, J. Geophys. Res., 106, 23 947–23 963, 2001.
ACPD
7, 17117–17146, 2007Dependence of cloud fraction and cloud
height on temperature T. Wagner et al. Title Page Abstract Introduction Conclusions References Tables Figures ◭ ◮ ◭ ◮ Back Close
Full Screen / Esc
Printer-friendly Version Interactive Discussion
Hartmann, D. L., Moy, L. A., and Fu, Q.: Tropical convection and the energy balance at the top of the atmosphere, J. Climate, 14, 4495–4511, 2001.
Harrison, E., Minnis, F. P., and Barkstrom, B. R.: Seasonal variations of cloud radiative forcing derived from the Earth’s Radiation Budget Experiment, J. Geophys. Res., 95, 18 687–18 703, 1990.
5
Koelemeijer, R. B. A., de Haan, J. F., and Stammes, P.: A database of spectral surface reflec-tivity in the range 335–772 nm derived from 5.5 years of GOME observations, J. Geophys. Res., 108, 4070, doi:10.1029/2002JD002429, 2003.
Kubar, T. L., Hartmann, D. L., and Wood, R.: Radiative and convective driving of tropical high clouds, J. Climate, in press, 2007.
10
Larson, K. and Hartmann, D. L.: Interactions among cloud, water vapor, radiation, and large-scale circulation in the tropical climate, part I: sensitivity to uniform sea surface temperature changes, J. Climate, 16, 1425–1440, 2003.
Platt, U.: Differential optical absorption spectroscopy (DOAS), Air monitoring by spectroscopic techniques, edited by: Sigrist, M. W. Ed., Chemical Analysis Series, 127, John Wiley & Sons,
15
Inc., 1994.
Ramanathan, V., Cess, R. D., Harrison, E. F., et al.: Cloud radiative forcing and climate; Results from the Earth Radiation Budget Experiment, Science, 243, 57–63, 1989.
Ramanathan, V. and Inamdar, A.: The radiative forcing due to clouds and water vapor, Frontiers of Climate Modeling, edited by: Kiehl, J. T. and Ramanthan, V., (Cambridge University Press,
20
119–151, 2006.
Reynolds, R. W., Rayner, N. A., Smith, T. M., Stokes, D. C., and Wang, W.: An improved in situ and satellite SST analysis for climate, J. Climate, 15, 1609–1625, 2002.
Rossow, W. B. and Schiffer, R. A.: Advances in understanding clouds from ISCCP, Bull. Amer. Meteorol. Soc., 80, 2261–2287, 1999.
25
Schiffer, R. A. and Rossow, W. B.: ISCCP: The first project of the World Climate Research Program, Bull. Amer. Meteorol. Soc., 64, 770–784, 1983.
Soden, B. and Held, I.: An assessment of climate feedbacks in coupled ocean-atmosphere models, J. Climate, 19, 3354–3360, 2006.
Solomon, S., Qin, D., Manning, M., et al.: Climate Change 2007: The Physical Science Basis.
30
Contribution of Working Group I to the Fourth Assessment Report of the Intergovernmental Panel on Climate Change (IPCC), Cambridge University Press, Cambridge, United Kingdom and New York, NY, USA, 2007.
ACPD
7, 17117–17146, 2007Dependence of cloud fraction and cloud
height on temperature T. Wagner et al. Title Page Abstract Introduction Conclusions References Tables Figures ◭ ◮ ◭ ◮ Back Close
Full Screen / Esc
Printer-friendly Version Interactive Discussion
Stephens, G. and Greenwald, T. J.: The Earth’s radiation budget and its relation to atmospheric hydrology 2. Observations of cloud effects, J. Geophys. Res., 96, 15 325–15 340, 1991. Stephens, G. L.: Cloud feedbacks in the climate system: A critical review, J. Climate, 18, 237–
273, 2005.
Tian, B. and Ramanathan, V.: Role of clouds in surface and atmospheric energy budget, J.
5
Climate, 15, 296–305, 2002.
Wagner, T., Heland, J., Z ¨oger, M., and Platt, U.: A fast H2O total column density product from GOME - validation with in-situ aircraft measurements, Atmos. Chem. Phys., 3, 651–663, 2003,http://www.atmos-chem-phys.net/3/651/2003/.
Wagner, T., Beirle, S., Grzegorski, M., Sanghavi, S., and Platt, U.: El-Ni ˜no induced anomalies in
10
global data sets of water vapour and cloud cover derived from GOME on ERS-2, J. Geophys. Res., 110, D15104, doi:10.1029/2005JD005972, 2005.
Wagner, T., Beirle, S., Grzegorski, M., and Platt, U.: Global trends (1996 to 2003) of total column precipitable water observed by GOME on ERS-2 and their relation to surface-near temperature, J. Geophys. Res., 111, D12102, doi:10.1029/2005JD006523, 2006a.
15
Wagner, T., Beirle, S., Grzegorski, M., and Platt, U.: Investigating the Earth’s hydrological cycle using H2O VCDs and cloud related parameters from GOME-II, Proceedings of the 1st EPS/MetOp RAO Workshop ESRIN, Frascati, Italy, 15–17 May 2006, (http://earth.esrin.esa.
it/workshops/EPS MetOp RAO 2006/proceedings/papers/p wagne.pdf), 2006b.
Wagner, T., Burrows, J. P., Deutschmann, T., Dix, B., von Friedeburg, C. Frieß, U., Hendrick,
20
F., Heue, K.-P., Irie, H., Iwabuchi, H., Kanaya, Y., Keller, J., McLinden, C. A., Oetjen, H., Palazzi, E., Petritoli, A., Platt, U. Postylyakov, O., Pukite, J., Richter, A., van Roozendael, M., Rozanov, A. Rozanov, V., Sinreich, R., Sanghavi, S., and Wittrock, F.: Comparison of Box-Air-Mass-Factors and Radiances for Multiple-Axis Differential Optical Absorption Spec-troscopy (MAX-DOAS) Geometries calculated from different UV/visible Radiative Transfer
25
Models, Atmos. Chem. Phys., 7, 1809–1833, 2007,
http://www.atmos-chem-phys.net/7/1809/2007/.
Webb, M. J., Senior, C. A., Sexton, D. M. H., Ingram, W. J., Williams, K. D., Ringer, M. A., McAvaney, B. J., Colman, R., Soden, B. J., Gudgel, R., Knutson, T., Emori, S., Ogura, T., Tsushima, Y., Andronova, N., Li, B., Musat, I., Bony, S., and Taylor, K. E.: On the contribution
30
of local feedback mechanisms to the range of climate sensitivity in two GCM ensembles, Clim. Dynam., 27, 17–38, 2006.
Williams, K. D., Ringer, M. A., Senior, C. A., Webb, M. J., McAvaney, B. J., Andronova, N.,
ACPD
7, 17117–17146, 2007Dependence of cloud fraction and cloud
height on temperature T. Wagner et al. Title Page Abstract Introduction Conclusions References Tables Figures ◭ ◮ ◭ ◮ Back Close
Full Screen / Esc
Printer-friendly Version Interactive Discussion
Bony, S., Dufresne, J.-L., Emori, S., Gudgel, R., Knutson, T., Li, B., Lo, K., Musat, I., Weg-ner, J., Slingo, A., and Mitchell, J. F. B.: Evaluation of a component of the cloud response to climate change in an intercomparison of climate models, Clim. Dynam., 26, 145–165, doi:10.1007/s00382-005-0067-7, 2006.
ACPD
7, 17117–17146, 2007Dependence of cloud fraction and cloud
height on temperature T. Wagner et al. Title Page Abstract Introduction Conclusions References Tables Figures ◭ ◮ ◭ ◮ Back Close
Full Screen / Esc
Printer-friendly Version Interactive Discussion Figures surface albedo: 2% 0 0 .2 0 .4 0 .6 0 .8 1 0 % 2 0 % 4 0 % 6 0 % 8 0 % 1 0 0 % C lo u d fra c tio n N o rm a li s e d O 2 a b s o rp ti o n C T H : 1k m 1 2 km 9 k m 7 k m 4 k m 2 km surface albedo: 10% 0 0 .2 0 .4 0 .6 0 .8 1 0 % 2 0 % 4 0 % 6 0 % 8 0 % 1 0 0 % C lo u d fra c tio n N o rm a li s e d O 2 a b s o rp ti o n C T H : 1 k m 1 2 k m 9 k m 7 k m 4 k m 2 k m surface albedo: 30% 0 0 .2 0 .4 0 .6 0 .8 1 0 % 2 0 % 4 0 % 6 0 % 8 0 % 1 0 0 % C lo u d fra c tio n N o rm a li s e d O 2 a b s o rp ti o n C T H : 1 k m 1 2 k m 9 k m 7 k m 4 k m 2 k m
Fig. 1: Simulation of the measured normalised O absorption as a function of CF and
Fig. 1. Simulation of the measured normalised O2absorption as a function of effective cloud
fraction and effective cloud top height calculated from radiative transfer modeling. The results are for different values of the surface albedo (top: 2%, center: 10%, bottom: 30%). Depending on the effective cloud top height and the surface albedo, clouds can increase or decrease the measured O2absorption compared to clear sky conditions.
ACPD
7, 17117–17146, 2007Dependence of cloud fraction and cloud
height on temperature T. Wagner et al. Title Page Abstract Introduction Conclusions References Tables Figures ◭ ◮ ◭ ◮ Back Close
Full Screen / Esc
Printer-friendly Version Interactive Discussion Effective cloud fraction [%]
Fig. 2: Effective cloud fraction averaged for the period January 1996-December Fig. 2. Effective cloud fraction averaged for the period January 1996–December 2002. Please
note that snow and ice is also detected as clouds causing high values in polar regions.
ACPD
7, 17117–17146, 2007Dependence of cloud fraction and cloud
height on temperature T. Wagner et al. Title Page Abstract Introduction Conclusions References Tables Figures ◭ ◮ ◭ ◮ Back Close
Full Screen / Esc
Printer-friendly Version Interactive Discussion
N
o
rm
a
lise
d
O
2
a
b
so
rp
ti
o
n
Fig. 3: Normalised O absorption averaged for the period January 1996-December
Fig. 3. Normalised O2absorption averaged for the period January 1996–December 2002.ACPD
7, 17117–17146, 2007Dependence of cloud fraction and cloud
height on temperature T. Wagner et al. Title Page Abstract Introduction Conclusions References Tables Figures ◭ ◮ ◭ ◮ Back Close
Full Screen / Esc
Printer-friendly Version Interactive Discussion Av e ra g e s u rf a ce a lb e d o a t 6 7 0 n m
Fig. 4: Average surface albedo (670nm) taken fromKoelemeijer et al. [2003].
Fig. 4. Average surface albedo (670 nm) taken from Koelemeijer et al. (2003).
ACPD
7, 17117–17146, 2007Dependence of cloud fraction and cloud
height on temperature T. Wagner et al. Title Page Abstract Introduction Conclusions References Tables Figures ◭ ◮ ◭ ◮ Back Close
Full Screen / Esc
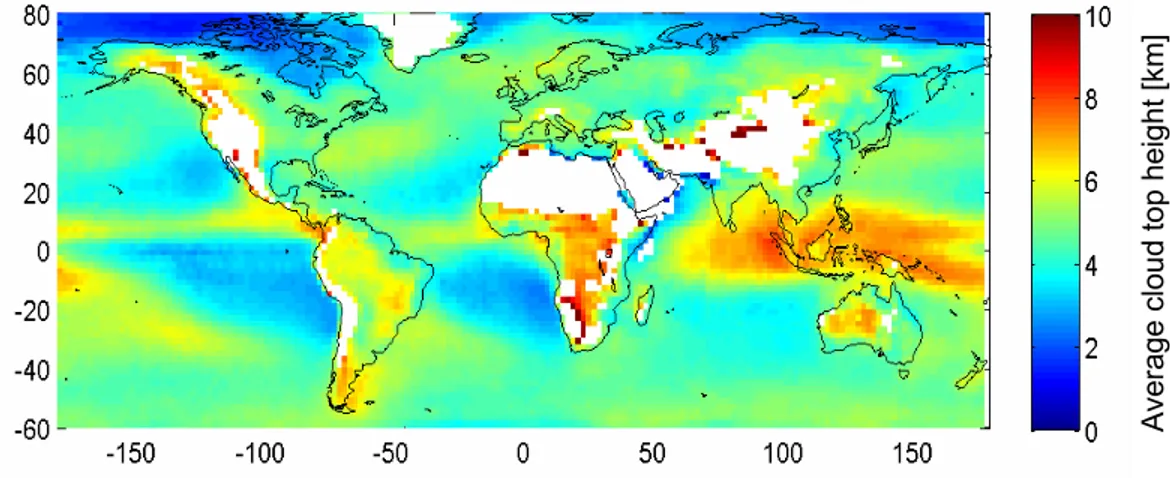
Printer-friendly Version Interactive Discussion Av e ra g e cl o u d t o p h e ig h t [k m ]
Fig. 5: Average CTH calculated from the measured CF and O absorption. For areas
Fig. 5. Average effective cloud top height calculated from the measured CF and O2
absorp-tion. For areas with low cloud fraction and high surface elevation, no meaningful inversion was possible with the current version of our algorithm (see text).
ACPD
7, 17117–17146, 2007Dependence of cloud fraction and cloud
height on temperature T. Wagner et al. Title Page Abstract Introduction Conclusions References Tables Figures ◭ ◮ ◭ ◮ Back Close
Full Screen / Esc
Printer-friendly Version Interactive Discussion
ma
xi
m
u
m
a
m
p
lit
u
d
e
[
K]
St
a
n
d
a
rd
d
e
vi
a
ti
o
n
[
K
]
Fig. 6. Global distribution of the maximum amplitude (top) and standard deviation (bottom) of
the monthly anomalies of the surface-near temperature. The strongest variation is found over the continents.
ACPD
7, 17117–17146, 2007Dependence of cloud fraction and cloud
height on temperature T. Wagner et al. Title Page Abstract Introduction Conclusions References Tables Figures ◭ ◮ ◭ ◮ Back Close
Full Screen / Esc
Printer-friendly Version Interactive Discussion C o rre la ti o n co e ff ici e n t (C F ve rsu s ST ) C o rr e la ti o n co e ff ici e n t (O 2 a b so rp ti o n ve rsu s S T )
Fig. 7. Top: Correlation coefficients of the monthly anomalies of the effective cloud fraction
versus surface-near temperature (top) and the O2absorption versus surface-near temperature (bottom).
ACPD
7, 17117–17146, 2007Dependence of cloud fraction and cloud
height on temperature T. Wagner et al. Title Page Abstract Introduction Conclusions References Tables Figures ◭ ◮ ◭ ◮ Back Close
Full Screen / Esc
Printer-friendly Version Interactive Discussion C h a n g e i n C F (a b so lu te % ) p e r d e g re e S T C h a n g e i n C T H ( k m) p e r d e g re e ST
Fig. 8. Absolute changes of the effective cloud fraction (CF, top) and effective cloud top height
(CTH, bottom) with increasing surface-near temperature (ST). The changes of the CF are ex-pressed as % (absolute CF) per degree ST; those of the CTH are exex-pressed as km per degree ST. Note that for high latitudes (poleward of about 60◦) our results have increased uncertainties
because of the high solar zenith angles and possible interference with ice and snow covered surfaces (see text).
ACPD
7, 17117–17146, 2007Dependence of cloud fraction and cloud
height on temperature T. Wagner et al. Title Page Abstract Introduction Conclusions References Tables Figures ◭ ◮ ◭ ◮ Back Close
Full Screen / Esc
Printer-friendly Version Interactive Discussion re la ti ve ch a n g e i n O 2 a b so rp ti o n [ % ] p e r d e g re e ST
Fig. 9: Slope of the regression line derived from the correlation analysis of the
Fig. 9. Slope of the regression line derived from the correlation analysis of the monthly
anoma-lies of the O2absorption and the surface-near temperature (relative change in % per Kelvin). Over large parts of the globe the O2 absorption decreases with increasing surface-near tem-perature.
ACPD
7, 17117–17146, 2007Dependence of cloud fraction and cloud
height on temperature T. Wagner et al. Title Page Abstract Introduction Conclusions References Tables Figures ◭ ◮ ◭ ◮ Back Close
Full Screen / Esc
Printer-friendly Version Interactive Discussion C h a n g e i n C F (a b so lu te % ) p e r d e g re e ST C h a n g e i n C T H ( k m) p e r d e g re e ST
Fig. 10 Same as Fig 8, but excluding the strong ENSO event (August 1997 – July Fig. 10. Same as Fig. 8, but excluding the strong ENSO event (August 1997–July 1998). Even
over the tropical oceans the differences compared to Fig. 8 are rather small.
ACPD
7, 17117–17146, 2007Dependence of cloud fraction and cloud
height on temperature T. Wagner et al. Title Page Abstract Introduction Conclusions References Tables Figures ◭ ◮ ◭ ◮ Back Close
Full Screen / Esc
Printer-friendly Version Interactive Discussion Spring Summer C h a n g e i n C F (a b so lu te % ) p e r d e g re e ST Autumn Winter
Fig. 11: Results (slope) of the correlation analysis between CF and surface-near
Fig. 11. Results (slope) of the correlation analysis between CF and surface-near temperature
for various seasons.
ACPD
7, 17117–17146, 2007Dependence of cloud fraction and cloud
height on temperature T. Wagner et al. Title Page Abstract Introduction Conclusions References Tables Figures ◭ ◮ ◭ ◮ Back Close
Full Screen / Esc
Printer-friendly Version Interactive Discussion Spring Summer re la ti v e c h a n g e i n O2 a b s o rp ti o n [ % ] p e r d e g re e ST Autumn Winter
Fig. 12: Results (slope) of the correlation analysis between the O2 absorption and the
Fig. 12. Results (slope) of the correlation analysis between the O2absorption and the
surface-near temperature for various seasons.
ACPD
7, 17117–17146, 2007Dependence of cloud fraction and cloud
height on temperature T. Wagner et al. Title Page Abstract Introduction Conclusions References Tables Figures ◭ ◮ ◭ ◮ Back Close
Full Screen / Esc
Printer-friendly Version Interactive Discussion Spring Summer C h a n g e i n C T H (k m) p e r d e g re e S T Autumn Winter
Fig. 13: Results of the variation of the CTH with changing ST for various seasons.
Fig. 13. Results of the variation of the CTH with changing ST for various seasons.


![Fig. 4: Average surface albedo (670nm) taken from Koelemeijer et al. [2003].](https://thumb-eu.123doks.com/thumbv2/123doknet/14630137.547996/22.918.56.643.194.447/fig-average-surface-albedo-nm-taken-from-koelemeijer.webp)