HAL Id: hal-00299077
https://hal.archives-ouvertes.fr/hal-00299077
Submitted on 1 Jan 2003
HAL is a multi-disciplinary open access
archive for the deposit and dissemination of
sci-entific research documents, whether they are
pub-lished or not. The documents may come from
teaching and research institutions in France or
abroad, or from public or private research centers.
L’archive ouverte pluridisciplinaire HAL, est
destinée au dépôt et à la diffusion de documents
scientifiques de niveau recherche, publiés ou non,
émanant des établissements d’enseignement et de
recherche français ou étrangers, des laboratoires
publics ou privés.
Historical floods in the Dutch Rhine Delta
R. Glaser, H. Stangl
To cite this version:
R. Glaser, H. Stangl. Historical floods in the Dutch Rhine Delta. Natural Hazards and Earth System
Science, Copernicus Publications on behalf of the European Geosciences Union, 2003, 3 (6),
pp.605-613. �hal-00299077�
and Earth
System Sciences
Historical floods in the Dutch Rhine Delta
R. Glaser and H. StanglUniversity of Heidelberg, Department of Geography, INF 348, 69120 Heidelberg, Germany Received: 23 September 2002 – Revised: 6 February 2003 – Accepted: 12 February 2003
Abstract. Historical records provide direct information
about the climatic impact on society. Especially great natural disasters such as river floods have been for long attracting the attention of humankind. Time series for flood development on the Rhine branches Waal, Nederrijn/Lek and IJssel in the Dutch Rhine Delta are presented in this paper. In the case of the Waal it is even possible to compare historical flood fre-quencies based on documentary data with the recent devel-opment reconstructed from standardized instrumental mea-surements. In brief, we will also discuss various parameters concerning the structure of the flood series and the “human dimension” of natural disaster, i.e. the vulnerability of soci-ety when facing natural disasters.
1 Introduction
Flood events such as the one along the Danube and Elbe River in the summer of 2002 regularly cause discussions about the influence of global warming. There is evidence that the frequency of strong precipitation events generally in-crease. Until 2050, most climate change scenarios predict an increase in the average annual discharge of about 10% north of the Alps (IPCC and McCarthy, 2001). In order for us to be able to create and validate appropriate models we need to know and understand climatic development of the past such as the frequency of floods.
Since the late 18th century, flood patterns in Central Eu-rope have been evaluated on the basis of official and stan-dardized measuring data. In various regions climate change seems to be a factor for the intensification of natural disas-ters both in number and extent. For the Rhine catchment area, winter precipitation has increased approximately 30%. These changes go along with a corresponding increase of an-nual flood discharge from 1891 on – for example at the gaug-ing station Cologne (Mendel et al., 1997).
Correspondence to: R. Glaser
On a global as well as on a regional scale, this relatively short phase of up to about 200 years is still the only com-monly recognized scale for characterizing climate and flood patterns. The question arises on whether the changes within this period are part of a long-term natural development or a sign of the human impact on climate. Furthermore we have to ask which dimension these changes have in a historical context.
Up to a certain point past climate research can provide an-swers to these questions. Historical records, in various re-gions of Central Europe dating back more than 1000 years, provide direct information about the climatic impact on soci-ety. Their high temporal resolution is of special value for the examination of natural disasters such as river floods. Besides extensive reconstructions of singular historic flood events (Corsten, 2001; Munzar, 2001; Tetzlaff et al., 2001), vari-ous publications present long time series of flood frequen-cies (Br´azdil et al., 1999; P¨ortge and Deutsch, 2000; Sturm et al., 2001). Figure 1 illustrates the findings of several Cen-tral European rivers. In this paper we will discuss the flood development along the Rhine branches Waal, Nederrijn/Lek and IJssel in the Dutch Rhine Delta (Fig. 2). Time series dat-ing back to AD 1350 will be presented as well as a concise discussion on their underlying control mechanisms. Further-more, the human dimension of flood events will be briefly reviewed.
2 Flood data and its interpretation
2.1 Flood observation in the Dutch Rhine Delta
Since the beginning of our historic time, climate and its ex-tremes have been attracting the attention of humankind. Peo-ple wrote documents and recorded early instrumental read-ings. In Western and Central Europe, climate observations in historical documents have existed since the Carolingian era. After Pfister (2001), looking at the amount and conti-nuity of this material, we can divide the past 1250 years into
606 R. Glaser and H. Stangl: Historical floods in the Dutch Rhine Delta 1300 1400 1500 1600 1700 1800 1900 2000 Year 31-year running mean, s tandardized Danube Main Pegnitz Lower Rhine
Fig. 1. 31-year running mean of historical floods on various European rivers (Glaser and Stangl, revised).
Table 1. Periods of climate observation in Central Europe (after Pfister, 2001)
from temporal resolution availability source type
∼AD 700 - (yearly) sporadic document ∼AD 1250 seasonal almost uninterrupted document ∼AD 1500 monthly (daily) almost uninterrupted document
∼AD 1680 daily sporadic instruments, individuals ∼AD 1860 daily (intra-daily) uninterrupted instruments, officials
five periods with gradually increasing source availability and temporal resolution (Table 1).
In the area of the Dutch Rhine Delta we may assume suf-ficient source availability on from about AD 1350. Histori-cal records such as the “Cameraarsrekeningen van Deventer” and the “Stadsrekeningen van Arnhem” provide valuable in-formation over many centuries. The financial consequences of river floods concerning dike protection and repairs are es-pecially mentioned in these accounts. Monasteric chronicles or weather diaries written by individuals give further infor-mation about the extents and often even about the causes of flood events.
Thanks to compilations edited by authors like Weikinn (1958–1963), Gottschalk (1971–1977), and Alexandre (1987), lots of historical sources are easily available today. To provide modern data handling, a graphical presentation, and the possibility for statistical analysis, data banks like the “HISKLID” (http://www24.brinkster.com/hisklid/index. htm) have been developed.
In the course of enlightenment and the invention of new technical devices we notice the emergence of the first quan-titative data sets. They are provided by individual instru-mental measurements and flood marks on bridges, houses, or city ports. Finally, for the regular acquisition of hydrologic
parameters, national and international measuring networks were established, providing objective and standardized data sets. At the gauging station Nijmegen along the Waal daily acquisition of water level data was started as early as 1770, following some large flood events in the preceding years.
Today online data banks make this information available even to the general public. River measuring data for the Netherlands have been compiled by the “Rijkswaterstaat” (http://www.waterbase.nl).
2.2 Data evaluation and interpretation
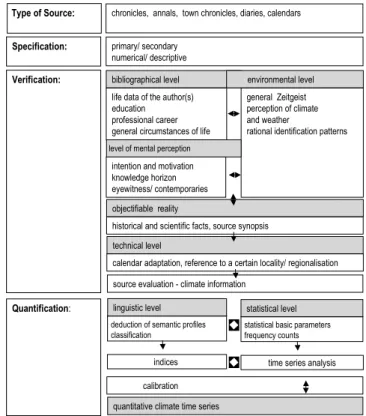
While dealing with historical data, one has to be aware of the subjective nature of written sources. The reason for this is the fundamental influence of man’s individual perception. Gen-erally speaking, separating subjective from objective compo-nents of historical sources requires historical methods of data evaluation and interpretation, including critical source anal-ysis and hermeneutics. Where available, interregional com-parison by means of source synopsis is of special benefit for the acquisition of reliable data. Figure 3 shows a scheme for the critical evaluation and interpretation of historical docu-ments.
Gent Brussels Antwerpen Rotterdam Den Haag Cologne Amsterdam Arnhein Deventer Dusseldorf Duisburg Essen BELGIUM GERMANY THE NETHERLANDS Ijsselmeer o er Rh ne L w i Lek Waal l Ijs se Nijmegen Neder ri nj North Sea
Fig. 2. The Dutch Rhine Delta.
historical data. One next step is their quantification. There-fore understanding hydrological processes is as fundamental as statistical tests and multiple statistical methods. A com-mon procedure is the derivation of indices. Levels of magni-tude (e.g. duration of the flood or buildings damaged by the water), expressed in the records, are correlated with numeri-cal methods. Taking into account the descriptions about the flood consequences on other natural phenomena, for instance the phenological status or soil conditions, Sturm et al. (2001) such developed a scheme for the intensity classification of historical floods (Table 2).
A crucial problem is the combination of historical data based on the description of flood damages, and discharge data based on water level measurements into a single com-parable series. Sometimes we even have to deal with a gap of several decades between historical and instrumental data. For this case, Sturm et al. (2001) have developed a method based on the deviation of the monthly maximum discharge from the mean discharge of a reference period with respect to the standard deviation.
In this paper, we will discuss a long time series for the Waal. Historical records were available up to AD 1800, whereas daily instrumental measurements were initiated in 1770. For the intersection period of 31 years we compared written information and river level data. Based on the neces-sary condition that both kinds of data should give information about the same number of river floods, we thus determined a
Type of Source: chronicles, annals, town chronicles, diaries, calendars
Specification: primary/ secondary numerical/ descriptive
Verification: bibliographical level life data of the author(s) education professional career general circumstances of life
environmental level general Zeitgeist perception of climate and weather
rational identification patterns
level of mental perception
intention and motivation knowledge horizon eyewitness/ contemporaries objectifiable reality
historical and scientific facts, source synopsis technical level
calendar adaptation, reference to a certain locality/ regionalisation source evaluation - climate information
linguistic level
indices
statistical level
statistical basic parameters frequency counts
quantitative climate time series
Quantification:
deduction of semantic profiles classification
time series analysis calibration
.
Fig. 3. Scheme for source criticism (Glaser, 2001).
limiting value for classifying gauge levels as flood events. 2.3 Analyzing flood development
For the graphical presentation of the flood series we chose 31-year running frequencies on the basis of the hydrological year (starting on 1 November). Though this measure exhibits a relatively poor filtration effect (Sch¨onwiese, 1992), it meets the needs of various geoscientific approaches with respect to the commonly used 30-year time span for climatological phases.
Due to the multitude of uncertainties concerning the devel-opment of the processes controlling flood evolution, and due to the lack of a comprehensive model describing the complex interactions between these processes, the discussion of the time series mainly refers to some selected points in a quali-tative way.
For an elementary quantitative discussion, t-test analysis seems to be appropriate (Sch¨onwiese, 1992). For a specific year we considered the flood frequencies of the 30 preceding and the 30 subsequent years to be random samples. Gaussian distribution for each random sample was verified by using the Kolmogorov-Smirnov test (Sch¨onwiese, 1992). As a t-test estimator we get ˆ t = | ¯a − ¯b| √ n q s2 a+sb2 (1)
with n = 30 (number of elements in the random samples) and sa2, sb2variances of the random samples a and b.
608 R. Glaser and H. Stangl: Historical floods in the Dutch Rhine Delta
Table 2. Intensity classification of historical floods (Sturm et al., 2001)
Level Classification Primary Indicators Secondary Indicators
1 smaller, regional flood little damage, e.g. fields and gardens close short flooding to the river, wood supplies that were stored
close to the river are moved to another place
2 above average, or supra-regional, damage to buildings and constructions flood of average duration; severe damage flood related to the water like dams, weirs, to fields and gardens close to the river,
footbridges, bridges and buildings close to loss of animals and sometimes people the river, like mills, etc.; water in buildings
3 above average, or supra-regional, severe damage to buildings and constructions duration of flood: several days or weeks; flood on a disastrous scale related to the water, i.e. dams, weirs, severe damage to fields and gardens close
footbridges, bridges and buildings close to to the river, extensive loss of animals and the river, like mills etc.; water in buildings. people; morphodynamic processes like In part, buildings are completely destroyed sand sedimentation cause lasting damages or torn away by the flood and change the surface structure
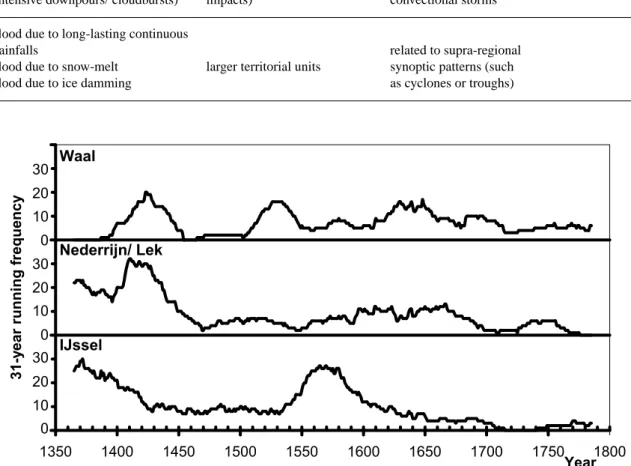
Table 3. Basic types of flood events in Central Europe (after Br´azdil et al., 2002)
flood type spatial scale meteorological causes/ main synoptic situation
flash flood (due to short but local (but often with disastrous connected with heavy precipitation during intensive downpours/ cloudbursts) impacts) convectional storms
flood due to long-lasting continuous
rainfalls related to supra-regional flood due to snow-melt larger territorial units synoptic patterns (such flood due to ice damming as cyclones or troughs)
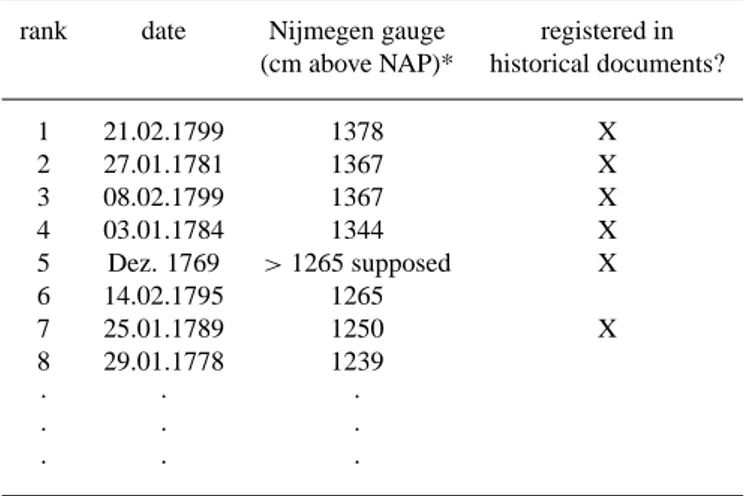
1350 1400 1450 1500 1550 1600 1650 1700 1750 1800 Year 31-y ear runni ng fr equency Waal Nederrijn/ Lek IJssel 0 10 20 30 0 10 20 30 0 10 20 30
For 2n − 2 = 58 DOFs (Degrees of Freedom) and an al-pha level of 1% we get a significance level of t (58; 0.01) = 2.392. Larger estimators, especially very high and narrow peaks in the graph of the estimator function give indication for fracture points in the flood time series, which may be starting-points for further investigations.
2.4 Flood typology in Central Europe
Br´azdil et al. (2002) characterise four basic types of flood events according to their meteorological causes (Table 3). Flash floods are of minor importance for the Dutch Rhine Delta, whereas the three flood types concerning larger terri-torial units have occurred in changing frequency in the past – either in pure form or overlapping one another.
Flooding due to ice damming may be considered as a spe-cial case. During a long period of very low temperatures, es-pecially river reaches with small flow velocities can be cov-ered by ice. This condition is fulfilled in the generally slowly dropping Rhine branches, especially in the transition regions to the tide. From there on, the ice cover could subsequently be extended upstream. A sudden warming, in Central Eu-ropean winters often combined with precipitation from At-lantic air masses, could then lead to the piling up of ice clods at baffles in the river, such as sand banks.
3 Time series and their structure
3.1 Historical floods along Waal, Nederrijn/Lek and IJssel Close to the German-Dutch border near Lobith the bifurca-tion of the Rhine into the Waal and the Pannerden Canal marks the commencement of the Rhine Delta. About ten kilometers further downstream the latter itself branches out into the IJssel and the Nederrijn, in its lower part, after cross-ing the Amsterdam-Rhine-Canal near Wijk bij Duurstede bearing the name Lek. The evolution of the Rhine Delta dur-ing the Holocene has been described by Brunnacker (1978), Woude (1981) and Czaya (1981).
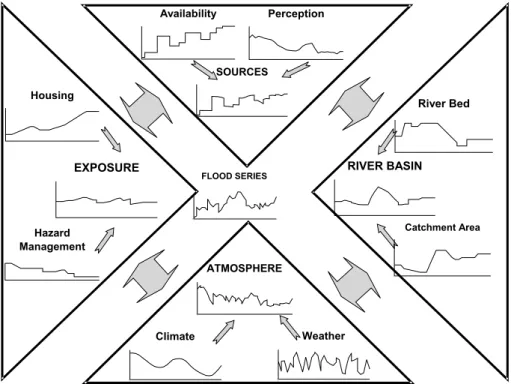
Figure 4 shows the 31-year running frequencies of histor-ical floods on the Waal, Nederrijn/Lek and IJssel (levels 1, 2, and 3, according to the scheme presented in Table 2). On from about 1350 AD, in the case of the Waal proba-bly a few decades later, we may assume a sufficient source availability. First of all, the running frequencies exhibit sig-nificant changes in flood frequencies. For example, along Nederrijn/Lek and Waal, a notable peak is situated around AD 1420, whereas relatively few floods occurred in the sec-ond half of the fifteenth century. Apparently, medium-term increases and decreases within a range of 30 to 100 years were quite common. This finding is remarkable as these de-viations occurred within the period of “natural climate”, i.e. in a time, when humankind did not yet cause global warming. The hydrological regime of all the three Rhine branches is almost exclusively controlled by the discharge of the Lower Rhine. Yet, periods with frequent floods and periods with
Table 4. Flood peak values on the Waal, hydrological years
1770–1800 (source for Nijmegen gauge data: Rijkswaterstaat, http: //www.waterbase.nl)
rank date Nijmegen gauge registered in (cm above NAP)* historical documents?
1 21.02.1799 1378 X 2 27.01.1781 1367 X 3 08.02.1799 1367 X 4 03.01.1784 1344 X 5 Dez. 1769 >1265 supposed X 6 14.02.1795 1265 7 25.01.1789 1250 X 8 29.01.1778 1239 · · · · · · · · ·
few floods did not always occur simultaneously. The reason for this will be discussed in the following chapter.
As explained above, t-test analysis may help us to find the fracture points in the flood series (Fig. 5). The periods within which t-test estimators of all the three Rhine branches sur-pass the significance level may be of special interest with respect to large scala phenomena. For example, this is the case between AD 1385 and AD 1413. While flood risk sig-nificantly increases along the Waal and Nederrijn/Lek within this phase, we have significantly less flood reports for the IJssel in the years following about AD 1410.
3.2 Adhering instrumental data to the Waal series
The comparison of documentary and instrumental data for the Waal exhibits a good conformity (Table 4). The five largest flood peak values have been referred to in historical documents as well. The flood event ranking at number six has not been described, while number seven is included in the records once more. The marginal difference of 15 cm be-tween the latter 2 events might already be due to intra-day fluctuations. Thus we may state that within the time span 1770–1800 in fact large river discharges have been described as floods whereas normal ones have not. A limiting value of 1257,5 cm (mean of the gauge levels of the flood events on rank six and seven) thus seems to be appropriate for classi-fying subsequent events as floods. On this base we classified the daily water levels at the Nijmegen gauge for the years 1801–2001. The relocation of the gauge station in the year 1980 has been considered by an appropriate compensation. Figure 6 shows the resulting flood series.
610 R. Glaser and H. Stangl: Historical floods in the Dutch Rhine Delta 1350 1400 1450 1500 1550 1600 1650 1700 1750 1800 Year t (58; 0,01) IJssel Waal Nederrijn/ Lek 0 4 4 4
Fig. 5. t-test estimators (30 years preceding/30 years following) of flood data.
0 5 10 15 20 25 1350 1400 1450 1500 1550 1600 1650 1700 1750 1800 1850 1900 1950 2000 Year 31-year runni ng fr equency documentary data Nijmegen gauge
Fig. 6. Flood development on the Waal since AD 1350 (source for Nijmegen gauge data: Rijkswaterstaat, http://www.waterbase.nl).
4 Discussion
4.1 Parameters concerning flood series
Flood patterns are subject to a multitude of influences – not only to climatic parameters but also to other geophysical as-pects such as the morphometric structure of the river basin or to social aspects (Fig. 7). The problem of the source effect has already been discussed in Sect. 2.2. Critical source anal-ysis is applied in order to reduce this effect to a minimum. The other aspects illustrated may be of various importance for different river basins. E.g., while land-use changes (such as woodland clearance) may have dramatic effects in small river basins, their effect on the Rhine system with its large catchment area seems to be of minor importance (Kwadijk, 1993).
It is important that these control mechanisms must not be understood unilaterally. Floods themselves influence the structure of the river basin as well as the use of preventive measures and human response, thus exhibiting the main char-acteristics of a feedback operation.
Furthermore, Fig. 7 illustrates a fundamental problem of arranging historic and recent flood data as well as of inter-preting flood series in general. While documentary records are in fact subject to all the parameters illustrated, instrumen-tal data are neither concerned by human flood exposure nor influenced by source effects.
When giving a limiting value for an intersection period of documentary and instrumental data, we therefore have to be aware, that this value has not necessarily been constant in the time preceding the instrumental period, for which we
FLOOD SERIES 0,2 0 RIVER BASIN Catchment Area River Bed SOURCES Availability Perception EXPOSURE Hazard Management Housing ATMOSPHERE 0 0 Climate 0 0 Weather 0 0
Fig. 7. Parameters concerning historic
flood series.
classified the floods due to their effects (Table 2). Knowledge about possible changes would be of fundamental importance for quantifying the other effects illustrated, such as climatic changes.
In addition, developing appropriate filter techniques seems to be of fundamental importance for the comprehensive inter-pretation of flood development.
In the following, we will present some selected aspects to illustrate the complex interactions characterizing flood devel-opment in the Dutch Rhine Delta.
4.2 Floods and the changing structure of the river basin Changes in the catchment area as well as changes along the river itself may be of great influence on the frequency and extents of river floods. In the Netherlands, dike construction – followed by sand sedimentation and damming up of river water – was an important factor (Tol and Langen, 2000; Ven et al., 1995). This can be easily understood in the case of icefloods (which formerly occurred more frequently, see be-low). On the other hand, nowadays, dikes are indispensable means for the protection of the human settlements close to the rivers.
Furthermore, historic storm floods caused great losses of land in the area of river mouths. The displacement of the ero-sion base was followed by significant redistribution of Rhine water between the various branches. Special attention has been given up to this day to the catastrophic “St. Elisabeth’s flood” in AD 1421 (Ven, 1996; Gottschalk, 1975).
Yet, as mentioned above, a fracture point for the flood series is supposed to be situated at least one decade ear-lier. Whether this is due to an opposing climate
develop-ment around the year of “St. Elisabeth’s flood”, to an earlier storm flood event already altering the river flow patterns – Gottschalk (1975) describes two more disastrous events for the years 1404 and 1409 – or for other reasons may not be stated for sure at this point.
After centuries of further storm floods and silting up of Nederrijn/Lek and IJssel, water distribution between the Rhine branches was finally stabilized in the course of the 18th century, especially by the construction of the Panner-den Canal (Urk and Smit, 1989; Ven et al., 1995).
Large scale river regulations and excavations of sand banks were among the elaborative measures implemented in the 19th and 20th centuries, both aiming to improve protec-tion from floods and to ease navigaprotec-tion (T¨ummers, 1994). 4.3 Floods and atmospheric patterns
Of course, there is a significant correlation between floods and the variability of our climate. On different time scales, regular and irregular climatic variations define the conditions under which specific weather situations (pressure, temper-ature, precipitation) lead to the formation of flood events. Glaser (2001) presents a reconstruction of the temperature’s and precipitation’s development within the past millennium based on documentary records.
Our examination of historic flood data led to the suppo-sition that during the second half of the 17th century, that is to say, during a climax period of the Little Ice Age, up to about 70% of flood events in the area of the Rhine Delta might have been in connection with icing (often in combina-tion with precipitacombina-tion and/ or snow melt). That ice floods are of negligible importance nowadays is not only due to
cli-612 R. Glaser and H. Stangl: Historical floods in the Dutch Rhine Delta matic effects, but also to human interventions such as dense
navigation and warming up of the river by industrial cooling water (CHR, 1978; Ven et al., 1995).
4.4 Floods and society
The impact floods have on society is a main aspect of histor-ical flood evidence. Important features are:
– the number of people living in settlements close to the
river
– the strategies developed for managing flood hazards, for
instance warning and protection systems as well as mea-surements taken after the flood
Glaser et al. (2002) drew a multi-layered picture of disaster-perception, disaster-management and vulnerability towards natural disasters for various European rivers. Severe short-ages of food as well as problems with clear drinking wa-ter supply during and until several weeks afwa-ter a flood were among the most serious problems.
This “human dimension” of floods has been of great im-portance in the Netherlands. Tol and Langen (2000) give an extensive description of the course of human settlement and cultivation close to the river, which reached a considerable level as early as the Medieval Optimum. The authors sup-pose connections not only with technical inventions such as the wind mill but also with an early discernment that coop-eration is for the benefit of society and with the early estab-lishment of central governments by the counts of Gelre and Kleve.
Ven et al. (1995) draw a detailed picture of the history of prevention, warning systems, counter measures, and disaster relief operations. In many communities, storage of materials and works to be executed in the case of a disasters were di-rected by legislation. Out of various precursor organizations, in the time of the Batavian Republic, a country-wide, cen-trally organized system of river correspondence was devel-oped. Furthermore, the authors describe donation activities organized by wealthy citizens in large towns in the 18th cen-tury. Historical documents (Gottschalk, 1975) give evidence of food deliveries by adjacent villages that already took place in medieval times. Finally, T¨ummers (1994) refers to a con-nection between the threats by the water and religious orders. These aspects once more stress the fact that it was not only the influence of flood development on society, but also the in-fluence of society on flood development and perception that played an important role in history. Thus, both historic and geoscientific aspects have to be taken into account.
5 Conclusions
Historic documentary sources provide valuable information about climate and its extremes, which we can transform into semi-quantitative information by applying historical and sta-tistical methods. Critical source analysis is therefore of ma-jor importance. In the field of river floods, the comparably
high temporal and spacial resolution proved to be a special benefit.
It became clear that river floods in Central Europe have always happened, and that the appearance of these disasters drastically changed during the past 700 years. By looking at these phases, we have to assume that during some periods and in some regions floods occurred more frequently than during the past two centuries. On the other hand, in some regions, recent flood development seems to be unique within the reconstruction period. This might be in connection with the phenomena of man-made global warming.
But we have to be careful with such a supposition. The reason for this is that, in addition to atmospheric parameters, flood evolution is subdued to a multitude of parameters. Of special interest is the “human dimensions” of floods. Histori-cal documents provide broad information about the historiHistori-cal perception and management of natural disasters.
In order to apply high-quality filtration techniques, both in the fields of modelling and of data acquisition, further re-search is necessary to get a comprehensive understanding of past flood development. We consider the presented time se-ries and their elementary discussion as a first step towards this direction.
References
Alexandre, P.: Le climat en Europe en Moyen Age, Ed. de L’Ecole des Hautes Etudes en Sciences Soc., Paris, 1987.
Br´azdil, R., Glaser, R., Pfister, C., Antoine, J. M., Barriendos, M., Camuffo, D., Deutsch, M., Enzi, S., Guidoboni, E., and Ro-drigo, F. S.: Flood events of selected rivers of Europe in the Sixteenth Century, in: Climatic Variability in Sixteenth Century Europe and its Social Dimension, edited by Pfister, C., Br´azdil, R., and R. Glaser, Kluwer, Dordrecht, 239–285, 1999.
Br´azdil, R., Glaser, R., Pfister, C., and Stangl, H.: Floods in Europe – A Look into the Past, PAGES News, 10 (3), 21–23, 2002. Brunnacker, K.: Der Niederrhein im Holoz¨an, Fortschritte der
Ge-ologie Rheinland und Westfalen, 28, 399–440, 1978.
CHR (Commission Internationale de l’Hydrologie du Bassin du Rhin) (Ed.): Le Bassin du Rhin, 3 vols., 1978.
Corsten, S.: Anmerkungen zur mittelalterlichen Geschichte von Ue-dorf, Bonner Geschichtsbl¨atter, 49/50, 2001.
Czaya, E.: Str¨ome der Erde, Aulis, K¨oln, 1981.
Glaser, R.: Klimageschichte Mitteleuropas, 1000 Jahre Wetter, Klima, Katastrophen, Wiss. Buchgesellschaft, Darmstadt, 2001. Glaser, R., Jacobeit, J., Deutsch, M., and Stangl, H.: Hochw¨asser
als historisches Ph¨anomen, in: Katastrophe oder Chance? Bay-erische Akademie der Wissenschaften (Ed.), Hochwasser und
¨
Okologie, Pfeil, M¨unchen, 2002.
Glaser, R. and Stangl, H.: Climate And Floods In Central Europe Since A.D. 1000: Data, Methods, Results And Consequences, Surveys in Geophysics, revised.
Gottschalk, M. K. E.: Storm floods and river floods in the Nether-lands, van Gorcum, Assen, 3 vols., 1971–1977.
IPCC (Intergovernmental Panel on Climate Change) and Mc-Carthy, J.: Climate Change 2001: Impacts, Adaptation and Vul-nerability, contribution of Working Group II to the third assess-ment report of the Intergovernassess-mental Panel on Climate Change, Cambridge Univ. Press, Cambridge, 2001.
Kwadijk, J.: The impact of climate change on the discharge of the River Rhine, Nederl. Geogr. Studies, 171, Utrecht, 1993. Mendel, H. G., Fischer, P., and Hermann, A.: Hochwasser –
Gedanken ¨uber Ursachen und Vorsorge aus hydrologischer Sicht, Bundesanst. f¨ur Gew¨asserkunde, Koblenz, 1997.
Munzar, J.: Summer floods in Central Europe in 1813 – an Analogy to Floods of 1997, Moravian Geographical Reports, 9 (2), 29–40, 2001.
Pfister, C.: Klimawandel in der Geschichte Europas, Zur Entwick-lung und zum Potenzial der Historischen Klimatologie, ¨OZG, 12 (2), 7–43, 2001.
P¨ortge, K. H. and Deutsch, M.: Hochwasser in Vergangenheit und Gegenwart, in: Dynamik von Flora und Fauna – Artenvielfalt und ihre Erhaltung, Bayerische Akademie der Wissenschaften (Ed.): Pfeil, M¨unchen, 139–151, 2000.
Sch¨onwiese, C.-D.: Praktische Statistik f¨ur Meteorologen und Ge-owissenschaftler, Borntraeger, Berlin, 1992.
Sturm, K., Glaser, R., Jacobeit, J., Deutsch, M., Br´azdil, R., and Pfister, C.: Floods in Central Europe since AD 1500 and their Relation to the Atmospheric Circulation, PGM, 148 (6), 18–27, 2001.
Tetzlaff, G., B¨orngen, M., and Raabe, A.: Das Jahrtausend-hochwasser von 1342 und seine meteorologischen Ursachen,
in: ATV-DVWK Landesverband Bayern (Ed.): Hochwasser-Niedrigwasser-Risiken, Hirthammer, M¨unchen, 5–22, 2001. Tol, R. S. J. and Langen, A.: A concise history of Dutch river floods,
Climatic change, 46 (3), 357–369, 2000.
T¨ummers, H. J.: Der Rhein, ein europ¨aischer Fluß und seine Geschichte, Beck, M¨unchen, 1994.
Urk, G. van and Smit, H.: The Lower Rhine, Geomorphological Changes, in: Historical changes of large alluvial rivers, Western Europe, edited by Petts, G. E., M¨oller, H. and Roux, A. L., Wiley, Chichester, 1989.
Ven, G. P. van de: Leefbaar laagland: geschiedenis van de water-beheersing en landaanwinning in Nederland, Matrijs, Utrecht, 1996.
Ven, G. P. van de, Driessen, A. M. A. J., Wolters, W., and Wasser, J.: Niets is bestendig..., De geschiedenis van de rivieroverstromin-gen in Nederland, Matrijs, Utrecht, 1995.
Weikinn, C.: Quellentexte zur Witterungsgeschichte Europas von der Zeitwende bis zum Jahre 1850, Akedemie-Verl., Berlin, 1–4, 1958–1963.
Woude, J. D. van der: Holocene palaeoenvironmental evolution of a perimarine fluviatile area, Vrije Universiteit Amsterdam, Thesis, 1981.


![[PDF] Cours sur Le concept d'AJAX en PDF | Cours informatique](data:image/gif;base64,R0lGODlhAQABAIAAAP///wAAACH5BAEAAAAALAAAAAABAAEAAAICRAEAOw==)