HAL Id: hal-02282820
https://hal.archives-ouvertes.fr/hal-02282820
Submitted on 16 May 2020
HAL is a multi-disciplinary open access
archive for the deposit and dissemination of
sci-entific research documents, whether they are
pub-lished or not. The documents may come from
teaching and research institutions in France or
abroad, or from public or private research centers.
L’archive ouverte pluridisciplinaire HAL, est
destinée au dépôt et à la diffusion de documents
scientifiques de niveau recherche, publiés ou non,
émanant des établissements d’enseignement et de
recherche français ou étrangers, des laboratoires
publics ou privés.
in levels and patterns over the last 40 years
B. Mourier, P. Labadie, Marc Desmet, Cécile Grosbois, Julie Raux, Maxime
Debret, Yoann Copard, P. Pardon, H. Budzinski, M. Babut
To cite this version:
B. Mourier, P. Labadie, Marc Desmet, Cécile Grosbois, Julie Raux, et al.. Combined spatial and
retrospective analysis of fluoroalkyl chemicals in fluvial sediments reveal changes in levels and
pat-terns over the last 40 years.
Environmental Pollution, Elsevier, 2019, 253 (253), pp.1117-1125.
�10.1016/j.envpol.2019.07.079�. �hal-02282820�
Combined spatial and retrospective analysis of fluoroalkyl chemicals in fluvial
1
sediments reveal changes in levels and patterns over the last 40 years
2
3
4
Mourier B.1, Labadie P.2, Desmet M.3, Grosbois C.3, Raux J.3, Debret M.4, Copard Y.4, Pardon P.2, Budzinski
5
H.2 and Babut M.5
6
7
1 Univ Lyon, Université Claude Bernard Lyon 1, ENTPE, CNRS, INRA, USC 1369, UMR5023 LEHNA,
F-8
69518, Vaulx-en-Velin, France
9
10
2 UMR 5805 EPOC, Université de Bordeaux I, 351 crs de la libération, F-33405 Talence
11
12
3 Université de Tours, EA 6293 GéHCO, Parc de Grandmont, F-37200 Tours
13
14
15
4 UMR 6143 – M2C, Université de Rouen, Place E. Blondel, Bat. IRESE A, F-76821 Mont St Aignan
16
17
5 IRSTEA, RIVERLY Research Unit, Lyon-Villeurbanne Center, 5 avenue de la Doua – CS 20244, F-69625
18
Villeurbanne Cedex19
20
21
22
23
24
25
Research Highlights
26
1 - Upstream-downstream PFAS concentration gradient in bed sediments in the Rhône River
27
2- Reconstruction of temporal trends of PFAS contamination using a sediment core
28
3- Evidence of global PFSA background levels
29
4- Release of long-chain PFCAs from a point source into the river
30
5- Change of PFCA pattern through time likely reflects changes in production processes
31
32
Abstract
33
Bed sediments and a dated sediment core were collected upstream and downstream from the city of Lyon
34
(France) to assess the spatial and temporal trends of contamination by per- and polyfluoroalkyl substances
35
(PFASs) in this section of the Rhône River. Upstream from Lyon, concentrations of total PFASs (PFASs) in
36
sediments are low (between 0.19 and 2.6 ng g-1 dry weight - dw), being characterized by a high proportion of
37
perfluorooctane sulfonate (PFOS). Downstream from Lyon, and also from a fluoropolymer manufacturing plant,
38
PFASs concentrations reach 48.7 ng g-1 dw. A gradual decrease of concentrations is reported at the coring
39
site further downstream (38 km). Based on a dated sediment core, the temporal evolution of PFASs is
40
reconstructed from 1984 to 2013. Prior to 1987, PFASs concentrations were low (≤ 2 ng g-1 dw), increasing
41
to a maximum of 51 ng g-1 dw in the 1990s and then decreasing from 2002 to the present day (~10 ng g-1 dw).
42
In terms of the PFAS pattern, the proportion of perfluoroalkyl sulfonic acids (PFSAs) has remained stable since
43
the 1980s (~10%), whereas large variations are reported for carboxylic acids (PFCAs). Long chain- (C>8)
44
PFCAs characterized by an even number of perfluorinated carbons represent about 74% of the total PFAS
45
load until 2005. However, from 2005 to 2013, the relative contribution of long chain- (C>8) PFCAs with an odd
46
number of perfluorinated carbons reaches 80%. Such changes in the PFAS pattern likely highlight a major
47
shift in the industrial production process. This spatial and retrospective study provides valuable insights into
48
the long-term contamination patterns of PFAS chemicals in river basins impacted by both urban and industrial
49
activities.50
51
Keywords
52
Per- and polyfluoroalkyl substances, Rhône River, bed sediment, sediment core, temporal trend, spatial trend
53
54
Capsule
55
56
An extended spatial and temporal survey of PFAS chemicals in sediments provided valuable insights into the
57
long-term contamination patterns in river basins impacted by both urban and industrial activities.
1. Introduction
59
Over the past 50 years, per- and polyfluoroalkyl substances (PFASs) have been widely used in the production
60
of fluoropolymer processing additives and surfactants in industrial processes, as well as in fire-fighting foams
61
and many consumer applications (Paul et al., 2009; Prevedouros et al., 2006). Owing to their unique properties
62
and widespread applications, some PFASs are ubiquitously distributed in the aquatic environment (Ahrens,
63
2011; Ahrens and Bundschuh, 2014; Wang et al., 2015) and biota (Giesy and Kannan, 2001; Houde et al.,
64
2011; Houde et al., 2006). This raises some concerns about the hazards PFASs might pose to wildlife or
65
human health (Borg et al., 2013; Kannan, 2011; Naile et al., 2010; Peng et al., 2010). For PFASs currently
66
observed in the environment, such as perfluorooctane sulfonate (PFOS) and perfluorooctanoate (PFOA),
67
sources include direct and indirect emissions (Prevedouros et al., 2006) as well as degradation of precursors
68
(Stock et al., 2007; Wang et al., 2009). Sediments are identified as the ultimate sink (Prevedouros et al., 2006)
69
for PFAS having eight carbon atoms or more. Accordingly, many authors have reported the occurrence of
70
PFASs in sediments from marine/coastal systems (e.g. (Loi et al., 2013; Theobald et al., 2011; Thompson et
71
al., 2011), lakes (e.g. (Clara et al., 2009; Guo et al., 2016; Zhou et al., 2012) or rivers (e.g. (Möller et al., 2010;
72
Munoz et al., 2017b; Wang et al., 2013). Sediment cores allowing the assessment of temporal trends have
73
been studied in several contexts, such as Tokyo Bay (Ahrens et al., 2009b; Zushi et al., 2010), or in Chinese
74
urban rivers such as the Guangzhou and Huangpu (Bao et al., 2010) or the Haihe River (Zhao et al., 2014).
75
These studies reported different temporal trends, with a decline of “legacy” PFASs (i.e. PFOS) since the late
76
1990s (Ahrens et al., 2009b) or earlier (Zushi et al., 2010), while other compounds such as
77
perfluoroundecanoate (PFUnDA) are still increasing. There is no consistent trend in Haihe river sediments,
78
although PFOS concentrations are higher at the top of the cores than in deeper layers (Zhao et al., 2014),
79
while cores from Guangzhou and Huangpu rivers both reveal increasing concentrations of PFOS and some
80
perfluorocarboxylic acids (PFCAs) in the upper part of the sediment columns (Bao et al., 2010).
81
The Rhône is one of the largest rivers in France and represents a critical resource for agriculture and drinking
82
water production. In Southeastern France, a peculiar PFAS molecular profile, dominated by long-chain PFCAs,
83
is observed in fish (Miège et al., 2012) and sediments (Munoz et al., 2015) downstream from Lyon. This pattern
84
is likely explained by an industrial source (Dauchy et al., 2012; Munoz et al., 2015).
85
In this context, the present study aims first to assess the spatial trends in PFAS contamination from surface
86
sediments collected in the hydrological network around the city of Lyon, in order to identify and rank the current
PFAS sources in this urban-industrial area. Then, the time trends of PFAS levels and patterns downstream of
88
the conurbation are reconstructed though the analysis of a sediment core.
89
90
2. Material and methods
91
2.1 Study area
92
The Rhône is one of the major rivers of Europe, with a length of 810 km and a catchment area of 97 800 km2
93
and showing a remarkable climatic and geological diversity (Pekarova et al., 2006; Desmet et al., 2005). The
94
mean daily discharge is 1 030 m3 s-1 (1966 to 2014) downstream from its confluence with the Saône River.
95
Along its course in French territory, the Rhône has been intensively engineered since the end of the 19th
96
century, with numerous embankments, groynes and 19 dams that have been implemented for purposes of
97
navigation, flood protection or hydroelectric production (Bravard et al., 1999). These widely-developed
98
anthropogenic pressures have profoundly modified the hydrology and geomorphology of the Rhone valley. In
99
addition, the Rhone passes through many urban areas and industrial zones representing localized and
100
potential sources of contamination.
101
The study area was chosen to evaluate the spatial distribution and temporal trends of PFAS-contaminated
102
sediments upstream and downstream of the Lyon metropolitan area (Fig. 1). Sediment collection sites are
103
located in the Rhône valley upstream of the Rhône-Saône confluence, in the Saône River upstream of the
104
confluence and along a longitudinal transect of about 38 km downstream from the Rhône-Saône confluence.
105
This area covers the industrial corridor extending to the south of the city of Lyon, as well as several tributaries:
106
the Ain, Bourbre and Gier. Two potential point sources of PFASs within the studied area (Fig. 1) are
107
represented by the waste water treatment plant (WWTP) at Saint-Fons, which was seriously under-capacity
108
until the beginning of the 2010s, and a fluoropolymer manufacturing plant that has produced various fluorinated
109
polymers including polyvinylidene fluoride (PVDF) since the 1980s (Dauchy et al., 2012).
110
111
2.2 Sampling of surface sediments and flood deposits
112
Twenty-five samples of surface sediments were collected in July 2013 along an upstream-downstream
113
gradient that takes into account the main Rhône tributaries and industrial areas. Table S-1 reports the
114
geographic coordinates of sampling points as well as some field notes. Fresh flood deposits were taken from
115
the riverbank using a stainless steel scoop, and supplemented by bed sediment sampling using an Eckman
116
grab. Immediately after sampling, the samples were packaged and transported to the laboratory in an
cooled box. In the laboratory, the samples were stored at -20°C, freeze-dried, sieved to 2 mmwith a stainless
118
steel mesh, packaged in amber glass vials and stored at room temperature until further analysis.
119
120
2.3 Sediment core collection and characterization
121
The coring site is located in a backwater area adjacent to the Rhône River, 38 km downstream from the
Saône-122
Rhône confluence (Fig. 1). Before 1977, the side channel was not connected to the Rhône River due to river
123
infrastructures that were implemented for navigation. After 1977, the construction of the Vaugris dam located
124
a few kilometers downstream raised the water level and, in 1984, removal of the debris dam allowed the
125
connection of this channel with the Rhône at its upstream end. Thus, depending on the period, the water body
126
was connected to the main channel via its upstream and downstream ends, or solely at its downstream end.
127
128
A sediment core was sampled in June 2013 using a Uwitec gravity corer using a 2-m liner with a diameter of
129
63 mm operated from a specially adapted river boat (e.g. quadriraft). By means of an extension rod and
130
weights, the corer is first gently pushed into the sediment, and then hammered until it meets resistance. Once
131
extracted, the core is immediately conditioned in the dark and in an ice-cool box, and brought back to the
132
laboratory the same day. The core was first visually described and then cut up at 3-cm intervals using a clean
133
stainless steel slicer. The identified sandy layers were sampled in their entirety, and then attributed to
flood-134
events or reconnection works on the backwater area. The separated samples were homogenized and then
135
stored in polypropylene (PP) tubes. All samples were stored at -20°C, freeze-dried, subsequently sieved to 2
136
mm with a stainless steel mesh, packaged in amber glass vials and stored at room temperature until further
137
analysis.
138
The grain-size distribution of the sediment core was determined with a Mastersizer 3000® laser particle size
139
analyzer fitted with a Hydro SM small-volume dispersion unit. Percentage of particle size classes and
140
parameters of grain size distribution were determined for each depth interval according to (Blott and Pye,
141
2001). Rock-Eval 6 pyrolysis was used to determine the Total Organic Content (TOC). This thermal
142
degradation method consists of pyrolysis of a previously crushed sample, in an oven within a temperature
143
range from 200 to 650°C, following by oxidation at 400-750°C of the pyrolysed carbonaceous residue. Each
144
step provides an amount of OC which contributes to the cumulative TOC content of the sample (expressed in
145
wt.%), see (Lafargue et al., 1998).
146
Sediment core samples were analysed for radionuclides at USGS, Menlo Park (CA, USA). Except for the three
largest sandy layers (bottom of the core), each sample was analysed for 226Ra, 210Pb, and 137Cs using gamma
148
spectrometry by counting for at least 24 h. Abrupt changes in grain-size identified in the cores were matched
149
to flood discharges measured at the nearest streamflow-gauging station (Ternay, Fig. S1) or to changes
150
following river-management operations to restore connection with the Rhône.
151
152
2.4 Chemicals
153
Certified standard solutions of analytes and internal standards (ISs) were purchased from Wellington
154
Laboratories (via BCP Instruments, Irigny, France). Full details on the respective standard compositions are
155
provided in the SI (section 3). Table S2 presents the list of analysed compounds, and their respective acronyms
156
and ISs. Note that, unless otherwise stated, the PFOS concentrations presented below correspond to the sum
157
of linear and branched isomers.
158
159
2.5 Extraction and Analysis of PFASs
160
Sediment samples (1 g dry weight, dw) were spiked with ISs and extracted by microwave-assisted extraction
161
with methanol (5 min at 70°C) using a Start E Milestone system (Munoz et al., 2017a). Extracts were filtered
162
through a polyethylene frit (20 µm) and concentrated to 1 mL under a nitrogen stream. Extracts were
163
subsequently cleaned up using SuperClean Envi-Carb cartridges (250 mg, 6cc, Supelco, St Quentin Fallavier,
164
France), the aliquots being taken down to 300 μL and then stored at -20 °C until further analysis.
165
The analysis of PFASs was performed by high-performance liquid chromatography coupled with tandem mass
166
spectrometry (LC-MS/MS) using an electrospray ionization source (for full details, see Munoz et al., 2015).
167
168
2.6 Quality control
169
PFAS recovery rates were determined using sediment sample aliquots fortified at 2 ng g-1. Actual recovery
170
rates were determined by subtracting the analyte levels found in unspiked samples from the levels
171
experimentally determined in the corresponding spiked samples, and were in the range 65–115 %. Procedural
172
blanks (i.e. 10 mL of MeOH) were analysed for each samples batch (n=5). The most recurring analytes are
173
PFHxA and PFOA, which are systematically detected in procedural blanks (0.15 ± 0.25 and 0.18 ± 0.04 ng,
174
respectively). For these two compounds, the reporting limits are calculated as the standard deviation of blanks
175
multiplied by the tn-1.95 student coefficient, where n is the number of blanks (Muir and Sverko, 2006). For
analytes undetected in blanks, the detection limit is defined as the concentration yielding a signal-to-noise ratio
177
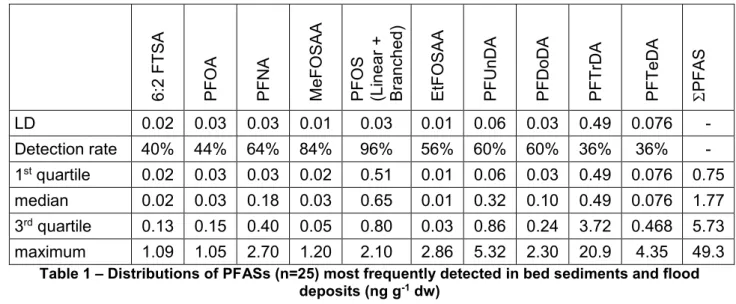
of 3 (Table 1). Limits of detection (LDs) are generally around 0.02 – 0.03 ng g-1 (dw, dry weight).
178
179
2.7 Statistics
180
We used Pro-UCL 5.0 software (U.S. Environmental Protection Agency) to determine compound distributions
181
accounting for left-censored results. A Mann-Whitney test was applied to compare contamination levels
182
between groups. The significance threshold was set at 0.05 in all analyses.
183
184
3. Results
185
3.1 Spatial trends of bed sediment contamination
186
The detection rates of the 22 PFASs in bed sediment samples range from 0% for PFHxS and PFHpS, to 84%
187
for MeFOSAA and 96 % for PFOS. Among the PFCAs, the most frequently detected compounds are PFOA
188
(44%), PFNA (64%), PFUnDA and PFDoDA (60% each), and PFTrDA and PFTeDA (36% each). Short-chain
189
PFCAs (i.e. PFBA, PFPeA and PFHxA) were only detected at site R4, just downstream from the fluoropolymer
190
manufacturing plant. Table 1 reports the respective concentration ranges of the most frequently detected
191
compounds. The full dataset of compound concentrations are provided in the SI table.
192
193
6:2
FT
S
A
P
FOA
P
FN
A
M
eF
O
S
A
A
P
FOS
(Li
ne
ar
+
B
ran
che
d)
E
tFOSA
A
P
FU
nD
A
P
FD
oD
A
P
FT
rD
A
P
FT
eD
A
P
FA
S
LD
0.02 0.03 0.03 0.01
0.03
0.01 0.06 0.03 0.49 0.076
-
Detection rate
40% 44% 64% 84%
96%
56% 60% 60% 36%
36%
-
1
stquartile
0.02 0.03 0.03 0.02
0.51
0.01 0.06 0.03 0.49 0.076 0.75
median
0.02 0.03 0.18 0.03
0.65
0.01 0.32 0.10 0.49 0.076 1.77
3
rdquartile
0.13 0.15 0.40 0.05
0.80
0.03 0.86 0.24 3.72 0.468 5.73
maximum
1.09 1.05 2.70 1.20
2.10
2.86 5.32 2.30 20.9
4.35
49.3
Table 1 – Distributions of PFASs (n=25) most frequently detected in bed sediments and flood
194
deposits (ng g-1 dw)
195
196
The molecular profiles in bed sediment sharply changes from upstream to downstream of site R4: for instance,
197
detection rates of 6:2 FTSA, PFNA and PFTrDA increase from 0% to 69 %, from 18 % to 100%, and from 0%
198
to 61%,respectively. PFOS detection rates are not affected, while MeFOSAA and EtFOSAA show a moderate
variation, with detection rates of 72.7% to 92.3% and 45.5% to 61.5%, respectively. The respective proportions
200
of compounds are quite different between river stretches (Fig. S2). PFOS is predominant in the Saône River
201
sediments (Fig. S2-A), as well as in other tributaries (Fig. S2-B in SI). Some PFCAs, i.e. PFNA, PFUnDA and
202
PFDoDA, are present in moderate proportions in some samples from the tributaries (S2, B1, G1), but not in
203
samples from the Rhône River upstream of site R4, except in one case where the PFCAs, in particular
long-204
chain PFCAs (N perfluorinated C atoms ≥ 8), as well as PFDoDA, are predominant downstream from site R4
205
(Fig. S2-D in SI). These compounds represent 99 to 100% of PFCAs at all sites, except at R4, which is the
206
only site where short-chain carboxylates were detected as mentioned above. Meanwhile, as shown on Fig. 1,
207
PFCA concentrations increase significantly from up- to downstream of R4, even when this site is ignored as
208
an outlier. Conversely, the concentrations of PFOS and its precursors remain similar (Mann-Whitney, p-value
209
= 0.95), despite locally higher concentrations at sites R4 and R5 (Fig. S3 in SI). PFCA concentrations tend to
210
decrease gradually downstream from site R4 to site R9, although not linearly. This is probably a consequence
211
of complex hydro-sedimentary processes along the investigated river stretches (Fig. 1, Fig. S4 in SI). In
212
addition, 6:2 FTSA is undetected upstream from site R4 (Fig. S2-C), while it is generally detected in Rhône
213
River bed sediments downstream from this site (concentrations ranging between 0.02 and 1.09 ng g-1 dw), but
214
not in samples from the Gier river: this strongly suggests the existence of a local source close to site R4.
215
216
217
218
219
Figure 1 – PFAS contamination of sedimentary deposits (ng g-1 dw) collected in the drainage network
220
of the Lyon area (France). To simplify the data presentation, PFOS precursors and 6:2 FTSA are
221
grouped into perfluoroalkyl acid (PFAA) precursors. Blue segments represent the sum of PFSAs and
222
PFAA precursors; orange segments correspond to the sum of PFCAs. When several samples are
223
available for a given site, we use the arithmetic mean of the respective measurements.
224
225
In a few cases, several kinds of sediment sample (i.e. dry deposits, wet deposits or bed sediments) are
226
available from the same location. These samples provide similar records of
PFASs contamination, except at227
site R5.2, where there is a discrepancy of 5 ng g-1 in
PFASs concentrations on a dry weight basis between228
wet and dry deposits (Fig. S5 in SI).
229
In summary, this survey shows (i) multiple sources of PFSAs and PFOS precursors along the investigated
230
river stretches, (ii) a local discharge of both short-chain (PFHxA) and long-chain (PFNA, PFUnDA, PFTrDA)
231
PFCAs related to a fluoropolymer production platform, as well as (iii) another local discharge of 6:2 FTSA,
Me-232
FOSAA and Et-FOSAA, probably from a WWTP.
233
234
3.2 Sediment core
235
3.2.1 Core description and characterization
236
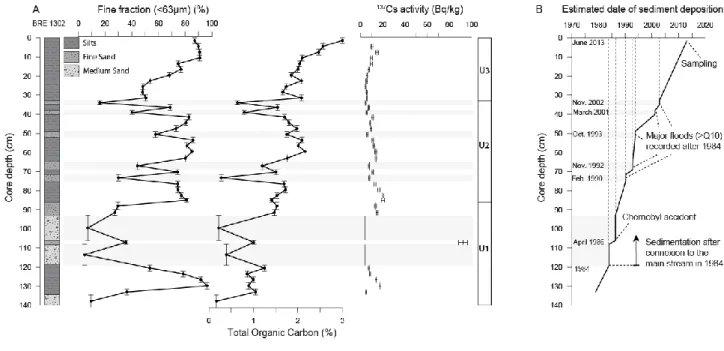
The 140-cm sediment core is characterized in terms of its visual description, grain-size distribution and TOC
237
content. The sediment consists of light-grey sand in the lower part of the core and homogenous brown silt
238
interrupted by event-layers in the upper part. Three sedimentary units are distinguished (Fig. 2). The bottom
239
unit (Unit I) includes three thick sandy intervals at 93-106 cm, 108-119 cm and 134.5-141 cm (D50 of 337, 366
240
and 444 µm, respectively). These deposits have a low TOC content (<0.5%). Between 119 and 134.5 cm, the
241
sediments are uniformly fine-grained with TOC contents close to 1%. An increase of fine particles and TOC
242
content is observed between 86 and 93 cm. Unit II includes silty deposits (D50 of 18.8 ± 4.0 µm) interrupted
243
by 5 layers characterized by their coarser grain size (D50 of 151.5 ± 87.2 µm). The TOC content is 1.8 ± 0.2%
244
in the silty deposits, whereas it drops to 0.9 ± 0.8% in coarser layers. The uppermost unit (Unit III) includes
245
silty deposits with grain size decreasing upward. Finally, the TOC content ranges between 1.6 and 2% at the
246
bottom of Unit III and is marked by an increase to almost 3% at the top of the core.
247
248
3.2.2 Dating
249
The date of deposition of the sediments is estimated on the basis of the 137Cs profile and by correlating changes
250
in grain-size distribution in the sediment cores to the timing of flood events as well as major changes at the
251
site (Fig. 2). The radionuclide profile of the core yields a calibrated date at 107 cm (Fig. 2), corresponding to
252
the 137Cs fallout resulting from the Chernobyl accident in 1986 (Anspaugh et al., 1988). The sudden change in
253
grain-size distribution in U1, associated with the occurrence of two thick sandy layers, is interpreted as
254
corresponding to debris removal works carried out in 1984 which re-established the connection to the Rhône
255
as already shown by Desmet et al. (2012). This event is consistent with the radionuclide profile. Flood-event
256
deposits are matched to flood discharges measured at the nearest streamflow-gauging station (Ternay, Fig.
257
S1-A). Five major flood events (defined as Q10>4200 m3 s-1) identified in the core are dated in the early 1990s
258
and 2000s (Fig. S1-B). Since November 2002, no major flood has been recorded at the Ternay station. By
259
matching dated flood facies with removal work facies and the 137Cs peak, an age-depth model can be
260
calculated, assuming a constant deposition rate between two successive date markers. Prior to 1984, we
261
assume that this site was not directly connected to the Rhône River.
262
263
264
265
Fig. 2. A/ Profiles of fine fraction (<63 µm), total organic carbon (TOC, %) and 137Cs activity (Bq/kg) in
266
BRE1202 sediment core. B/ Date of sediment deposition estimated on the basis of 137Cs profile and
267
variations in grain size matched with flood events and works for reconnection to the river.
268
269
3.2.3 PFAS concentrations and molecular patterns
270
Figure 3 shows the temporal trends of PFASs in the sediment core and the full dataset of compound
271
concentrations are provided in the SI. Values are expressed in terms of dry weight as well as on a
TOC-272
normalized basis since Organic Carbon (OC) is a major factor affecting PFAS sorption onto sediments (Higgins
273
and Luthy, 2006 ; Munoz et al., 2015).
274
Five compounds are detectedamong the sulfonates and PFOS precursors: PFOS, FOSA, MeFOSA, EtFOSA
275
as well as 6:2 FTSA. Their frequency of detection (or detection rate) ranges from 85 to 100 %. The maximum
276
concentration of PFOS and its precursors was attained between 1988 and 2002 (maximum concentration of
277
2.3 ng g-1 dw or 134.3 ng g-1 OC at the end of 1993); a similar trend is observed for 6:2 FTSA, with a maximum
278
concentration of 0.88 ng g-1 dw (or 43.6 ng g-1 OC) in the sediment layer deposited in 1993. In terms of
279
compound profiles, the maximum relative contribution of sulfonates and PFOS precursors is observed before
280
1988, accounting for 10–60% of ΣPFASs. In the 1988– 2013 sediment interval, the relative contribution of the
281
same compounds lies in the range 4 –15%.
282
Ten PFCAs can be detected in the sediment core samples. In sediments deposited before 1988, the detection
283
frequencies range from 0 to 36%, with exceptions for PFPeA (100%), PFDA (82%) and PFDoDA (91%).
284
Nevertheless, the detection rates for all samples are relatively high and range between 75 and 98 %, except
285
for short-chain PFCAs such as PFHxA (30%), PFHpA (58 %) and PFOA (43. In addition, PFOA and PFHpA
286
show a maximum frequency of detection between 1988 and 2003, while PFPeA is detected in 98% of samples
287
in sediment layers deposited over this time interval. The maximum concentration for PFCAs is recorded in
288
1993 for 6 compounds (PFHpA, PFOA, PFNA, PFDA, PFDoDA and PFTeDA), and this sediment interval also
289
coincides with the maximum concentration ofΣPFASs (51.4 ng g-1 dw or 2459 ng g-1 OC). PFHxA, PFUnDA
290
and PFTrDA reach their maximum levels in the most recent layers (2010s).
291
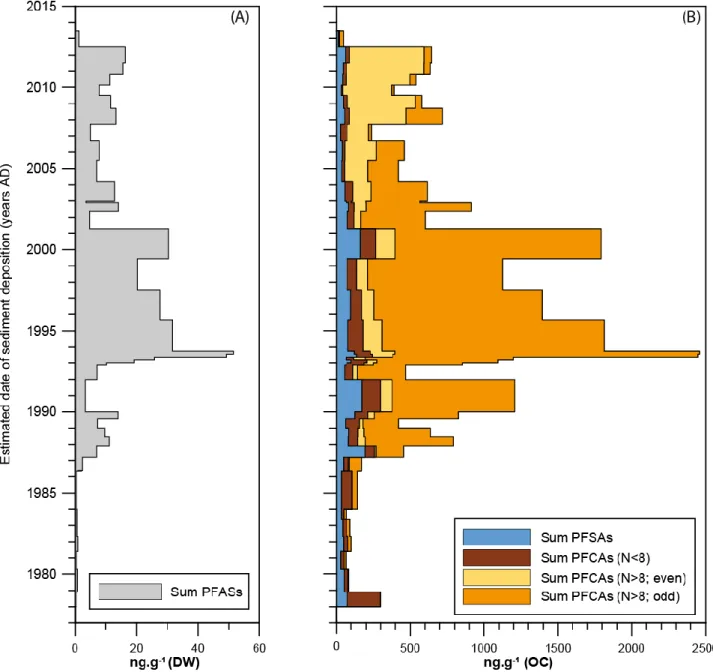
When considering the three sedimentary units described above, the following conclusions can be drawn:
292
(i) Unit 1 – (< 1988): the average concentration of ΣPFASs is 3.4 ± 4.0 ng g-1 dw and is dominated by
293
carboxylates (PFPeA, PFOA and PFDA) and 6:2 FTSA, while the contribution of PFOS is lower than 8%;
294
(ii) Unit 2 (1988-2003): the average concentration of ΣPFASs is 20.3 ± 15.1 ng g-1 dw. The PFAS molecular
295
pattern is dominated by long-chain PFCAs, especially compounds with an odd fluorinated carbon number
296
(PFDA, PFDoDA and PFTeDA) which conjointly account for 59 – 85% of ΣPFASs;
297
(iii) Unit 3 (2003-2013): the average concentration of ΣPFASs is 9.8 ± 4.7 ng g-1 dw and is lower than in unit
298
2. The PFAS molecular pattern is still dominated by long-chain PFCAs, but a rapid decrease is observed in
the relative abundances of long-chain PFCAs with an odd fluorinated carbon number, while long-chain PFCAs
300
with an even fluorinated carbon number progressively become predominant (e.g. PFUnDA and PFTrDA
301
account for up to 75 % of ΣPFASs in the most recent sediment layers).
302
303
Figure 3 Temporal evolution of the total concentration of PFASs (A) and OC-normalized
304
concentrations of four PFASs groups (B): sum of PFSAs and PFOS precursors (6:2 FTSA included);
305
sum of short-chain PFCAs; sum of long-chain PFCAs with an even number of perfluorinated carbon
306
atoms; sum of long-chain PFCAs with an odd number of perfluorinated carbon atoms.
307
308
4. Discussion
309
4.1 PFAS sources310
In terms of PFAS levels, there is a clear spatial trend between sediments collected upstream and downstream
311
of industrial and urban areas of the city of Lyon. PFOA and PFOS distributions appear similar to those observed
312
in other urban/industrialized regions (e.g. (Bečanová et al., 2016; Myers et al., 2012; Zhao et al., 2014), while
313
long-chain PFCAs (especially PFUnDA, PFDoDA, PFTrDA and PFTeDA) display unusually high levels and
314
relative abundances at site R4 and further downstream, as already noted by Dauchy et al. (2012) and Munoz
315
et al.(2015). 6:2 FTSA is not detected in sediments upstream from site R4, while it is found in most samples
316
collected downstream. Together with other potential precursor degradation products (e.g. MeFOSAA and
317
EtFOSAA), this compound has been frequently identified downstream of WWTPs (Ahrens et al., 2009a) or
318
industrial plant (Dauchy et al., 2017).
319
We therefore conclude that PFASs contamination in the upstream part of the study area results from a complex
320
combination of multiple point and non-point sources. The molecular patterns observed in this area are similar
321
to those previously reported in a wide variety of settings across French fluvial systems (Munoz et al. 2015). In
322
this latter study, PFOS is found to be the prevalent compound, accounting for between 34 and 100% of
323
ΣPFASs. The large increase in concentrations downstream of site R4 indicates substantial inputs of PFASs to
324
the Rhône River via local point sources such as the fluoropolymer manufacturing plant. Another potential
325
sources of 6:2 FTSA and PFOS precursors include the St-Fons WWTP (~106 population equivalents) and the
326
Gier River, a well-documented tributary affected by industrial activities (Poulier et al., 2019) where sediments
327
show one of the highest concentrations reported in this study for bed sediments or deposits (>90th percentile
328
of ΣPFSAs). As regards long-chain PFCAs, the increase in PFNA, PFUnDA and PFTrDA is very probably
329
related to inputs from the fluoropolymer production plant, which is consistent with the results of Dauchy (2012).
330
PFNA was actually used as a processing aid in fluoropolymer synthesis (e.g. polyvinylidene fluoride, PVDF).
331
PFUnDA and PFTrDA likely represent impurities of the ammonium perfluorononanoate (APFN) used for
332
industrial applications (Buck et al., 2011).
333
334
4.2 Influence of deposition patterns on PFAS concentrations in the sediment core
335
Floods and river-management operations have affected sediment deposition patterns at the sediment core
336
site. Sediments deposited just after the debris dam removal in 1984 are assumed not to represent the same
337
depositional conditions as recorded in more recent intervals. Indeed, sandy and well-sorted intervals in the
338
deepest part of the core contrast with fine-grained and poorly classified sediments deposited in the upper part
339
of the core. Such changes in the connectivity conditions that control deposition processes might also explain
some short-term variations in the vertical profile of PFASs. Major flood events occurring in the early 1990s and
341
2000s, result in lower PFAS levels as reflected by increased sand content and a decrease in organic carbon
342
content in some core layers. The relatively low total PFAS concentration measured in the most recent sample
343
(1.4 ng g-1 dw) indicates a possible dilution effect attributed to upstream sediment flushing that occurred in
344
2012, just before coring operations.
345
346
ΣPFAS concentrations appear to decrease in each layer corresponding to a flood event. This is consistent with
347
(Ahrens et al., 2011), who showed a lower sorption capacity for sandy sediment with a low TOC content,
348
whereas higher sorption capacities are found for muddy sediments with higher TOC content. When normalized
349
according to OC content, PFAS concentrations in flood layers converge with the values measured in adjacent
350
layers. Similarly, the apparent increase of PFAS concentrations in the upper part of the core is mainly due to
351
a change in OC content in these layers. However, considering OC-normalized concentrations, there is no
352
significant change in concentrations of ΣPFAS from about 2008 to layers from the top of the core dated at
353
2013 (Kendall's tau test of correlation, p=0.45).
354
355
4.3 Temporal trend in the sediment core and comparison with sediment cores worldwide
356
Numerous studies have been published during the last decade using sediment cores for assessing the spatial
357
or temporal trends of PFAS contamination (e.g. (Ahrens et al., 2009b; Bao et al., 2009; Codling et al., 2018a;
358
Codling et al., 2018b; Codling et al., 2014; Yeung et al., 2013). These studies differ in several ways, such as
359
objectives, dating methods and range of analysed compounds. Some studies have targeted remote lakes to
360
elucidate PFCA atmospheric pathways to these areas (Benskin et al., 2011), while others have dealt with large
361
water bodies in industrialized regions to better understand PFAS fate and observe the effects of production
362
using changes at a large spatial scale (Myers et al., 2012; Zushi et al., 2010). Several studies have focused
363
on river stretches or lake sections directly influenced by industrial parks (Zhao et al., 2014; Zhou et al., 2013)
364
or cities (Bao et al., 2010). Sediment sample dates were either not determined, or estimated using a range of
365
radionuclides (210Pb, 137Cs, 241Am).
366
The range of PFASs analysed in these studies varies from a few PFCAs to large sets of compounds including
367
PFSAs, FTSAs, FOSAs and FOSAAs; only few studies normalize PFAS concentrations to TOC content (Zhou
368
et al., 2013; Zushi et al., 2010), making it impossible to directly compare contamination levels. It would be
369
more reasonable, however, to use indicators such as ΣPFASs, ΣPFCAs or ΣPFSAs as trend indicators,
provided the range of analysed compounds is large enough, because they would account for changes in
371
production processes, e.g. from PFOS to shorter chain PFSAs, and for degradation of precursors into PFCAs
372
(Benskin et al., 2011) or PFOS (Zushi et al., 2010). ΣPFASs or ΣPFCAs/PFSAs trend patterns as well as the
373
period of maximum concentration (peak date) could therefore provide information about such changes.
374
In the Rhône River, the increase of ΣPFASs in the 1990s (up to 51.4 ng g-1 dw in 1994), was followed by a
375
decrease in concentrations (to ~10 ng g-1 dw), which have remained stable since the late 2000s. Overall, the
376
molecular profile is largely dominated by long-chain PFCAs. Moreover, a shift is observed from odd to even
377
perfluorinated carbon atom numbers: PFDA and PFDoDA were dominant before 2002, (i.e. mean contributions
378
to ΣPFCAs of 37% and 31%, respectively), while PFUnDA and PFTrDA represent the highest contributions
379
(29 and 45% of ΣPFCAs, respectively) in the post-2005 deposits. This shift is very likely related to changes in
380
the production process at the industrial plant, as already mentioned in similar contexts (Zhou et al., 2013).
381
Such a trend is similar to that in Tokyo Bay cores, where long-chain PFCA concentrations (e.g. PFUnDA and
382
PFTrDA) have been continuing to increase at the top of the cores since 2005 (Ahrens et al., 2009b; Zushi et
383
al., 2010). A similar increase of long-chain PFCA concentrations was also reported in Lake Ontario (Myers et
384
al., 2012) as well as in some other Laurentian Great Lakes (Codling et al., 2018a). Nevertheless, published
385
data on long-chain PFCAs in cores show either increasing trends (Bao et al., 2010; Gao et al., 2014; Yeung
386
et al., 2013; Zhao et al., 2014) or indeterminate trends (Codling et al., 2018a; Codling et al., 2018b).
387
The PFOS trend in the Rhône River core is not obvious, as concentrations vary a great deal over the years,
388
even when normalized to OC. There are nevertheless three distinct periods (Fig. S6): before ca. 1985, PFOS
389
concentrations remain below 15 ng g-1 OC. During the next period (1985-2000), PFOS concentrations range
390
between 20 to 60 ng g -1 OC, whereas OC-normalized concentrations range between 20 and 40 ng g-1 OC in
391
the most recent layers (since the years 2000). After exclusion of the two outliers measured in 1987 and 1999,
392
PFOS concentrations normalized to OC content are significantly (Mann-Whitney, p=0.028) higher during the
393
1985-2000 period compared to the most recent period (with respective means of 35.9 and 25.4 ng g-1 OC),
394
indicating a downwards shift after 2002. Similar shifts are also noted in other parts of the world, e.g. Tokyo
395
Bay in Japan (Ahrens et al., 2009b) or Lake Michigan (USA) (Codling et al., 2014), as well as Lake Ontario
396
(Canada) (Myers et al., 2012), owing to the withdrawal of PFOS from industrial applications (Paul et al., 2009),
397
and thus their reduced levels in consumer products (Boulanger et al., 2005). Interestingly, in the
398
abovementioned Lake Ontario study, the suspended sediment from its main tributary, the Niagara River,
399
responded rapidly to the phase-out of PFOS, with a concentration drop in 2000, while PFOS concentrations
were still increasing at the top of the sediment cores (middle of the lake) in 2006. Sediment records from
401
riverine systems, such as the Niagara and Rhône rivers, might accordingly track the consequences of
402
contaminant phase-out more rapidly compared with large lakes.
403
5. Conclusion
404
The Rhône River upstream and downstream from Lyon is subject to multiple sources of emission of
405
perfluoroalkyl substances, generating a complex pattern of sediment contamination. An extended spatial
406
survey of flood and bed sediments reveals multiple sources of PFSAs and PFOS precursors, as well as local
407
discharges of short-chain (PFHxA) and long-chain (PFNA, PFUnDA and PFTrDA) PFCAs, 6:2 FTSA and
408
FOSAAs. Based on the analysis of a sediment core collected in a secondary channel 38 km downstream from
409
the local discharge, we show that industrial emissions of PFAS became quite significant by the late 1980s,
410
reaching a maximum in the 1990s (maximum recorded PFASs: 51.4 ng g-1 dw in 1994). During this period,
411
PFDA, PFDoDA and PFTeDA provided the main contribution (74%) to PFASs. From ca. 2005 onwards,
412
concentrations decreased to a plateau, but were still influenced by local inputs and activities. The molecular
413
profile of PFCAs in the sediment column shifted from an odd to even number of fluorinated carbon atoms,
414
PFTrDA and PFUnDA representing about 75% of PFASs in sediment core samples after 2005. Such a
415
compositional shift strongly suggests that changes occurred in the production process of the industrial plant.
416
PFASs concentrations measured in this sediment core appear to be amongst the highest recorded in sediment
417
cores worldwide. This spatial and retrospective study provides valuable insights into the long-term
418
contamination patterns of PFAS chemicals in river basins impacted by both urban and industrial activities.
419
420
Acknowledgments
421
This study was funded by the Rhône-Mediterranean and Corsica Water Agency and the Rhône-Alps Region
422
in the context of the Rhône River ecological restoration plan. We thank Raphael Barlon and the team of the
423
“Centre d’Observation de l’Ile du Beurre” (Tupins & Semons, France) for their support in core collection. We
424
also thank Fanny Arnaud for providing us hydrological data from the Ternay gauging station as well as
425
Christopher Fuller and Peter Van Metre (both at USGS) for fruitful discussions. The Aquitaine Region and the
426
European Regional Development Fund are also acknowledged for their financial support (CPER A2E). This
427
study was carried out with financial support from the French National Research Agency (ANR) in the
428
framework of Investments for the future Program, within the Cluster of Excellence COTE (ANR-10-LABX-45).
429
Dr. M.S.N. Carpenter post-edited the English style and grammar.