HAL Id: hal-00316407
https://hal.archives-ouvertes.fr/hal-00316407
Submitted on 1 Jan 1998
HAL is a multi-disciplinary open access
archive for the deposit and dissemination of sci-entific research documents, whether they are pub-lished or not. The documents may come from teaching and research institutions in France or abroad, or from public or private research centers.
L’archive ouverte pluridisciplinaire HAL, est destinée au dépôt et à la diffusion de documents scientifiques de niveau recherche, publiés ou non, émanant des établissements d’enseignement et de recherche français ou étrangers, des laboratoires publics ou privés.
Spectrum of geomagnetic activity in the period range
5?60 days: possible lunar influences
J. St?e?tik
To cite this version:
J. St?e?tik. Spectrum of geomagnetic activity in the period range 5?60 days: possible lunar influences. Annales Geophysicae, European Geosciences Union, 1998, 16 (7), pp.804-811. �hal-00316407�
Spectrum of geomagnetic activity in the period range 5±60 days:
possible lunar in¯uences
J. StrÏesÏtõÂk
Geophysical Institute, Acad. Sci. of the Czech Rep., BocÏnõÂ II 1401, Praha 4 - SporÏilov, CZ-14131, Czech Republic
Fax: + 42 2 71 76 15 49; e-mail: jstr@ig. cas. cz
Received: 21 October 1996 / Revised: 12 January 1998 / Accepted: 18 February 1998
Abstract. The series of daily Ap-indices has been subdivided into pentades (1932±1936 etc.) and spectra with ®ne-frequency resolution have been calculated for the indices in each of these intervals. Daily sunspot numbers have been processed in the same way. The average spectrum from all spectra in the pentades, as well as the spectrum from the whole interval have been calculated, and signi®cant peaks have been determined. There is a signi®cant dierence between the spectra in the pentades containing the solar activity minimum (1932±1936, 1942±1946 etc.) and those containing the solar activity maximum (1937±1941, 1947±1951 etc.). Most peaks can be interpreted as a response to solar rotation and to the structure of solar wind speed (two high-speed streams per solar rotation), both modulated by the 11-year, annual and semi-annual waves. No signi®cant peak corresponding to the period of the synodic month, or its half has been found. This result suggests that the in¯uence of lunar cycles on some natural phenomena (if any) is not mediated by geomag-netic activity.
Key words. Geomagnetism and paleomagnetism á Time variations á Diurnal to secular á Magnetospheric physics á Solar wind-magnetosphere interactions
1 Introduction
Geomagnetic activity displays various regular and irregular variations. These have been intensively inves-tigated because of their practical signi®cance. Geomag-netic activity may in¯uence, e.g. the propagation of radio waves in the ionosphere, and its traces can be found even in some processes in the biosphere. The origin of most geomagnetic variations lies on the Sun. The contribution, if any, of some other factors will be the subject of this paper.
In this paper we shall restrict ourselves to determin-ing periodic variations in the period range between 5 and 60 days. The most signi®cant variation which can be expected in solar activity observed from the Earth within this range is associated with the synodic period of solar rotation. This period (Carrington rotation) is 27.2753 days (Bruzek and Durrant, 1977). The same con®guration of active regions on the solar disk, observed from the Earth, is repeated after this period because their ``lifetime'' is usually longer than 1 month. Due to the dierential rotation of the Sun, the period of repetition depends on the heliographic latitude of these regions, being slightly longer for those at higher latitudes. New regions of activity appear, of course, at any heliographic longitude and their distribution is random. Solar activity thus displays a strong aperiodic component. If only a short time-interval is being investigated, the proper period of solar rotation may be covered by noise and some spurious periods may appear in the spectrum. With a suciently long interval these spurious periods are averaged out, and the only signi®cant peak near 27 days should prevail.
In geomagnetic activity the situation is dierent. One may, of course, expect an eect of the 27-day period in solar activity, and this period does indeed appear in geomagnetic activity [see, e.g., Bartels (1932) and references therein]. This period in geomagnetic activity is a consequence of the chain consisting of coronal holes, high-speed solar-wind streams and recurrent geomag-netic storms (Neupert and Pizzo, 1974). The relation between solar-wind streams and recurrent geomagnetic storms (with the 27-day periodicity) has already been pointed out (Snyder et al., 1963). Moreover, a signi®cant variation with a period between 13 and 14 days appears persistently. It cannot be interpreted as a second harmonic of the basic 27-day wave, or as a mathematical artefact because its amplitude is too high. Later, when studying the solar-wind speed, Gosling et al. (1976) and Fenimore et al. (1978) con®rmed the two-stream struc-ture of the solar wind (two high-speed streams per solar rotation) which results in the dominant 13.5-day
peri-odicity in the solar-wind velocity, and this periperi-odicity should also be observed in geomagnetic activity. Note that Ward and Shapiro (1962) found the 13-day periodicity also in some solar parameters, e.g., in the calcium K-line plage data. More recently, Mursula and Zieger (1996) investigated the 13.5-day periodicity in the Sun, solar wind and geomagnetic activity during the last three cycles in detail. Among other things, they showed that due to the tilted solar dipole the Earth encounters the high-speed solar wind stream twice per solar rotation, and this is a simple explanation of the 13.5-day periodicity of the solar wind observed from the Earth. Moreover, since this model requires a suciently ¯at heliosheet, the mentioned periodicity should be dominant in solar minimum years. The authors also considered some other models which could produce the two-stream structure (or the 13.5-day periodicity), and dismissed, e.g., the eect of the respective multisectorial structure of the interplanetary magnetic ®eld.
Beside periods associated with the Sun one may expect the eect of some lunar variations, though much weaker than those of solar variations. The possible role of the Moon had already been pointed out by Arrhenius (1898). Later, Bigg (1963) and other authors in the same issue believed to have discovered these periods in geomagnetic activity, whereas Bartels (1963) in his critical review dismissed such attempts, giving some examples of purely accidental curves (``spurious lunar variations'') the amplitudes of which were comparable with those obtained for the true lunar cycles. Neverthe-less, this problem does not seem to be closed. Stolov and Cameron (1964) con®rmed a signi®cant lunar eect on geomagnetic activity especially in geomagnetically quiet years. A large number of papers searching for the lunar variation in natural phenomena appears every year, especially in connection with medicinal and biological data. Some authors claim that they have found it, and some say they have not [see, e.g., Thakur and Sharma (1984) and MacMahon (1983) as examples for both kinds of results]. These results, however, are very often based on short data series. Moreover, many authors consider only the synodic lunar or semilunar period. This point will be discussed later. Let it be pointed out that (in the literature) lunar in¯uences on small animals, such as insects, worms, etc., seem to be more signi®cant than, e.g., on man (Mohssine et al., 1990). It is not clear whether this in¯uence acts directly, or if it is mediated by geomagnetic activity, or if it exists at all.
In any case, one fact is clear: there is no explanation or known mechanism for the way in which periodicities associated with the Moon's orbit could be re¯ected in some physical or biological processes on the Earth. All results are based exclusively on the statistical evaluation of data. Therefore, it is highly desirable to look carefully for all periodicities in geomagnetic activity using data series as long as possible, and to decide which part has its origin on the Sun, or in interplanetary space, and what, if anything, remains to be associated with lunar sources. For this purpose it is also necessary to process solar activity data in the same time-interval, and to compare the periodicities found in both series.
A detailed spectral analysis of geomagnetic Ap-indices has been reported by Fraser-Smith (1972). The major part of this paper considers periods longer than 6 months. Only a 23-year interval (1944±1967) has been used to analyse shorter periods, and no comparison with solar activity in this period range has been made. The following signi®cant peaks have been found in the spectrum: 27.2 and 27.6 days (a doublet, with the same amplitude), then with gradually decreasing amplitudes 37.4, 13.7, 14.1, 18.7, 30.5, 54.0, 13.6, 26.9, and 9.39 days. The present author himself commented the 37.4-and 18.7-day peak as unexpected, 37.4-and pointed out that no signi®cant peak corresponded to the period of the synodic month (29.53 days). The 23-year interval might be considered not long enough to exclude all random variations, and this may be the cause of the appearance of the 37.4-day period and of the splitting of the 27-day and 13.6-day lines.
Some years earlier Shapiro and Ward (1966) using the geomagnetic activity index Ci (1888±1959) found a principal peak at the period of 27.4 days supplemented by two subsidiary peaks near 29.4 and 26.0 days. Similar results were obtained from Kp-indices (1932±1959); however, the spectrum of sunspot numbers in the same time-interval shows only one isolated peak near 27 days. Nevertheless, they did not consider the ®rst subsidiary peak as being associated with the lunar synodic month because the dierence in periods (0.13 days) exceeds the frequency resolution in their calculations signi®cantly.
Later Delouis and Mayaud (1975) investigated peri-odicities in the geomagnetic aa-index over a 103-year interval. A considerable noise level appeared in the period range of 10±60 days. Many peaks exceed this level, most of them being concentrated in clusters in the vicinity of the 27-day and 13.6-day periods. Most of them correspond to those found by Fraser-Smith (1972). Spectral lines are interpreted as modulation and excita-tion lines. No in¯uence of the Moon was detected.
On the other hand, Galal et al. (1955) using the Kp
-index from the Misallat Observatory (the designation Kpwas used in their paper) during the period 1958±1989
obtained the most pronounced periods 32.7, 21.2, 12.9, 11.6, and 9.2 days, the third and ®fth being the strongest. No signi®cant peaks near 27 or 13.5 days were found. The authors did not give any explanation for their unexpected results.
2 Data and analysis
Recently, suciently long series of geomagnetic activity data have become available. Planetary Kp-indices of geomagnetic activity were calculated back to 1932 and the same was done for other indices derived from them. In this paper we shall use the 60-year-long series of daily Ap-indices of geomagnetic activity, 1932±1991 (this series includes nearly 22 000 days). For comparison, the series of daily sunspot numbers in the same time interval will be processed as well. Sunspot numbers, however, are not the best way of describing the solar activity on the daily scale, nevertheless, no other solar
data are available for such a long time-interval. Therefore, we shall tentatively use the Comprehensive Flare Index (CFI) for a shorter time-interval (1982± 1986) and the results will be compared with those obtained from sunspot numbers. This index was intro-duced by Dodson and Hedeman (1971) as a compre-hensive evaluation of each solar ¯are. Daily sums of CFIs are used in this paper. As regards geomagnetic activity, the semilogarithmic daily indexPKp will also be used for the same short interval.
For the calculation itself the whole data series was subdivided into parts of 5 years' duration, i.e., data in intervals 1932±1936, 1937±1941,¼1987±1991 were pro-cessed separately. The data of the CFI and the daily P
Kp indices of geomagnetic activity cover just one of these intervals. The purpose of this division was to make the calculations easier and to be able to compare the results obtained for the various time-intervals. All intervals have the same length. By chance, odd intervals cover years near the minima of solar and geomagnetic activity whereas even intervals cover years near the maxima, but this does not apply exactly in all cases and was not the main purpose of this division. On the other hand, this subdivision does not dier too much from the true positions of the maxima and minima (only the lengths of the individual intervals should sometimes be longer or shorter) because the prevailing length of solar cycles in the 20th Century was 10 years, as pointed out by CharvaÂtova and StrÏesÏtõÂk (1991). The average annual sunspot number in the odd intervals is 37.4, whereas in the even intervals it reaches 105.5, so that a rough insight into possible dierences between years with high and low activity can be made.
The data in consecutive intervals were used as input data for spectral analysis. The spectra were determined by Fourier transform: given the data as a function f(t) in the interval from 0 to s, the complex spectrum is expressed as
S x Z
s 0
f t exp ixt dt A x iB x : 1 The real spectrum is then de®ned as F x jS xj A2 x B2 x1=2. The quantities
A x Zs 0 f t cos xt dt and B x Zs 0 f t sin xt dt 2 are real functions and can be determined numerically. The fast Fourier method was not used for evaluating these integrals because in frequencies x would then not be optional, and in some cases the resolution in frequency would not be satisfactory. The sine and cosine functions occurring in the formulae for A x and B x were calculated using recurrent formulae [they decrease considerably the time required for the calcula-tion ± for details refer to StrÏesÏtõÂk (1982)] and the Simpson formula was used for numerical integration.
All the spectra of the Ap-indices and sunspot numbers in the selected time-intervals were calculated for x from 0.1 rad/day T 62:8 days) to 1.2 rad/day (T 5:23 days), with a step of 0.0025 rad/day. This step enables us to distinguish dierences in periods as small as 0.3 day in the period range of 27±29 days, 0.07 day in the range of 13±14 days and 0.02 day in the range of 6.5±7.5 days.
The average amplitude spectra PF x were deter-mined from spectra in 5-year intervals (this calculation would not be correct if these intervals did not have the same length). They summarize the values of the spectra irrespective of their phases, so that they prefer common peaks in the spectra of the individual parts. This average spectrum is not, of course, identical with the spectrum calculated for the whole 60-year interval. That spectrum would be obtained as PS x, the phase of all S x's being related to the same origin.
The spectra of the whole data series (1932±1991) were calculated simultaneously in the same period range with the same frequency step. They were compared with the average spectra described in the foregoing. The spectra of the whole data series were also calculated in narrower period ranges (for x from 0.18 to 0.29 rad/day, i.e. periods between 34.9 and 21.7 days, and from 0.41 to 0.50 rad/day, i.e. periods between 15.3 and 12.6 days) with a step of 0.001 rad/day. The resolution in periods is then 0.1 day in the ®rst and 0.025 day in the second period range. No special window for calculation of any spectra was used (i.e. a rectangular window was used for all spectra). In all the spectra, 99% con®dence levels (and in some spectra also 95% CL) were determined using the method described, e.g., in Blackman and Tukey (1958) for power spectra.
3 Results
As the ®rst point we shall consider the spectra in the 1982±1986 interval. Only in this interval have we used two parameters to describe solar activity and two indices to describe geomagnetic activity. The spectra of all these quantities are presented in Fig. 1. As expected, the highest peak in the sunspot number spectrum lies at a period of about 27 days, but it split into several peaks. This is caused by the fact that sunspots appeared at dierent heliographical latitudes during these 5 years, and the period of rotation of the Sun diered slightly at dierent latitudes. In the CFI spectrum a higher noise level and more subsidiary peaks are observed, their origin being unclear. Though the CFIs are better connected with physical processes on the Sun, it seems that sunspot numbers are more convenient for long-term statistics because of the lower noise level and sharper peaks in the spectra. In geomagnetic activity, the dierences between the spectra of Ap andPKp indices are not signi®cant. This is not surprising because both indices are derived from the 3-h K-indices, the dierence is only in the scale (linear or semilogarithmic). It seems only that the peaks in the Ap spectrum are a little
sharper and more pronounced than in the PKp spectrum.
The average spectra of all intervals applied to the sunspot numbers and Ap-indices are shown in Fig. 2. The noise level decreased rapidly in the sunspot number
spectrum and only the block around the 27-day period considerably exceeds the 99% con®dence level. Let us mention two subsidiary peaks outside this block: in the 13.7-day period and in the 30.9-day period, which is obscure. Also in the Ap spectrum the noise level
Fig. 1a±d. Spectra of solar and geomagnetic activity indices in the interval 1982±1986. a Sunspot numbers, b Comprehensive Flare index, c geomagneticPKp-index, d geomagnetic Ap-index. Horizontal dashed lines indicate the 99% con®dence level
Fig. 2a,b. Average spectra calculated from all 5-year intervals within 1932±1991. a Sunspot numbers, b geomagnetic Ap-indices. Horizontal dashed lines indicate the 95% and 99% con®dence levels
decreased, but the peaks exceed the 99% con®dence level only slightly. Three peaks are signi®cant in this spectrum: the ®rst one in the 27-day period, split into several peaks, the second in the 13.6-day period which is the highest, and the last, whose origin is not clear, in the 9-day period. The 7-day peak, signi®cant in Fig. 1, practically disappeared.
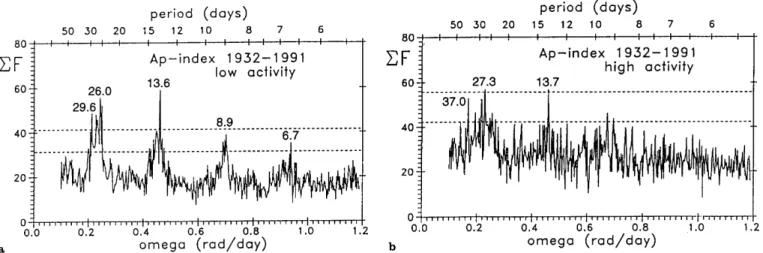
Looking at the spectra of the Ap-indices in the individual 5-year intervals one observes conspicuous dierences between the odd and even intervals, i.e. between the intervals with lower and higher solar activity. The average spectra for the odd and even intervals separately are shown in Fig. 3. In the years with lower solar activity the noise level is low, and four signi®cant groups of peaks can clearly be seen. In the years with higher solar activity the noise level increases and only peaks in approx. 27-day and 13.7-day period remain and a peak in the 37-day period appears. The 9-day peak exceeds the 95% signi®cance level only slightly, the 7-day peak is below this level.
The group of peaks near the 27-day period can be seen better in Fig. 4 where the appropriate part of the spectrum of the whole interval (1932±1991) is displayed. It diers, of course, a little from the average spectrum calculated from the 5-year intervals. Note that the noise level is considerably higher when the whole interval (1932±1991) is used. In the average spectra of all 5-year intervals the spectral peaks are more pronounced. The main peak in the spectrum in Fig. 4 lies at the period of 27.2 days (instead of 27.6 days in Fig. 2); nevertheless, two peaks in shorter periods and one lower peak at the longer periods are clear in both spectra. An attempt to interpret them will be described in the next section. The second part of the spectrum of the whole interval, in the vicinity of the 13.6-day period, is shown in Fig. 5. A distinct peak at the period of 13.63 days corresponds well to that at the 13.7-day period in Fig. 2. These peaks are supplemented by some lower peaks in both ®gures, and are more signi®cant in Fig. 5. The frequency resolution in Figs. 4 and 5 is ®ner than that in Fig. 2
Fig. 3a,b. Average spectra calculated separately for odd and even intervals. a Odd intervals (1932±1936, 1942±1946, etc.) with lower solar activity, b even intervals (1937±1941, 1947±1951, etc.) with higher solar activity. Horizontal dashed lines indicate the 95% and 99% con®dence levels
Fig. 4. Spectrum of geomagnetic Ap-indices in the whole interval 1932±1991 in the vicinity of the 27-day period. Horizontal dashed lines indicate the 95% and 99% con®dence levels
Fig. 5. Spectrum of geomagnetic Ap-indices in the whole interval 1932±1991 in the vicinity of the 13.6-day period. Horizontal dashed lines indicate the 95% and 99% con®dence levels
and, therefore, more peaks appear in these spectra. Outside these groups of peaks no other peaks appear to be signi®cant.
4 Discussion and conclusion
The presence of some signi®cant peaks in the spectrum of Ap-indices without corresponding peaks in the solar activity spectrum poses the question of their origin. We shall ®rst review the periodicities associated with the Moon which could possibly be observed on the Earth, without considering if they really are, and then some other periodicities.
The synodic month is the interval between two successive lunar phases (from new Moon to the next new Moon) and re¯ects the position of the Moon with respect to the Sun-Earth line. Its length is 29.5305 days. The semilunar wave associated with the synodic month expresses the regular changes of the amplitude of tidal waves on the Earth. Tides are the only pronounced physical eect of the Moon on the Earth. There are also tides in the atmosphere but their amplitude (and energy) is too small to explain, e.g. any variations in weather (Volland, 1988). Perhaps tides in the ionosphere could play a role. In any case, the existence of the tides in itself cannot be considered as an explanation of the possible in¯uence of the Moon on geomagnetic activity. The interaction between the Moon and plasma streams is negligible, because the Moon has no magnetic ®eld of its own.
The sidereal month is the time-interval between two successive positions of the Moon with respect to the stars and its length is 27.3217 days. Very similar is the tropical month which considers positions with respect to the vernal point (it takes the Earth's precession into account) and lasts 27.3216 days. This period and its half are re¯ected in the changes of the form of the lunar daily tidal wave. This change has the same character as the change of the solar daily tidal wave during the year and is due to the dierence in the length between day and night. This is how the annual and semiannual wave in solar tides and the lunar and semilunar (tropical) wave in the lunar tidal wave occur. Note that the period of the tropical month lies very near the Carrington period of solar rotation and it is practically impossible to distinguish between them. The same applies to the semilunar waves and the approx. 13.5-day period observed in solar wind.
The anomalistic month is the time-interval between two successive perigees of the Moon's orbit and lasts 27.5545 days. The change in the distance between the Earth and the Moon causes small regular changes in the amplitude of lunar tidal waves. Only the lunar anom-alistic wave is signi®cant, not the semilunar. Again, this period lies very near the Carrington period. All these lunar periodicities can be taken into account only if the investigated phenomena are subject to a tidal eect.
These periods could perhaps be detectable in some eects on the Earth, though with a very small amplitude. But there is no process which would generate periods of one-third or one-quarter of the basic period. The 9-day
period should then be considered as formal, being the result of mathematical processing. For example, a rectangular wave with a period of 27 days can be approximated by two sine waves with periods of 27 and 9 days and appropriate amplitudes and phases. This may be the explanation of the 9-day peak in the spectrum. The signi®cant 9-day peak was also found in the spectra of pulsation indices over a 12-year interval from the station of FuÈrstenfeldbruck in Germany (StrÏesÏtõÂk, 1983).
There are also some other periods in the vicinity of the Carrington period which can be of solar origin. Siebert (1971) pointed out that the 27-day period in geomagnetic activity can be modulated by longer periods occurring in this activity and being of solar or terrestrial origin. The idea of modulation was already mentioned by Coleman and Smith (1966).
Let us introduce some formulae describing the modulated oscillations [for more details see Kharkevich (1957) and StrÏesÏtõÂk (1985)]. Assume a sine function A sin x0t u to be amplitude modulated by a
long-period function B sin Xt U, where X < x. The equa-tion of oscillaequa-tion y A B sin Xt U sin x0t u
can be expressed in the form
y A sin x0t u B=2 sin x0ÿ Xt
u p=2 ÿ U
B=2 sin x0 Xt u ÿ p=2 U : 3
The amplitude modulated function is then represented by the sum of three sine oscillations with frequencies x0; x0 X, and x0ÿ X.
In the more complicated case of frequency modula-tion the basic equamodula-tion of oscillamodula-tion y A sin xt u, with x x0 bX cos Xt U can be resolved, using
Bessel's functions, into series y AJ0 b sin x0t u
AXJk bfsin x0 kXt u kU
ÿ1ksin x0ÿ kXt u ÿ kUg ; 4
where the summation runs from k 1 to in®nity. The frequency modulated function is then represented as the sum of a series of sine oscillations with frequencies x0; x0 X; x0ÿ X; x0 2X; x0ÿ 2X, etc. Their
ampli-tudes decrease with increasing distance from carrier frequency x0as the order of Bessel's functions increases.
Let it be emphasized that both in the amplitude and frequency modulation, the peaks situated symmetrically with respect to the carrier frequency have the same amplitude. In all modulations described in this paper only the peaks at frequencies x0 X and x0ÿ X [i.e. for
k 1 in Eq. (4)] are signi®cant, so that there is practically no dierence between the eects of the amplitude and frequency modulation (there are dier-ences in phase only).
We shall now describe the periods of the subsidiary modulation peaks numerically. The modulation of the 27-day basic wave by the 11-year wave results in two subsidiary maxima lying at periods of 27.09 and 27.46
day (we assume the Carrington period to be 27.2753 days and the average length of the solar cycle to be 11.19 years). These modulation peaks should also be present in the solar activity indices. The annual variation generates subsidiary maxima at periods of 25.38 and 29.48 days, the semiannual variation at periods of 23.73 and 32.07 days. All these periods have been mentioned by Siebert (1971). Let it be pointed out that one of them (29.48 days) lies very near to the synodic lunar period (29.53 days) and the problem of distinguishing between the two periods arises once more. The modulations by the annual and semiannual waves can, of course, be expected only in geomagnetic activity. All these periods are mentioned in Siebert (1971); however, he states only two of them (25.38 and 29.48 days) as actually observed. Siebert (1971) says nothing of a possible modulation of the 13.5-day period in geomagnetic activity, Coleman and Smith (1966) mentioned this possibility without giving a numerical example. Subsidiary peaks in this case lie nearer the 13.5-day carrier wave than those for the 27-day carrier wave. The modulation of the 13.5-day basic wave by the 11-year wave results in two subsidiary maxima lying at periods of 13.59 and 13.658 days (the precise half of the Carrington period has been used here); this dierence is in the frequency resolution in our calculations. The annual and semiannual variation generate subsidiary maxima in periods of 13.15 and 14.27 days, and at periods of 12.69 and 14.74 days, respectively. One of them (14.74 days) diers only slightly from the semilunar synodic period (14.78 days). The 7-day period (i.e. precisely 7000 days) can be associated only with the social week. It is reported by a number of authors (e.g., StrÏesÏtõÂk, 1983, for pulsation indices) but their maxima fall on dierent days of the week with a possible systematic distribution worldwide (see, e.g., the review given by Predeanu, 1994). The present author (StrÏesÏtõÂk et al., 1994) found a 7-day variation in the Ap-index for 1971±1980 with minima on Saturday and Sunday. He suggested the explanation that the somewhat higher activity on workdays is caused by industrial and trac noise. But this simple explana-tion was not con®rmed later for other decades, and the described eect, if any, must have a very small ampli-tude. However, no other mechanism has been suggested which would increase or decrease the level of geomag-netic activity on any other day of the week.
Let us revert to the geomagnetic activity spectra and compare them with the reviewed periodicities. The main peak at the period of 27.2 days in Fig. 4 corresponds well to the Carrington rotation (the resolution in this ®gure is 0.1 days). As already mentioned, two small subsidiary peaks with equal amplitudes lie very near to this peak in Fig. 4 (at periods of 27.45 and 27.09 days). They can be associated with the modulation eect by the 11-year wave suggested by Siebert (1971). The second peak could, of course, correspond to the period of the anomalistic month (27.55 days). However, this inter-pretation creates a problem with the other peak (27.09 days) which would be unexplained. Therefore, the modulation eect should be preferred rather than the in¯uence of the Moon. The same applies to the
modulation by the annual wave. The peaks observed at periods of 25.7 and 29.3 days can be interpreted as being due to this eect. Note that very similar periods were found by Shapiro and Ward (1966) and interpreted by Coleman and Smith (1966) as the result of the amplitude modulation by an annual wave. Though the second peak lies very near the period of the synodic month (29.53 days), the interpretation with the modu-lation eect should be preferred, otherwise there would be no explanation for the 25.7-day peak. Peaks resulting from modulation by the semiannual wave are not observed (at least as signi®cant) in the geomagnetic indices spectra. This is surprising because the semian-nual variation itself is evident in geomagnetic activity, whereas the annual wave is pronounced neither in geomagnetic, nor solar activity. The peaks at periods of 28.6 and 24.7 days cannot be interpreted as being the result of modulation.
A similar situation is observed in the period range of 12±15 days in Fig. 5 showing the spectrum of the whole interval (1932±1991). The same noise level as in Fig. 4 occurs. The main peak with a period of 13.63 days is supplemented by two peaks with periods of 13.54 and 13.70 days, and they correspond well to those peaks resulting from the modulation by the 11-year wave because the frequency resolution in Fig. 5 is satisfactory. The peak at the 14.35-day period could be interpreted as a modulation eect by the annual wave, but no peak near the 13.15-day period is observed. As regards the modulation by the semiannual wave, both peaks in the spectrum (12.77 and 14.75 days) lie very near to the calculated position. Again, the second peak lies very near the semilunar synodic period, but as in the previous case, the modulation eect should be preferred, other-wise there would be no explanation for the other peak. In this period range the modulation by the semiannual wave is much clearer than that by the annual wave.
In both period ranges many peaks can be interpreted as a modulation eect rather than the in¯uence of waves associated with the Moon. The other peaks, not included in the modulation eect, dier considerably in periods from supposed lunar or semilunar waves. This fact decreases considerably the scope for possible in¯uences of the Moon on geomagnetic activity. More-over, due to noise the peaks at frequencies x0ÿ X (29.48
and 14.27 days) may sometimes be higher than those in x0 X and the observer is tempted to interpret them
incorrectly as a lunar or semilunar synodic wave. But this distortion of the relation between the amplitudes of the peaks at frequencies x0ÿ X and x0 X is random
and is not repeated. We can thus conclude that if a lunar in¯uence does contribute to geomagnetic variations, this contribution must be very small and far below the con®dence levels used in all ®gures in this paper.
The highest peaks in the period range of 6.5 to 7 days occasionally reach the 95% con®dence level. They are signi®cant only in years with lower solar activity. Their period (6.7 days) corresponds well to a quarter of the solar rotation period, or to half of the 13.5-day period given by Mursula and Zieger (1996) for SW streams, and is far from the period of the social week (the resolution
in periods is quite satisfactory). No in¯uence of, e.g., arti®cial disturbances, which should be lower on Satur-day and SunSatur-day, has been found in geomagnetic Ap-indices.
It should be mentioned that there is another possibility of explaining the set of subsidiary peaks near the 27- and 13.5-day period. Fenimore et al. (1978) investigated the power spectra of wave packets, where high-speed streams consist of series of pulses with a constant period separated by intervals of dierent lengths. The basic period is split into a set of peaks with dierent amplitude. They need not be generally symmetrical with respect to the main frequency. The whole spectrum depends substantially on the lengths of the intervals between wave pulses. This eect needs to be taken into account too; however, the symmetrical view of spectra in the vicinity of the 27-day period prefers the interpretation as modulation eects. This mechanism could perhaps explain some peaks which are not associated with modulation eects (e.g. the 14.35-day peak in Fig. 5, and some other peaks in Figs. 4 and 5 below the 99% con®dence level). A dierence between the observed and calculated periods for some peaks could be caused by this eect too. In any case, this model provides no scope for interpreting any peak as a possible lunar eect either.
There is a very small probability that a signi®cant in¯uence of the Moon on geomagnetic activity will be found in future. The longest series of available daily Ap-indices has been used in this paper. It includes approx-imately 800 lunar or 1600 semilunar waves. The frequency resolution of the calculated spectra is quite satisfactory for determining any periods associated with the Moon. Some other methods might be more successful in discov-ering and providing the existence of signi®cant variations which have not been discovered by spectral analysis. Nevertheless, these results do not deny the existence of in¯uences the Moon may have on some other phenomena on Earth. They only claim that such in¯uence, if any, is not mediated by geomagnetic activity (or solar activity, of course) and that it will be even more dicult to ®nd a mechanism for this connection.
Acknowledgements. Topical Editor R. Schwenn thanks J. Hruska and K. Mursula for their help in evaluating this paper.
References
Arrhenius, S., Die Einwirkung Kosmischer Ein¯uÈsse auf physiol-ogische VerhaÈltnisse, Skand. Arch. Physio., 8, 367±417, 1898. Bartels, J., Terrestrial magnetic activity and its relations to solar
phenomena, Terr. Magn. Atmos. Electr., 37, 1±52, 1932. Bartels, J., Statistische HintergruÈnde fuÈr geophysikalishce
Syn-chronisierungsversuche, und Kritik and behaupteten Mond-Ein¯uÈssen auf die geomagnetische AktivitaÈt, Nachr. Akad. Wissensch. GoÈttingen, 2, Math. Phys. Kl, 23, 333±356, 1963. Bigg, E. K., The in¯uence of the moon on geomagnetic
distur-bances, J. Geophys. Res., 68, 1409±1413, 1963.
Blackman, R. D., and J. W. Tukey, The measurement of power spectra, Dover, New York, 1958.
Bruzek, A., and C. J. Durrant (Eds), Illustrated glossary for solar and solar-terrestrial physics, Dordrecht, Boston, 1977.
CharvaÂtovaÂ, I., and J. StrÏesÏtõÂk, Solar variability as manifestation of the Sun's motion, J. Atmos. Terr. Phys., 53, 1019±1025, 1991.
Coleman, P. J., and E. J. Smith, An interpretation of the subsidiary peaks at periods near 27 days in the power spectra of Ci and Kp, J. Geophys. Res., 71, 4685±4686, 1966.
Delouis, H., and P. N. Mayaud, Spectral analysis of the geomag-netic activity index aa over a 103-year interval, J. Geophys. Res., 80, 4681±4688, 1975.
Dodson, H. W., and E. R. Hedeman, An experimental, compre-hensive ¯are index and its derivation for `major' ¯ares, 1955-1969, WDC-A Report UAG, 14, 1±2, 1971.
Fenimore, E. E., J. R. Asbridge, S. J. Bame, W. C. Feldman, and J. T. Gosling, The power spectrum of the solar wind speed for periods greater than 10 days, J. Geophys. Res., 83, 4353±4357, 1978. Fraser-Smith, A. C., Spectrum of the geomagnetic activity index
Ap, J. Geophys. Res., 77, 4209±4220, 1972.
Galal, A. A., H. A. Deebes, M. S. Qassim, and S. Yousef, Power spectrum of geomagnetic Kp-index detected at Misallat
mag-netic station, Earth Moon Planets, 70, 151±162, 1995.
Gosling, J. T., J. R. Asbridge, S. J. Bame, and W. C. Feldman, Solar wind speed variations: 1962±1974, J. Geophys. Res., 81, 5061±5070, 1976.
Kharkevich, A. A., Spectra and analysis (in Russian), State Publishing House of Technical and Theoretical Literature, Moscow, 1957.
MacMahon, K., Short-term temporal cycles in the frequency of suicide, United States, 1972±1978, Am. J. Epidemiol., 117, 744± 750, 1983.
Mohssine, E. H., M. Bounias, and J. M. Cornuet, Lunar phase in¯uence on the glycemia of worker honey bees, Chronobiologia, 17, 201±207, 1990.
Mursula, K., and B. Zieger, The 13.5-day periodicity in the Sun, solar wind, and geomagnetic activity: the last three solar cycles, J. Geophys. Res., 101, 27077±27090, 1996.
Neupert, W. M., and V. Pizzo, Solar coronal holes as sources of recurrent geomagnetic disturbances, J. Geophys. Res., 79, 3701± 3709, 1974.
Predeanu, I., Solar and lunar factors synchronizing the circaseptan rhythms, in Sun, moon living matter, proceedings, Ed. M. MikuleckyÂ, Slovak Medical Society, Bratislava, pp. 63±67, 1994.
Shapiro, R., and F. Ward, Three peaks near 27 days in a high-resolution spectrum of the international magnetic character ®gure, Ci, J. Geophys. Res., 71, 2385±2388, 1966.
Siebert, M., Masszahlen der erdmagnetischen AktivitaÈt, in Hand-buch der Physik ± Encyclopedia of Physics XLIX, Geophysik III/ 3, Ed. S. FluÈgge, Springer, Berlin, Heidelberg, New York, pp. 206±275, 1971.
Snyder, C. W., M. Neugebauer, and U. R. Rao, The solar wind velocity and its correlation with cosmic ray variations and geomagnetic activity, J. Geophys. Res., 68, 6361±6370, 1963. Stolov, H. L., and A. G. W. Cameron, Variations of geomagnetic
activity with lunar phase, J. Geophys. Res., 69, 4975±4982, 1964. StrÏesÏtõÂk, J., Computation of spectra of some simple functions using various types of windows, Stud. Geophys. Geod., 26, 145±159, 1982. StrÏesÏtõÂk, J., Statistical properties of geomagnetic pulsations at the observatory of FuÈrstenfeldbruck determined with the aid of pulsation indices. Part II. Periodicity in the occurrence of pulsations, Trav. GeÂophys., 24, 187±202, 1983.
StrÏesÏtõÂk, J., Interpretation of spectra of geomagnetic pulsations as a spectrum of modulated oscillations, Studia Geophys. Geod., 29, 362±373, 1985.
StrÏesÏtõÂk, J., A. ValachovaÂ, and M. MikuleckyÂ, Solar and lunar rhythms in geomagnetic Ap index, in Sun, moon and living matter, proceedings, Ed. M. MikuleckyÂ, Slovak Medical Society, Bratislava, pp. 44±51, 1994.
Thakur, C. P., and D. Sharma, Full moon and crime, Br. Med. J. Clin. Res. Ed., 289, 1789±1791, 1984.
Volland, H., Atmospheric Tidal and Planetary Waves, Kluwer, Dordrecht, 1988.
Ward, F., and R. Shapiro, Decomposition and comparison of time-series of indices of solar activity, J. Geophys. Res., 67, 541± 554, 1962.