MIT Energy Laboratory Report No. MIT-EL 79-021 February 1979
ASSESSMENT OF INTEGRATED URBAN ENERGY OPTIONS
by
Gerald D. Pine
Energy Laboratory Report No. MIT-EL 79-021 February 1979
An initial comparison is carried out for the following residential space and water heating options: electric resistance heating,
electrically-driven heat pumps, distribution of condenser temperature water combined with heat pumps to extract heat at the point of use, district heating via hot water from a combined heat-electric utility energy source, and
individual gas furnaces. This comparison indicates that district heating is potentially competitive with conventional technologies for new urban areas.
A more detailed analysis of the district heating option is undertaken to clarify its economics. Base case urban models, economic assumptions and distribution networks are defined and a computer program is developed
to select optimum pipe sizes for the networks and to calculate life cycle costs. Cost optimization is carried out by considering thermal energy production costs as well as thermal conveyance costs.
Because of the large number of variables entering into the cost determination, sensitivity analyses are performed to examine the effects of variations from base case assumptions. Variations in the installed pipe cost, interest rate, maintenance costs and degree of market
penetra-tion are shown to have the greatest effect on energy cost. Pumping power and heat loss are found to be relatively insignificant cost items.
Proper phasing of system inplementation with urban growth is shown to be very important. Initial use of temporary heat sources located near the
loads coupled with implementation of only local piping networks is advantageous for present gas and oil prices if the urban growth occurs over a period of 15-30 years. There is shown to be an economically
optimum time for conversion to a large centralized thermal energy source. Several potential institutional barriers to district heating system implementation are identified. These barriers will be more difficult to overcome than any technical or economic barriers, and success in over-coming them will determine the national significance of district heating. Given positive government efforts to overcome the institutional barriers, district heating can play a major role in the U.S.
The author is deeply indebted to Professors David J. Rose and Leon R. Glicksman. Both have given generously of their time in spite of very busy schedules, and their guidance has been invaluable in com-pleting this work. More importantly, working with them has been a pleasure, and the personal and professional examples they set will be remembered by the author long after the thesis has been forgotten.
Professor Michael W. Golay and Messrs. William R. Mixon and John T. Meador of the Oak Ridge National Laboratory have offered many help-ful suggestions which are gratehelp-fully acknowledged.
Ms. Kristine Hunter, Evelyn Polizzi, and Pamela Dodd have done a commendable job of deciphering the author's scribbling and turning it into a readable final product.
Most of all, however, the author wishes to thank his wife, Alice, and children, Amy and Eric, for their patience and constant encourage-ment during this work.
Abstract Acknowledgements Table of Contents List of Figures List of Tables Chaoter I 1.1 1.2 1.3 1.4 Chapter II 2.1 2.2 2.3 2.4 2.5 2.6 Chapter III 3.1 3.2 Introduction
District Heating Outside the U.S. District Heating Studies for the U.S. Structure of Report and Significant Accomplishments
References
Introduction
Fossil Furnace Option All-Electric Options
2.3.1 Electric Resistance Heating 2.3.2 Electrically-Driven Heat Pumps
Condenser Temperature Water-Heat Pump Option District Heating Option
Conclusions References
Static Urban Model Analysis Introduction
Urban Structure and Piping Network Structure
2 3 4 7 9 10 11 13 15 17 20 22 23 29 29 31 41 46 50 51 55
3.3 Thermal Distribution Svstem'
3.3.1 Heat Carrying Medium 71
3.3.2 Building Thermal Requirements 73
3.3.3 Pipe Selection Methodology 77
3.3.3.1 Distribution System Design 78 3.3.3.2 Transmission System Design 80
3.3.4 Major Cost Items 82
3.3.4.1 Capital Costs 82
3.3.4.2 Maintenance Costs 87
3.3.4.3 Lost Electrical Power Costs 88
3.3.4.4 Pumping Power Costs 90
3.3.5 Computer Program Description 92
3.3.5.1 Methodology 92
3.3.5.2 Assumptions 95
3.3.5.3 Selected Intermediate Results 97
3.4 Base Case Results 99
3.5 Sensitivity Analyses 104
3.5.1 Interest and Maintenance Costs, Capital Costs 104
3.5.2 Electricity Costs 107
3.5.3 Population 107
3.5.4 Population Density 110
3.5.5 Penetration Fraction 112
3.5.6 Plant-City Separation 113
3.5.7 Coincidence Factor and Design Temperature 113
3.6 Conclusions 117
4.3 4.4 4.5 Chapter 5.1 5.2 5.3 5.4 5.5 V Chapter VI
New City Case
Institutional Factors Affecting Implementation Conclusion
References
Institutional Problems Associated with District Heat Introduction
Financing the System
Ownership of the District Heating System Determination of Energy Prices
Conclusion References
Conclusions and Recommendations
Appendix A Appendix B Appendix C Appendix D Appendix E Appendix F Appendix G
Pipe Cost Data
Lost Power Calculations Miscellaneous Cost Items Building Load Data
Pipe Size Results
Computer Program Listing
Effects of Fuel Price Escalation on Initial Comparison of Options
Biographical Note 134 148 154 155 ing 156 159 163 165 169 171 172 177 193 205 210 213 223 230 233
2.1 Technology Options 21
2.2 Basic Heat Pump Components 26
2.3 Actual versus Carnot COP's 28
3.1 Characteristic Populations and Development Times;
Proposed U. S. New Cities 56
3.2 Pipeline Design 60
3.3 Subsection Design 61
3.4 Entire City 62
3.5 Subsection Design. Apartment Building Urban Model. 63 3.6 Entire City Structure. Apartment Building Urban Model. 64 3.7 House Model Subsection Distribution System 66
3.8 House Model Transmission Network 67
3.9 Apartment Model Subsection Distribution System 68
3.10 Apartment Model Transmission Network 70
3.11 Installed Pipe Cost Comparison 85
3.12 Flow Scheme for Computer Program 93
3.13 Input Data for Computer Program 94
3.14 Annual Cost Variation with Pipe Diameter 98 3.15 Effect of Interest Rate plus Maintenance Cost Variations 105 3.16 Energy Cost Variation with Electricity Cost 108 3.17 Transmission Cost versus Population Served 109 3.18 Effect of Population Density on Energy Cost 111 3.19 Effect of Penetration Fraction on Energy Cost 114 3.20 Effect of Plant-City Separation on Energy Cost 115
4.1 "Instantaneous" Energy Cost (diring Development; Development
Times (tD): 5, 11, 20 years Apartment Building Urban Model 128 4.2 "Instantaneous" Energy Cost during Development; Development
Times (t ) of 5, 11, and 20 years Single Family House Model
25% Initial Penetration Fraction 129
4.3 "Instantaneous" Energy Cost during Development; Development
Times (tD) of 5 and 11 years Single Family House Model 130 4.4 Levelized Energy Cost as a Function of Time to Achieve 100%
Penetration 131
4.5 Apartment Building Urban Model Piping Network (54,000 total
population) 135
4.6 Apartment Building Urban Model - Effect of Implementation
Time for 5 years Development Time 137
4.7 Apartment Building Urban Model - Effect of Implementation
Time for 10 years Development Time 133
4.8 Apartment Building Urban Model - Effect of Implementation
Time for 15 year Development Time 139
4.9 Apartment Building Urban Model - Effect of Implementation
Time for 20 years Development Time 140
4.10 Apartment Building Urban Model - Effect of Implementation
Time for 25 years Development Time 141
4.11 Apartment Building Urban Model - Effect of Implementation
Time for 30 years Development.Time 142
4.12 Levelized Temporary Heat Source Costs for Growing City (Fossil
Fuels used indefinitely) 145
4.13 Levelized Temporary Heat Source Costs for Growing City (Fossil
Fuels used temporarily) 146
4.14 Fossil Fuel (Oil) use during System Implementation Apartment
Building Model; 54,000 people 149
2.1 Gas Furnace Option (Single Family Houses) 24 2.2 Gas Furnace Option (Low-Rise Apartment) 25
2.3 Resistance Heating Option - House Model 30
2.4 Heat Pump Options - House Model 32
2.5 Sensitivity of Annual Costs to Electricity and
Interest Rates 33
2.6 CTW - Heat Pump Option - House Model 37
2.7 CTW - Heat Pump Option - Apartment Model 38
2.8 Costs of Delivered Heat from a 125°F
Water Distribution System 40
2.9 District Heating Option - House Model 44
2.10 District Heating Option - Apartment Model 45
2.11 Comparison of Options 47
3.1 New Town Development Statistics 57
3.2 Percent of Households Living in Specified
Unit Type 59
3.3 Homes Spent in 5F Temperature Bands
-10-Year Average 75
3.4 Network Cost Variables 83
3.5 Effect of Urban Congestion on Installed
Pipe Costs 86
3.6 Relevant Parameters 100
3.7 Costs by Components 102
3.8 Effect of Coincidence Factor and Design
Temperature on Energy Cost 118
CHAP' ER I INTRODUCTION 1.1 Introduction
With the prospect of steadily increasing oil and natural gas prices and of inadequate supplies of these fuels in the near future (1), the energy supply for heating buildings in the future becomes uncertain. Most of the U.S. population live in urban areas, and the trend is toward increasing urbanization (2). The high population density of cities offers the opportunity to apply special energy supply techniques not applicable
in rural areas; this study focuses on some of these special techniques. A large source of free or very low cost energy is generally avail-able near cities, namely, an electricity generating plant. A modern nuclear plant, for example, discharges about 2.1 units of thermal energy
into the environment for each unit of electrical energy produced. This thermal energy is discharged at the lowest possible temperature, usually less than lOOF, to maximize electricity generation efficiency. This temperature is rather low for direct use in space or water heating appli-cations. Two remedies appear for this problem, both of them quite
expensive to implement. First, by sacrificing some electricity generation capacity, the temperature can be increased to a more useful level and the thermal enerqy distributed to the users by hot water or steam. Second, low temperature water can be distributed and used as a heat source for heat pumps located at the points of use. A heat pump, with the addition of some electricity, extracts energy at a low temperature and supplies energy at a higher temperature. To assess the practicality
This study is in reality a series of increasingly detailed analyses which focus on increasingly specific problems. First, an overall compari-son of the above energy supply options is undertaken to identify the most appropriate areas for detailed analysis. Second, one of the options, district heating with high temperature water, is identified as the prime target and analyzed using reasonable economic assumptions and idealized new city urban models. Finally, sensitivity analyses are performed to demonstrate the effects of variations in the economic parameters, urban characteristics, and system implementation pattern. Some of the institu-tional problems associated with district heating are also identified. 1.2 District Heating Outside the U.S.
District heating has been used in the U.S., Europe, and the U.S.S.R. throughout most of the twentieth century, though only to a relatively small extent. Partially because of the large amount of reconstruction following World War II, district heating has become very popular in Europe and the U.S.S.R. and is recognized as an important energy conservation measure. Strong government encouragement, particularly in the U.S.S.R., Finland, Sweden, Denmark, and Western Germany, has aided rapid system growth (5). Western Germany has at least 22 large combined heat-electric systems. In the U.S.S.R., more than half of all domestic thermal demands are supplied by combined heat-electric stations (7). District heating penetrations of 78% and 98%, respectively, have been achieved in the
that 50% of all Danish demand, 70% of all*Swedish demand, and 50-60 of all Finnish demand will be supplied by district heating. District heating is favored by a longer heating season in the Scandinavian countries, but this alone is insufficient to explain its relatively greater success than in the U.S.
Much of the success of district heating in these countries can be attributed to favorable government policies. All new thermal plants in Sweden must be combined heat-electric rather than electric only. Sweden has some advantage in that the energy supply industry is semi-public, and that a greater degree of planning and government control has been accepted in the past than in the U.S. Similarly, Finland has succeeded in rapidly implementing district heating because a single authority is responsible for both heat and electricity. Denmark approves potential district heating schemes and then guarantees them economically and technically. Scandinavian utilities are not allowed to show profits or losses, which helps to hold down consumer costs; surplus income is normally used to finance extensions or modifications of existing systems.
The government commitments to district heating in the U.S.S.R. and Western Germany are illustrated by news of tentative plans for regional district heating grids (7, 9). Regional grids would cause energy costs and heat losses to be slightly greater than for unconnected local
systems, but would increase load diversity and system energy storage capacity and would allow the use of a greater variety of fuels. Oil and natural gas could be eliminated as fuels in utilities in this way.
1.3 District Heating Studies for til) U.S.*
Recent increases in oil and natural gas prices have rekindled interest in district heating in the U.S. Analytical efforts to date have not matched the sophistication of the European efforts, notably Swedish research (10,11), which has addressed the problems of growth, improved distribution and end use technologies, and use of large nuclear plants as energy sources.
Most U.S. studies have focused on district heating for new towns or on smaller scale (1000 dwelling units) total energy systems. The best known study of the first type was done at Oak Ridge National Laboratory in 1971 (12). It focused on district heating with high temperature water for a new city of 389,000 people and a Philadelphia climate. The energy source was assumed to be a nuclear reactor. Cost estimates were based on accepted engineering practice, but the
economic optimization of the system was not considered in detail, nor were the problems of urban growth or end use equipment.
Because new cities experienced many problems in the 1960s, the Department of Housing and Urban Development now emphasizes smaller
developments of 300-1000 dwelling units. The Modular Integrated Utility System (MIUS) program thus emphasizes integrated utility systems for these small developments. Many problems characteristic of small systems will differ slightly from those of large scale district heating systems, but many problems are common to large and small systems. Consequently, much of the MIUS research is useful to district heating studies (13, 14, 15, 16, 17, 18, 19). Besides providing useful technical information, the MIUS developments may serve as an interim step toward large
integrated district heating systems.
Military bases are attractive targets for total energy systems because they will have few political problems associated with system
implementation or thermal plant siting. Total energy systems for Army bases (Fort Bragg and Fort Knox) have been considered in detail by Stetkar (20) and by Best et. al. (32).
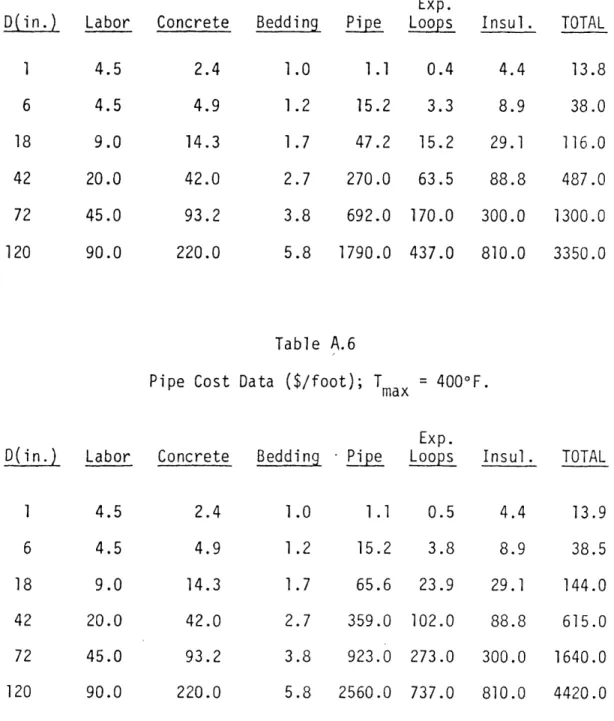
The transmission of thermal energy from the plant to the users will contribute significantly to energy cost, especially if electricity generating plants remotely sited from cities supply thermal energy for district heating. However, the economics of scale are important in thermal energy transmission (21), and at least one study presents results in-dicating that long distance (30-60 kilometers) energy transmission is economically feasible (22). As shown in Appendix A (Figure B.2), the costs used in that study favor large diameters, however, and have a functional dependence on diameter that is strikingly different than costs obtained from other sources.
Several studies of district heating systems have been restricted to specific locations. The studies were generally done by utilities proposing to expand existing systems (23,24,25). Such studies suffer the handicap of containing little innovation because of the constraints
imposed by the need to be compatible with existing systems.
Large scale district heating studies have just begun at several
national laboratories (26,27,28,29,30,31). Interest appears to be growing rapidly among government officials and funding agencies (See, for
example Reference 32), indicating that district heating may finally be taken seriously in the U.S.
As mentioned above, this study is a series of increasingly detailed and specific analyses. In Chapter II an initial comparison is made for electric resistance heating, heat pumps, the combination of distribution of power plant condenser temperature water and heat pump, district heating, and gas furnaces. This initial comparison serves the purpose of identifying the best prospect for further, more detailed work.
In Chapter III a detailed examination of the district heating option begins. Urban models and piping network structures are chosen. Given a set of assumptions concerning economics and urban characteristics, base case costs for district heating for each urban model are obtained. A computer program is used to select pipe sizes for the networks based on minimization of life cycle costs.
Several studies mentioned above and listed in the references have obtained results comparable to the base case cost estimates, and it is really the remainder of the thesis that contains significant additions to published literature concerning district heating. The final sections of Chapter III contain sensitivity analyses showing the effect on the base
case costs of variations in key economic and urban parameters. These analyses show areas where uncertainities in costs are more important and define areas needing further study.
In Chapter IV one of these areas, the effect of urban growth and finite system implementation times, is analyzed in more detail. This topic has been neglected in other published studies, but is shown to be very important to system economics. As shown from the U.S.'s experience in developing new cities, urban growth is very difficult to predict, and
tion. Thus, it is quite important that potential developers be aware of the flexibility or lack of it available in successfully implementing a district heating system. The material presented in this chapter, or similar results for a specific site obtained by using the approach developed, should prove quite helpful for this purpose.
Chapter V describes briefly some of the potential institutional
obstacles to district heating implementation. The need to limit the scope of the study to a manageable thesis curtailed the work done in this area greatly, but this chapter contains ideas which the author hopes may serve as seeds for further work. If nothing else, this chapter is significant because it illustrates the meager amount of knowledge concerning
REFFR!ENCES
Chan)ter I
1. Energy: Global Prospects 1985-2000
Report of the Workshop on Alternative Energy Strategies, Carroll
L.
Wilson, Project Director, McGraw-Hill Book Co., 1977.
2. Planning for a Nation of Cities
S.
B.
Warner, Jr., Editor, The MIT
Press, Massachusetts Institute
of Technology, Cambridge,
Mass., 1966.
3. "Improving Heat Pump Performance Via Compressor Capacity Control
-Analysis and Test"
Carl C.
HillPr and Leon R.
Glicksman, Energy Laboratory Report No.
MIT-EL 76-001, January 1976.
4. Urban Space Heating with a Heat Pump-Condenser Temperature Water
System
Wee T.
Yee, MIT Thesis, Department of Mechanical Engineering, 1976.
5. "Why Waste All That Heat?"
A.
Ernest Haseler, District Heating, April-May-June, 1975, p.
22.
6. "One Danish Home in
Three Has District Heating Service"
W.
Mikkelsen, Energy International, October 1976, p.
19.
7. "Germany Looks Toward Nuclear District Heating"
Dr. Hans-Peter Winkens, District Heating, Oct.-Nov.-Dec. 1975, p.
22.
8. "Heat Distribution: A Trend in
Energy Alternatives"
N.
Jenkins, Energy Policy, March 1975, p.
82.
9.
"Soviet Plans Unfold for Regional eating Grids"
N.
Sniss, Energy International, Oct. 1976, p.
32.
10. "Low Temperature Heat Systems, Part I,
Waste Heat Utilization Potential
with Conventional and Newer Technology"
P.
Margen and K.
Larsson, Report AE-VS-180, December 1975.
11. "Low Temperature Heat Systems, Part II,
Computer Model for the
Optimiza-tion of District Heating System"
K.
Larsson, Report AE-VS-181, December 1975.
12. "Use of Steam
-
Electric Power Plants to Provide Thermal Energy to
Urban Areas"
A. J. Miller,
et
al, Oak Ridge National Laboratory, Report ORNL-HUD-14,
January 1971.
J. T. Meador, Oak Ridge National Laboratory, Report ORNL-HUD-MIUS-22, May 1976.
14. "MIUS Systems Analysis, Comparison of MIUS and Conventional Utility Systems for an Existing Development"
E. C. Hise, et al, Oak Ridge National Laboratory, Report ORNL-HUD-MIUS-20, June 1976.
15. "MIUS Technology Evaluation, Compression Refrigeration Systems for Air Conditioning"
C. J. Claffey and C. L. Segaser, Oak Ridge National Laboratory, Report ORNL-HUD-MIUS-19, February 1976.
16. "M1IUS Technology Evaluation, Lithium Bromide - Water Absorption Refrigeration"
H. R. Payne, Oak Ridge National Laboratory, Report ORNL-HUD-MIUS-7, February 1974.
17. "MIUS Systems Analysis, Initial Comparisons of Modular-Sized Integrated Utility Systems and Conventional Systems"
G. Samuels, et al, Oak Ridge National Laboratory Report ORNL-HUD-MIUS-6, June 1976.
18. "MIUS Technology Evaluation - Thermal Energy Storage Materials and Devices"
C. L. Segaser, Oak Ridge National Laboratory, Report ORNL-HUD-MIUS-23, November 1975.
19. "Technology Assessment of Modular Integrated Utility Systems"
iW. R. Mixon, et al, Oak Ridge National Laboratory, Report
ORNL-HUD-MIUS-25, December 1976.
20. On the Design, Simulation, and Policy Implications of Total Energy, Systems
J. Stetkar, Environmental Engineer Thesis, Department of Nuclear Engineering, MIT, May 1976.
21. Underground Transmission of Heat
E. O. Ayorinde, Department of Mechanical Engineering, MIT, M.S. Thesis, August 1973.
22. "Long Distance Heat Transmission with Steam and Hot Water"
H.W.C. Aamot and G. Phetteplace, Corps of Engineers, U.S. Army Cold Regions Research and Engineering Laboratory, October 1976.
23. "The Southwest Bronx Study"
Consolidated Edison Company of New York, 1973.
24. "Utilization of Low Temperature Heat from Steam-Electric Power Plants: Techniques, Economics, and Institutional Issues"
District Heating Study" o
Volume The Main Study, Report prepared for the Steering Committee by a study team comprised of staff of J. F. Maclaren, Ltd., City Departments and Toronto Hydro, December 1973.
26. A. S. Kennedy, Asst. Director, EES Division, Argonne National Labora-tory, private communication, April 1977.
27. "A Preliminary Program Plan for Community Systems: Advanced Technology Mix Energy Systems (ATMES)"
Energy and Environmental System Division, Argonne National Laboratory, January 1976.
28. "Factors Influencing the Acceptance of New Energy - Efficient Community Design Concepts and Energy Supply Systems"
Energy and Environmental Systems Division, Argonne National Laboratory, January 1976.
29. W. R. Mixon, Manager, HUD Utilities Program, Oak Ridge National Laboratory, private communication, April 1976.
30. "Prospects for District Heating in the U.S."
J. Karkheck, J. Powell, and E. Beardsworth (Brookhaven National Labora-tory), Science, 195 (998), 1977.
31. "Large City District Heating Studies for the Minneapolis-St. Paul Area" M. A. Karnitz and A. M. Rubin, Oak Ridge National Laboratory, Report ORNL/TM-6283, May 1978.
32. Cong. record speech by Senator Gary Hart of Colorado, Congressional Record - Senate, Volume 123, No. 68, p. 56319, April 25, 1977.
CHAPTER II
INITIAL COMPARISON OF ALTERNATIVES
2.1 Introduction
The material presented in this chapter is an initial comparison of selected alternatives for providing the energy requirements for space heating and water heating in new urban areas. This comparison serves to identify the best target of opportunity for further, more detailed analysis through the remainder of the eport. Figure 2.1 shows possible options for supplying space conditioning and water heating demands with electrical or thermal energy from a large utility heat source. From these options the following were chosen for this initial comparison: electric resistance heating, air-to-air heat pumps, the condenser temp-erature water-heat pump combination option, and the hot water district heating option. The gas furnace option is also included to provide a benchmark figure.
All options compared are based on available technologies; changes in the state-of-the-art of any of the technologies (e.g., piping installa-tion) could reorder their relative economics, but commercial acceptance of new technologies has always been a slow process, requiring ten to twenty years. The centralized options also allow efficient effluent control, which will produce a cleaner environment than possible for individual fossil furnaces. Other options, such as solar heating and synthetic fuels, are not considered below, primarily to limit the scope of the study, but synthetic fuels can be included in part by choosing an appropriate fuel cost for the gas furnace option.
o CM 0 . >o .- 0 0 -U F-ai
Two urban models are considered for each option (except resistance heating), a 100% single family house model and a 100% low-rise apartment building model. Mixtures of the housing types are found in practice, but consideration of such mixtures would add little to the analysis because of the difficulty in constructing meaningful urban models. In any case, these two models will identify the cost extremes, particularly for the options relying on water distribution.
Consistent assumptions about economic and energy use parameters are used to ensure comparable results for the various options. The
results illustrate the wide range of variation among options, from highly fuel intensive (gas furnaces and resistance heating) to highly capital intensive (district heating). These differences will influence policy decisions, depending on the relative weights given the different
variables. The remainder of the chapter is devoted to elaborating on the quantitative details.
2.2 Fossil Furnace Option
As the fossil furnace is now the lowest cost option, it is an appro-priate reference for comparing alternative heating methods. Also,
because it is the lowest cost option, its cost will be the primary determinant of when new options become economically attractive (insofar as fuel prices reflect scarcity rather than being fixed at artificially
low values).
The costs shown below are based on data obtained by Yee (1) for the Boston area. Equipment costs will be about the same for other locations, but fuel costs will vary. The interest rate, maintenance
gas cost of $0.403 per 100 cubic feet are used to estimate fuel costs. The gas cost is only ephemerally valid as it rises substantially year
by year. Furnace efficiencies are poorly documented, and values ranging from 50-75% are claimed.
This option differs from some options presented below in that it is fuel rather than capital intensive. If fuel oil were used rather than gas, the fuel intensiveness would be even more marked, because oil prices in the Boston area are about 20% higher than gas prices for equal heating values, and gas furnaces are generally more efficient than oil furnaces. The fuel intensiveness will increase as fossil fuel prices continue to rise as shown in Appendix G.
2.3 All-Electric Options
Electricity can be used for either resistance heating or heat pumps. These options differ primarily in that resistance heating is an energy intensive option, while the heat pump is capital intensive. High cost electricity favors the heat pump,'while high capital cost favors resistance heating.
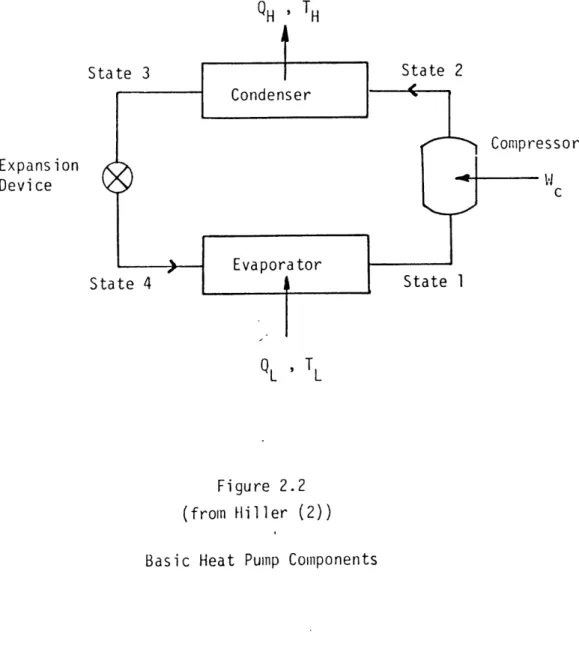
The basic principles of heat pump operation are discussed briefly here and in more detail in Reference 2. Figure 2.2 shows the basic com-ponents of a heat pump system. The device absorbs an energy QL.at a low temperature TL and discharges energy QH at the higher temperature TH, requiring a work input 'IC to accomplish the job. An energy balance on the heat pump system requires that
TABLE 2.1 GAS FURNACE OPTION (SINGLE FAMILY HOUSES)
ASSUMPTIONS
1. Urban Model: 100% single family houses; density and population irrelevant.
2. Heat Denand: peak, 48,800 Btu/hour; annual load 110 X 106 Btu. 3. End Use Equipment: gas furnace, capacity 49,000 Btu/hour;
ef-ficiency 65%; initial cost, $1800. 4. Interest Rate: 9%
5. Fuel Cost: $0.403 per 100 cubic feet; heat value 1022 Btu/cubic foot.
6. Maintenance Cost: 2%/year of initial cost.
7. Capital Costs: use capital recovery factor; furnace lifetime, 20 years. COST DATA PER UNIT ANNUAL INITIAL Capital: $197 $1800 Maintenance: or 6 $8.18/16 Btu Fuel: TOTAL 36 667 $900 $1800 __
TABLE 2.2 GAS FURNACE OPTION (LOW-RISE APARTMENTS)
ASSUMPTIONS
1. Urban Model: 100% low-rise apartment buildings; population and
density irrelevant here; 18 units/bldg., 1000 sq. ft./unit6
2. Heat Demand: peak, 416,000 Btu/hour; annual load 920 X 10 Btu. 3. End Use Equipment: gas furnace, capacity, 400,000 Btu/hour;
ef-ficiency, 65%; initial cost, $3500. 4. Interest Rate: 9,
5. Fuel Cost: $0.403 per 100 cubic feet; heating value, 1022 Btu/
cubic foot.
6. Maintenance Cost: 2%/year of initial cost.
7. Capital Costs: use capital recovery factor; furnace lifetime, 20 years. COST DATA Per Bldg. Annual Initial $383 Capital: Maintenance: Fuel: $3500 70 5581 TOTALS $6034 or 6 $6.56/1 0 Btu $3500
, TH
essor
L
Figure 2.2
(from Hiller (2))
Basic Heat Pump Components Expansion
performance (COP), defined as ti ratio of the heat output to the work input.
COP = QH/Wc = 1 + QL/Wc
The COP of a heat pump is always greater than one; that is, the heat pump always produces more heat energy than the work energy input.
Since the heat pump is a reverse heat engine, the maximum theoretical value of COP is the Carnot cycle COP.
COPCarnot = 1/(1 - TL/TH)
where TL = lower temperature of the cycle, and TH = higher temperature of the cycle.
The actually achieved COP of a heat pump is lower than the Carnot value because of system irreversibilities (discussed further in Appendix A). Figure 2.3 is a plot of the temperature variations of COPCarnot and of the COP of a typical air-to-air heat pump. Next generation heat pumps are likely to have COPs 20-30% higher than indicated. The high
temperature is fixed at 70F, and the low temperature is varied across the normal range of outdoor air temperatures. Fan powers are not included in the COP calculations, but would significantly lower the COP if included (by 20-30%).
Unfortunately, the COP does not tell the whole story. To maintain acceptable temperatures and humidities during summer air conditioning use, present day heat pumps are usually sized smaller than the ideal size for winter heating in the northern U.S. Consequently, below some outdoor air temperature, the balance point, the building thermal demand
I1 12 11 10 9 8
t
7 COP 6 5 4 3 2 1 0 T.. = 70°F H -20 -10 0 10 20 30 40 50 60 70 TL ( F) -Figure 2.3 (fromn Hiller (2)) Actual vs Carnot COP's, n
augment the heat pump capacity during these periods. For this reason, the seasonal average COP, often called the seasonal performance factor (SPF), is lower than the COP versus temperature curve might indicate.
With present air-to-air heat pumps, resistance heating must supply the entire load on days when the temperature is below about 1OF. (A fossil furnace backup was not considered in this study.) Therefore,
while the annual use of electricity is about two times more for resistance heating than for the heat pump, the peak electrical requirements are equal. Thus heat pumps do not reduce the required installed electricity generation
capacity and, in fact, lower the utility load factor. 2.3.1 Electric Resistance Heating
Results for resistance heating are obtained by using cost data presented in a Westinghouse study (3). The results and assumptions used are shown in Table 2.3 along with a sketch illustrating the position of this option in the technology option space.
2.3.2 Electrically-Driven Heat Pumps
The heat pump competes with resistance heating in space conditioning applications because it supplies more than one unit of heat per unit of electrical energy used, as explained above. However, the initial cost of a heat pump is quite high compared to resistance heating systems, and the reliability of heat pumps has been poor. Therefore, the heat pump penetration into the residential and commercial markets has been slow, but it is now increasing.
Air-to-air heat pumps accounted for most of the small unit (less than 50,000 Btu/hour) sales in 1976. Cost and performance data for this
Central Plant Coal--Nuclear
istant Site oca Site
Fuel Prod. Electricit Heat & Elec. Hea ec. Heat& A.C. Elec. Heat Elec. A.C.
Heat UIOS
ASSUMPTIONS
1. Urban Model: 100% single family houses; model independent of popula-tion or land area.
2. Heat Demand: 38,000 Btu/hr peak, 35,A00 kw-hrs annually (includes space heating and water heating).
3. End Use Equipment: Baseboard heaters; lifetime 20 years; associated equipment lifetime 40 years.
4. Interest Rate: 9.% (average Mass. mortgage rate, Nov. 1975). 5. Electricity Cost: 4.0t per kw-hr.
6. Maintenance Cost: 2% of capital equipment cost per year (excluding heating element costs).
7. Capital Cost Procedure: 1973 data updated to May 1975 via Chemical Engineering Plant Cost Index.
COST DATA
Item Annual Cost Per Dwelling Unit
Capital Charges: heating elements 68 assoc. equipment 48 Maintenance: assoc. equipment 10 Electricity: 35000 x .04 1400
Cost of Energy at Plant: included above
Energy Distribution Cost:: included above
Total Cost S1526
type of heat pump are readily available (3,4,5), but the data apply to units suitable for both heating and air conditioning. To adjust the cost to be consistent with the costs of alternative systems, the capital and maintenance costs were reduced to reflect costs for a heat pump used
only for space heating. The adjustments include reductions of 25; in the initial cost and 15% in annual maintenance costs. The assumptions and results of the analysis are summarized in Table 2.4.
The heat pump lifetime is uncertain; some studies use a lifetime of 20 years (this one included), but ten years may be more realistic. Using ten rather than twenty years in this analysis increases the annual cost from $1086 to $1172. The interest rate and electricity cost realized in practice will vary; the sensitivity of annual cost to changes in these numbers is illustrated in Table 2.5, all other assumptions being the same as in Table 2.4.
2.4 Condenser Temperature Water-Heat Pump Option
Large quantities of low temperature (80-10OF) heat are produced as
a by-product of electricity generation. Most of this energy is discharged into the environment (via cooling towers or water bodies) and is
consequently considered a nuisance. In northern regions of the U.S., the quantity of energy discharged at peak electrical output is about equal to the peak space and water heating load of residential and com-mercial buildings using the electricity generated. Therefore, the question arises "Can this wasted energy be used to supply the space and water heating demands of a city using the electricity?" The answer is, of course, that some of it might be used if the costs of distributing and using the energy are not prohibitive. Unfortunately, since thermal
Central Plant Coal--Nuclear
Distant Site oca Si te [Fuel Prod.[ Electricity | ( Heat &Elec.
Elec. Heat & A.C Elec. Heat Elec. A.C.
Resistance Heat Pumps
ASSUMPTIONS
1. Urban Model: 100% single family houses; model independent of popula-tion or land area.
2. Heat Demand: 38,000 Btu/hr peak; 35,000 kw-hrs annually (includes space heating and water heating).
3. End Use Equipment: Air-to-air heat pumps, COP = 2.0, capacity, 36,000 Btu/hr nominal, lifetime 20 years; ductwork lifetime 40 years.
4. Interest Rate: 9 %.
5. Electricity Cost: 4.0¢ per kw-hr. 6. Maintenance Cost: $51/yr.
7. Capital Cost Procedure: 1973 costs updated to May 1975 via Chemical Enqineerina Plant Cost Index.
COST DATA
Item Annual Cost Per Dwelling Unit
Capital Charges:
heat pump 191
ductwork and install. 144
Maintenance: 51
Electricity: (35000/2.0) x .04 700
Cost of Energy at Plant: included above
Distribution Costs: included above
Table 2.5
Sensitivity of Annual Heat Pump Costs to Electricity and Interest Rates ($/house);
20 Year Lifetime interest () 7.0 9.5 12.0 3.0 cents/kilowatt-hour 3.4 4.0 852 927 992 922 997 1062 1032 ! 1102 1172 5.0 6.0 1202 1277 1342 1372 1452 1522
into the environment during low demand eriods for thermal energy. The heat pump extracts thermal energy from an otherwise unuseable low-temperature source by using external energy (generally in the form of electricity). The most common energy source for a heat pump is air, but a heat pump using water as the energy source should be somewhat cheaper because of the reduced heat exchanger size. If the water temperature is constant, the output is independent of ambient air temperatures. The capacity and coefficient of performance of a heat pump both increase with source temperature, resulting in lower electricity and capital costs for the end use equipment. For this system to compete economically with the air-to-air heat pump, the cost reductions must at least compensate for the water distribution cost. It is shown below that this does not occur.
The economics of this scenario was considered in an approximate way in the initial stages of this study, and motivated by these early results, the analysis was redone more completely by Yee (1). Some selected results from his work are presented below in a slightly modified form to make all assumptions about electricity-costs, etc., agree within this chapter.
Although Yee considered three housing types (1-, 4-, and 12-unit buildings) and a range of densities for each, only two housing types
(1- and 12-unit buildings) and one density for each type are presented here. These are directly comparable to the hot water distribution system results presented in the following section. None of the omitted data alter the conclusion about this option, namely, that it does not appear economically competitive.
density of 2000 per square mile, and (b) all 12-unit low-rise apartment buildings at a density of 4000 per square mile. Yee's models and the
present models for the hot water distribution system case differ in that the present model populations are 54,000 for each model, while Yee used total populations of about 250,000 and 500,000 for the 1-unit and 12-unit models, respectively. As will be shown in the next chapter, however,
the energy costs are only weakly sensitive to total urban population. For other housing models (excepting high-rise) the energy cost will fall between the values for these models. The cost variation arises from two chief sources, the service line costs, which decrease with increasing numbers of dwelling units per building, and the distribution costs (other than service lines), which decrease with increasing thermal load density until competition for underground space among various utilities begins to drive costs up at high densities.
The Boston climate is used in Yee's analysis, and the annual heat loads for the two building types are 920 and 110 x 106 Btu for the 12-and 1-unit buildings, respectively, while the respective peak loads are 416,000 and 48,800 Btu/hour. These loads differ somewhat from those
used in the hot water system analysis, but the differences insignificantly affect the results.
The original idea was to distribute condenser temperature water, but Yee's analyses showed that increasing the sendout temperature at
the expense of some electricity generation capacity is economically advantageous. The results presented below assume a sendout temperature of 125F and a 40F drop across the system. Higher sendout temperatures
were not considered. The main economic advantage to higher sendout temperatures and associated larger temperature drops is the reduced cost of water distribution because of the smaller required flow rates.
One significant item ignored by Yee is the cost of remote plant siting; his data imply that the plant is located at the edge of the 36 square mile city. For larger plant-city separation distances, large additional costs will be incurred. The hot water system option (summarized in the next section and analyzed in detail in Chapter III) assumes a
separation distance of ten miles. Increasing the separation distance significantly increases the energy costs. The omission of this effect does not alter any of the conclusions about this option in this study, but the omission should be noted for future studies.
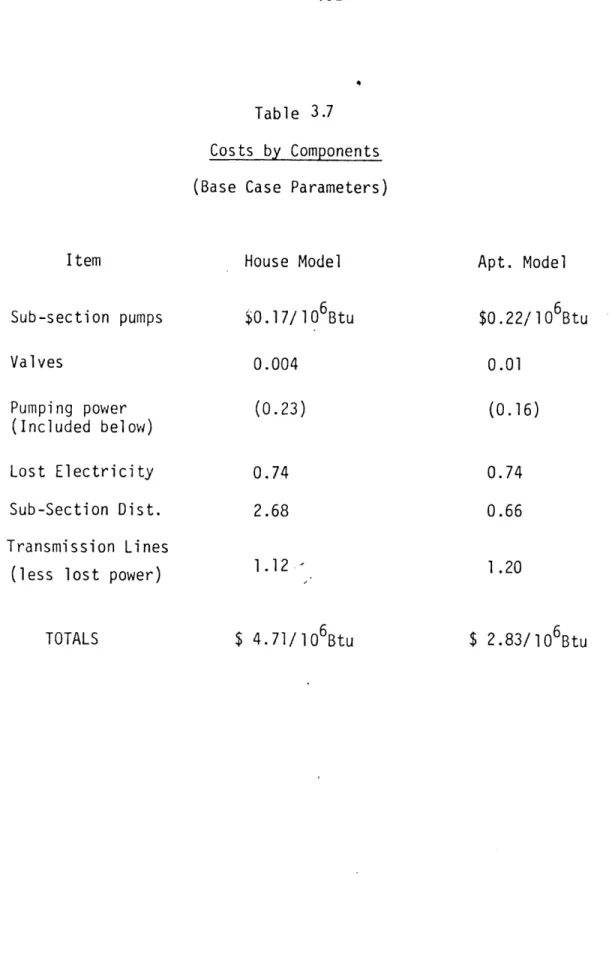
The assumptions and results of Yee's studies are presented in Tables 2.6 and 2.7. The dominant cost items for both urban models are the capital and maintenance costs. The latter costs are uncertain because of the lack of good data. An annual maintenance cost of 5 of initial costs is accurate for a steam distribution system, and is considered somewhat high for a high temperature water system. No data is available for low temperature water systems, but it should be remembered that the quantity of water circulated is large compared to a high temperature system, and that corrosion problems are often more severe for low
temperature systems than for high temperature systems. The electricity costs for driving the heat pumps are also large, but much reduced from the air-to-air heat pump case. Unfortunately, the capital costs of the distribution system exceed the savings in the heat pump costs, making this option economically unattractive compared to the air-to-air heat
Central Plant
Coal--lticlear
o ~ ~ ~ i~~
Distant Site Local Site
A~~~-- N
I
Fuel Prod. I ElectricityCond. . Water Stea
\eSr IChilled Liq.
IHeat Pump I ISpecial Uses ASSUMPTIONS
1. Urban Model: 100% single family houses; 2000 units per square mile; 250,000 people total in city.
2. Heat Demand: 48,800 Btu/hr peak per house; 110 X 106 (Including space and water heating).
Btu annually
3. End Use Equipment: Water-to-air heat pumps; SPF=2.5; capacity (nominal), 39,000 Btu/hr.
4. Interest Rate: 9%
5. Electricity Costs: $0.04/kw/hr for all $0.024/kwh for that.
except lost power cost and
6. Maintenance Costs: heat pump, $15/ton (one ton equals 12,000 Btu/hr), distribution system 5%/year of initial system cost.
7. Capital Costs: levelized costs via capital recovery factor; equipment lifetimes: heat pump, 15 yrs; piping network, 50 yrs; heat pump ductwork, 40 yrs; allowance for distribution system engineering costs, 15% of material costs.
COST DATA
PER UNIT Capital:
Heat pump and ductwork: distribution system: Maintenance: Heat pump: Distribution system: Electricity: Heat pump: pumping power Energy at plant: ANNUAL $385 427 INITIAL, $3640 4680 49 203 476 28 28 (lost power) TOTAL COST S1596 or 6 $14.5/10 Btu $8320 --IN. I .1Hea t Ej Heat I
I
Central Plant Coal--Nu l.ear r
mistanE it Local Site
Fuel Prod. Electricity Heat & Elec. Heat
Cond. T. Water HT Steam Chilled Liq.
Heat Pup [Special
Uses-ASSUMPTIONS
1. Urban Model: 100% low-rise apartment buildings; 12 units per building; 4000 buildings per square mile; total city pop-ulation 500,000.
2. Heat Demand: 416,000 Btu/hr peak load, 920 X 106 Btu annual load per building (12 units), including space and water heating. 3. End Use Equipment: Water-to-air heat pumps, SPF=3, capacity
nom-inal 200,000 Btu/hr (two units). 4. Interest Rate: 9%
5. Electricity Costs: $0.04 for all except lost power, and $0.024/kwh for that.
6. Maintenance Costs: heat pump, $15/ton; distribution system, 5%/yr
of initial cost.
7. Capital Costs: Use capital recovery factor to levelize cost; equipment lifetimes: heat pump, 15 yrs; piping network, 50 yrs; heat pump ductwork, 40 yrs; distribution system engineering costs, 15% of material costs.
COST DATA
PER BUILDING
ANNUAL INITIAL
Capital:
heat pump and ductwork: $3000 $28000
distribution system: 1404 13400 Maintenance: heat pump 252 distribution system: 672 Electricity: heat pump: 3600 distribution system: 216 (pumping power)
Energy Cost at Plant: 228
(lost power)
TOTALS
$9370 6 $41400
would be even greater. For thi; optiorr to compete with the heat pump, the initial capital costs of the distribution systems must be reduced by an order of magnitude, a very unlikely possibility. The only
probable source of cost reductions is the heat pump. Available water-to-air heat pumps are not significantly less expensive than air-water-to-air heat pumps of equal capacity nor are they significantly more efficient. It has been suggested that the cost of a water-to-air heat pump might be reduced by 30% from the cost of an equal-sized air-to-air heat pump because smaller heat exchangers are needed (5), but such a cost reduction does not alter the above conclusion.
The conclusion that the condenser temperature water-heat pump option is not economically attractive does not eliminate the possibility of using this energy without the heat pump. Low cost end use equipment, for example, cheap plastic heat exchangers being developed in Sweden, might still allow economic use of this energy.
The gas furnace energy cost was shown to be $8.18/106 Btu for a single family house and $6.56/106 Btu for a 12-unit low-rise apartment building (see Section 2.2). The delivered cost of energy in the form of 125F water (with a temperature drop of 40F) is summarized in Table 2.8. The
total costs are $6.24 and $2.74/106 Btu for single family houses and apartment buildings, respectively. Thus, for condenser temperature water to compete economically with gas as an energy source, the allowable costs for end use equipment are $1.94 and $3.82/106 Btu, respectively, for the two building types.
Using the annual thermal loads of 110 x 106 Btu for the house and 920 x 106 Btu for the apartment building, the allowable annual equipment
Table 2.8 - Costs of Delivered Heat from
a 125° F Water Distribution System; AT = 40 F; No Heat Pump ITEM HOUSE Capital Charge Maintenance Electricity Energy at Plant * TOTAL COSTS $427 203 APT. BUILDING $117 56 28 18 28 $686 or $6.24/ 106Btu 19 $210 or $2.74/ 106 Btu
*Busbar cost of electricity sacrificed because of 125F discharge temperature rather than 90F.
Using a nine per cent interest ate, a'30-year lifetime for equipment, and two per cent of initial costs for annual maintenance costs, one obtains a maximum initial equipment cost of $1820 for the house and $29,900 for the apartment building if total energy costs are to compete with gas furnace energy costs.
Using fan coil unit.costs from Building Construction Cost Data 1976, by Robert S. Means, together with an estimate of one dollar per square foot for ducting yields initial equipment costs of $2250 for a house and $21,400 for an apartment building. The low temperature water option
is still unattractive for the single family house in cumparison-to either the gas furnace or district heating. However, this option is now competitive
with the gas furnace option but not with district heating for low rise apartment buildings. Lower cost end use equipment could make this option economically attractive, but this is a topic for another study.
2.5 District Heating Option
Condenser temperature water and heat pumps do not make an attractive option because two high-capital-cost items are combined. Since the
economics of the air-to-air heat pump option was presented earlier, it seems quite natural that a system relying on higher temperature water without need of a heat pump should be analyzed. This turned out to be
the best scheme of all.
Water and steam are currently the only widely accepted heat carriers for district heating. Steam is commonly used in the U.S., largely for historical reasons, while hot water is commonly used in the rest of the world. Hot water was selected for the purposes of this study because
it has been shown to be the more economical of the two in most instances (6,7).
Though some effort is aimed toward development of low cost space heating equipment which uses low temperature water (80-120F), equipment now available requires higher water temperatures, generally in the range 140-220F. Since the premise of this study is that only available
technologies be considered, the analysis is based on the higher sendout temperatures. Sendout and return temperatures of 220F and 160F, respec-tively, were chosen for the distribution system analysis.
Details are presented in Chapter III, which is devoted to an analysis of this option, but a few comments facilitate a comparison of this option to the other options. Similar urban models are used for the condenser temperature water-heat pump option and the district heating option, namely, 100% single family houses and 100% low-rise apartment buildings. The populations and thermal loads are different, but this has no
signifi-cant effect on the results. Part of the thermal load difference arises from the different choice of climates; Yee (1) used a Boston climate, while this study assumes a New York City climate. But most of the
difference arises from building model differences. Yee used heat load data for existing buildings, while this study assumes that buildings meet ASHRAE 90/75 guidelines. For the single family house, ASHRAE 90/75
standards make little difference, and the load structures are similar for the two studies. For apartment buildings, the hot water load is more important in this study than in Yee's, and as a result, the load
factor is significantly higher. The probable result is a slight favoring of district heating for low-rise apartment buildings, but little effect
for the single family house model.
End use equipment costs are estimated from data obtained by Yee (1). For single family houses, his costs are used directly, but for low-rise apartment buildings, the data must be adjusted to reflect lower peak loads.
It is assumed that half of the equipment cost is constant, independent of the capacity, and the other half scales linearly with capacity. The costs obtained this way are:
single family house: $2120 apartment building : $12100
For an equipment lifetime of 30 years and an annual maintenance cost equal to two per cent of initial cost, the annual equipment costs are:
single family house: $250 or $2.1/106 Btu apartment building : -°$1420 or $1.3/106 Btu
The plant location is assumed to be ten miles from the city for these calculations. Varying this distance will have a large, though not dominant, effect on energy costs as shown in the next chapter. The larger is the total thermal energy demand, the weaker the effect.
The piping network costs for the hot water distribution system apply to the new city case. For an existing city, pipe costs would be higher, and consequently, energy costs would be higher. This cost dependence is considered in Chapter III.
Costs and assumptions for the district heating analysis are presented in Tables 2.9 and 2.10. The economic analysis gives reason for optimism regarding the district heating system. This optimism is tempered
Coal--tiuclear
Distant Site |Local Ite
Fuel Prod. Electricity Heat & Elec. Heat
ICond. T. Water |Steam IChilled Liq. Storage pace Cond.
Water Heat ASSUMPTIONS
1. Urban Model: 100% single family houses; 1700 units per square mile total city population, 54,000.
2. Heat Demand: peak load, 45,000 Btu/hr; 120 X 106 Btu annual load (includes space and water heating).
3. End Use Equipment: Hydronic heaters (e.g. Beacon-Morris Co., Inc. equipment), several units per house chosen to meet peak load; installed cost; $2120.
4. Interest Rate: 9%.
5. Electricity Costs: $0.04/kwh for all except lost power cost, $0.024/ kwh for that.
6. Maintenance Costs: 2%/yr. of initial cost of end use equipment; 5%/yr of initial cost for distribution system.
7. Capital Costs: use capital recovery factor to levelize costs; equipment lifetimes, 30 years.
8. Distribution System: water sent out at 2200F, returned at 160OF; dual steel pipe in concrete envelope.
COST DATA PER UNIT
ANNUAL INITIAL Capital:
end use equipment: $206 $2120
distribution system: 297 3050
Maintenance:
end use equipment: 42
distribution system: 152
Electricity:
pumping power 28
Energy Cost at Plant:
Lost Power 89
TOTALS $814 6 $5170
entral Plant, Coal--Nuclear
Distant Site Local Site
Fuel Prod. JElectricity Heat & Elec. eat
Cond. T. l 3 ,Steam Water Chilled Liq. I
Storjaej Space Cord.
Water Heat
ASSUMPTIONS
1. Urban Model: 100% low-rise apartment buildings, 18 units per building, 4500 dwelling units per square mile; total pop-ulation 54,000.
2. Heat Demand: peak load, 300,000 Btu/hr; annual load, 1080 X 106 Btu (includes space and water heating).
3. End Use Equipment: Hydronic heaters, several units per building chosen to meet peak load; installed cost of heating system, $12,100.
4. Interest Rate: 9%.
5. Electricity Costs: $0.04/kwh for all except lost power cost, $0.024/kwh for that.
6. Maintenance Costs. 2%/yr of initial cost for end use equipment; 5%/yr of initial cost for distribution system.
7. Capital Costs: Use capital recovery factor to levelize costs; equipment lifetimes, 30 yrs.
8. Distribution System: water sent out at 2200F, returned at 1600F; dual steel pipe in concrete. envelope.
COST DATA
PER BUILDING
ANNUAL INITIAL
Capital:
end use equipment: $1180 $12,100
distribution system: 1380 14,150
Maintenance:
end use equipment: 242
distribution system: 708
Electricity:
pumping power 173
Energy Cost at Plant:
Lost Power 799
TOTALS $4482 6 $26,250
somewhat in Chapter III by a glimpse at some of the possible economic pitfalls, but the rewards for successful implementation are substantial, from both economic and energy conservation points of view.
2.6 Conclusions
Table 2.11 shows the results for the above analyses. The gas furnace costs less than all other options except district heating, but recent rapid rises in gas prices (e.g., to 14.2~/100 cubic feet at the well-head in interstate commerce with more rises to come) make the gas option
less attractive and even less realistic in future years. Of course, the district heating option costs relate to new cities, but the margin is sufficient to allow for large increases in energy costs (the most probable cause for a cost increase in old cities, higher pipeline costs, is discussed in Chapter III). If probable oil and gas prices are con-sidered, district heating is even more attractive.
Present-day heat pumps produce energy that is considerably more expensive than that from either of the two cheaper options, even when an unrealistically long 20-year lifetime is assumed. If electricity prices increase less rapidly than gas prices, quite a likely prospect, the heat pump might compete with the gas furnace.
The condenser temperature water-heat pump option is far too expensive to compete with any other option except resistance heating. High capital costs are responsible for this; the electricity cost savings associated with improved heat pump performance is overcome by distribution system
capital costs. The district heating option is clearly superior to the
condenser temperature water-heat pump option.
L) QI v3 1<: E3 C I.L C.. CL I--< '- - I .') -'= CL Z ·. J ID - I I- ,- I CL --) aQ) QL -J 0 := O LA O C LA CO C O C m C CC --C, Co cc _0 4 4 c- L.) .0 t o w C3 COi co CO O r--- - - -o = c ' L -E C)4' C m Ct (N O LA ---0 co LA ,Kr co Ln 7 C9 Ln Co Do ko 4-U ) O W 0 a La cc 19 co o Cn C ci C cc C 0 cc C) -- O- - -o C) o o C) ms m - ---- 4-w co w D " -.- to U- .I c-C -r-c) O O I___ I___ 4-co CL IA .tI CLO LM a 1-4 03 r-4 tD cc 4-Ln CN C 00 C O C o (Nj C. C C C) '-4 IA c I O p 0 , . LA In 4-0 c Q) 4-U I"3 ,. n3 41 'a ,I-al 13 CJ tY LA 0 4-' C. 4-o o 0 LA .E CL E 0 N a) :3D C) Li I - · I .-4' >
options may compete with district heating (actually, there are several reasons). A comparison of the house cases illustrates the relatively large capital investment required for district heating. Two problems are associated with this high capital cost; if the consumer were required to pay the entire initial cost of the end use equipment and the distri-bution system, consumer acceptance would be quite difficult as the
initial cost is much higher than that of the heat pump system. However, the consumer is likely to pay only the cost of the end use equipment initially (about $2200 for the house model), and this cost is comparable to the cost of the gas furnace system. The remaining initial investment is likely to be borne by the utility company (or other developer) and poses a different problem. There are large elements of risk associated with district heating system implementation which might make capital attraction difficult for the developer, thus retarding implementation.
The relative contributions to total energy cost by the various components reveal essential differences among the options. The options vary from being very fuel intensive (resistance heating and the gas furnace) to very capital intensive (district heating). The low tempera-ture water-heat pump option suffers from having both high capital costs and high fuel costs, which is clearly the reason for its demise. One might be tempted to conclude that the energy costs at the plant are higher
for the distributed water options than for the other options, but this is merely an artifact of the inclusion of electricity transmission costs and
fossil fuel delivery costs with fuel costs.
There are major differences between the options in the total primary energy use and in the type of fuel used to supply the primary energy.
All options except the gas furnace optiorn can rely on coal or uranium as the primary energy source. No scarce oil or gas resources are needed. The condenser temperature water-heat pump option and the district heating option require much less primary energy than the other options. The percentages shown for these options are extremely low compared to the others because only the primary energy needed to generate electricity for power, heat pumps, and sacrificed electricity are included. The thermal energy actually put into the pipeline can be considered free if it is assumed that electricity would be generated anyway, because most of the energy would be discharged by the plant cooling system.
The primary conclusion of these analyses was that district heating with hot water warranted closer examination. The remainder of this study is devoted to that task.
REFERENCES CHAPTER II
1. Yee, Wee T., Urban Space Heating With a Heat PumD Condenser Temperature Wlater System, M.S. Thesis, Department of Mechanical Engineering, M.I.T., 1976
2. Hiller, Carl C., and Glicksman, L.R., "Improving Heat Pump Per-formance Via Compressor Capacity Control-Analysis and Test,"
Energy Laboratory Report No. MIT-EL 76-001, Heat Transfer Lab-oratory Report No. 24525-96, January 1976
3. Dunning, R.L., "Comparison of Total Heating Costs with Heat Pumps Versus Alternate Heating Systems," Westinghouse Report
PSP 4-2-73.
4. Hammond, 0., and Zimmerman, M., "The Economics of Coal-Based Synthetic Gas," Technology Review, July/August, 1975, pp.42-51 5. Jaster, H., Manager, Heat Pump Development Division, General
Electric Company, Schenectady, N.Y. Private Communication, 1975.
6. Aamot, H.W.C., and Phetteplace, G., "Long Distance Heat Trans-mission with Steam and Hot Water," Technical Note, Corps. of Engineers, U.S. Army, Cold Regions Research and Engineering Laboratory, October 1976.
7. Mixon, W.R., Group Leader, Modular Integrated Utility System Project, Oak Ridge National Laboratory, private communication, March 1977.
CHAPTER III
STATIC URBAN MODEL ANALYSIS
3.1 Introduction
This chapter is devoted primarily to a discussion of the economics of district heating for a new city with the heating system installed at a fixed point in time. Systems and cities are not built instantaneously, of course, but a treatment of growth effects is postponed until next chapter. While the emphasis is on new cities, the costs for an old city are compared to those for a new one later in this chapter. Because new cities have not been very successful in the U.S., it is probable that most opportunities for district heating will be found in existing urban
areas, and this is where district heating must succeed if it is to have a significant impact on national energy conservation; thus, this comparison is very important. Nevertheless, the effects of variations in important parameters may still be shown satisfactorily with new city data.
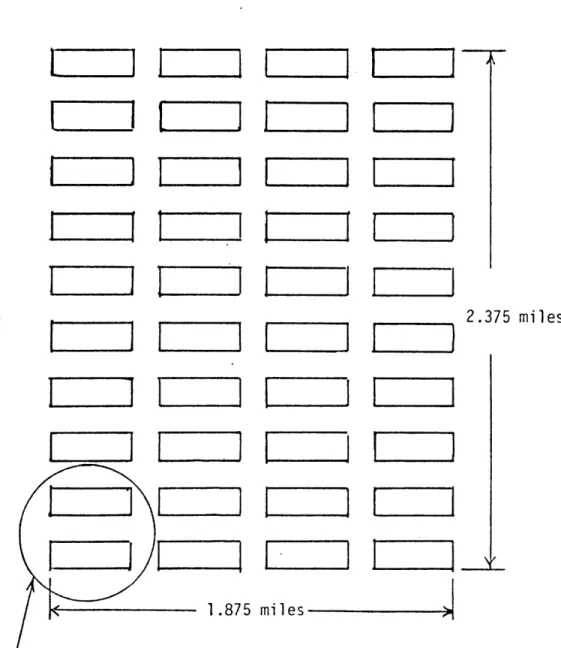
On the basis of a survey of housing types for recently proposed new cities, two dominant housing types, single family houses and low-rise apartment buildings, are identified and used to construct two idealized urban models, as in the previous simple calculations. Each model consists of only one of the two housing types; the costs obtained for these models should bracket the range of probable costs for a more realistic city containing a mixture of the two housing types without the confusion caused by additional structural details.