Publisher’s version / Version de l'éditeur:
Information Bulletin on Variable Stars, 6115, 2014-09
READ THESE TERMS AND CONDITIONS CAREFULLY BEFORE USING THIS WEBSITE.
https://nrc-publications.canada.ca/eng/copyright
Vous avez des questions? Nous pouvons vous aider. Pour communiquer directement avec un auteur, consultez la première page de la revue dans laquelle son article a été publié afin de trouver ses coordonnées. Si vous n’arrivez pas à les repérer, communiquez avec nous à [email protected].
Questions? Contact the NRC Publications Archive team at
[email protected]. If you wish to email the authors directly, please see the first page of the publication for their contact information.
NRC Publications Archive
Archives des publications du CNRC
This publication could be one of several versions: author’s original, accepted manuscript or the publisher’s version. / La version de cette publication peut être l’une des suivantes : la version prépublication de l’auteur, la version acceptée du manuscrit ou la version de l’éditeur.
Access and use of this website and the material on it are subject to the Terms and Conditions set forth at
V363 And: a detached eclipsing binary
Nelson, Robert H.
https://publications-cnrc.canada.ca/fra/droits
L’accès à ce site Web et l’utilisation de son contenu sont assujettis aux conditions présentées dans le site LISEZ CES CONDITIONS ATTENTIVEMENT AVANT D’UTILISER CE SITE WEB.
NRC Publications Record / Notice d'Archives des publications de CNRC:
https://nrc-publications.canada.ca/eng/view/object/?id=3e13b927-ed42-42ac-9e85-b1506a7273cd https://publications-cnrc.canada.ca/fra/voir/objet/?id=3e13b927-ed42-42ac-9e85-b1506a7273cd
Konkoly Observatory Budapest
30 September 2014 HU ISSN 0374 – 0676
V363 And – A DETACHED ECLIPSING BINARY
NELSON, ROBERT H.1,2
11393 Garvin Street, Prince George, BC, Canada, V2M 3Z1 email: [email protected]
2Guest investigator, Dominion Astrophysical Observatory, Herzberg Institute of Astrophysics, National
Re-search Council of Canada
V363 And (= TYC 2305-272-1 = HIP 7122 = SAO 54757) is listed in the General Catalogue of Variable Stars (Samus et al., 2007-2012) as a β Lyrae (EB) type with an epoch of 2448500.3980, a period of 1.27799 days and a spectral type of A2. Its photometric variability was discovered from the data of the Hipparcos mission. Accordingly, it was added to the author’s observing programme.
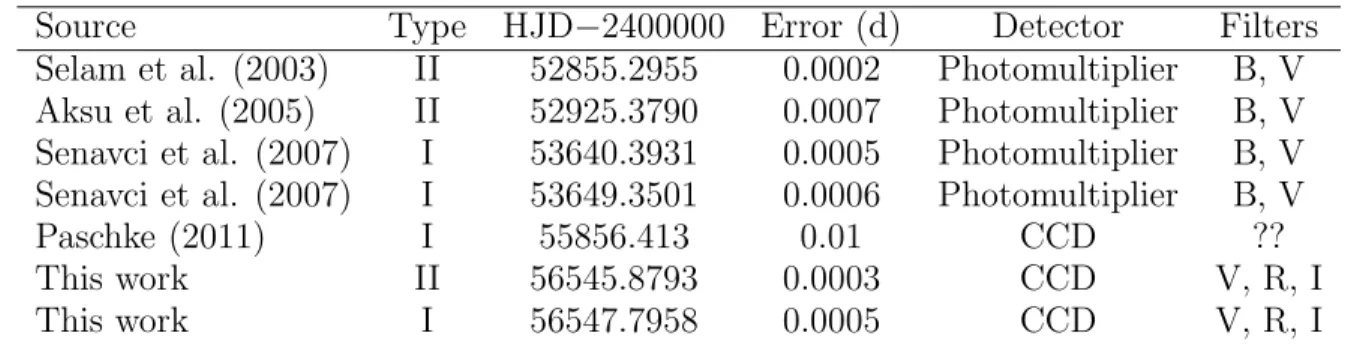
The first task was to establish the proper elements (epoch, period) for phasing. All available eclipse timings—together with two new timings—are listed in Table 1.
Table 1. All available eclipse timings for V363 And.
Source Type HJD−2400000 Error (d) Detector Filters Selam et al. (2003) II 52855.2955 0.0002 Photomultiplier B, V Aksu et al. (2005) II 52925.3790 0.0007 Photomultiplier B, V Senavci et al. (2007) I 53640.3931 0.0005 Photomultiplier B, V Senavci et al. (2007) I 53649.3501 0.0006 Photomultiplier B, V Paschke (2011) I 55856.413 0.01 CCD ?? This work II 56545.8793 0.0003 CCD V, R, I This work I 56547.7958 0.0005 CCD V, R, I
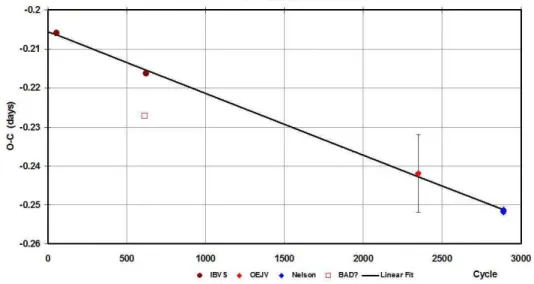
These yielded the eclipse timing (ET) diagram (a.k.a. O–C diagram) of Fig. 1. (The value labelled ‘BAD?’ is the third timing in Table 1 and was not included in the least-square fit.)
The least-squares best fit relation to fit the curve was found to be:
HJD (min I) = 2456547.7963(6) + 1.2779742(3) E (1) Accordingly, these elements were used for all phasing.
In September of 2011, the author took 10 medium resolution spectra at the DAO. The grating (#21181) was 1800 lines/mm, blazed at 5000 ˚A and used in first order, reciprocal linear dispersion = 10 ˚A/mm, resolving power = 10000. The camera used was the SITe-2. The spectral range covered was from 4995 to 5256 ˚A, approximately.
2
Figure 1. Eclipse timing diagram for V363 And.
The author then used the Rucinski broadening functions (Rucinski, 2004) to obtain radial velocity (RV) curves (see Nelson, et al. (2006) and Nelson (2010) for details). A log of DAO observations and RV results is presented in Table 2. In order to correct for the small phase smearing, the RVs were increased by 1% (in this case) in the following way: the RVs were divided by the factor f = (sinX)/X (where X = 2π t/P and t = exposure time, P = period). For spherical stars, the correction is exact; in other cases, it can be shown to be close enough for any deviations to fall below observational errors.
Table 2. Log of DAO observations.
DAO Mid Time Exposure Phase at V1 V2 Image # (HJD−2400000) (sec) mid-exp (km/s) (km/s) 7833 55808.7963 3600 0.741 151.3 −127.3 7895 55810.8335 3600 0.335 −114.7 131.5 7945 55811.9451 1800 0.205 −124.5 147.5 7995 55813.8675 1800 0.709 131.5 −138.4 8063 55815.8617 1800 0.270 −136.9 141.2 8065 55815.8840 1800 0.287 −129.7 141.8 8102 55816.9864 1200 0.150 −106.7 123.8 8116 55817.7711 1800 0.764 146.6 −131.5 8121 55817.7932 1800 0.781 142.7 −128.9 8127 55817.8497 1800 0.825 131.6 −119.2
In fitting two simple sine functions to the data, an overall rms deviation of 3.4 km/s was noted. These two best-fit functions yielded the following parameters:
K1 = 141.0 ± 1.0 km/s, K2 = 139.6 ± 0.9 km/s, and Vγ = 6.6 ± 4.3 km/s.
In September-October of 2013, the author took a total of 775 frames in V , 737 in RC (Cousins) and 771 in the IC (Cousins) band at his private observatory in Prince
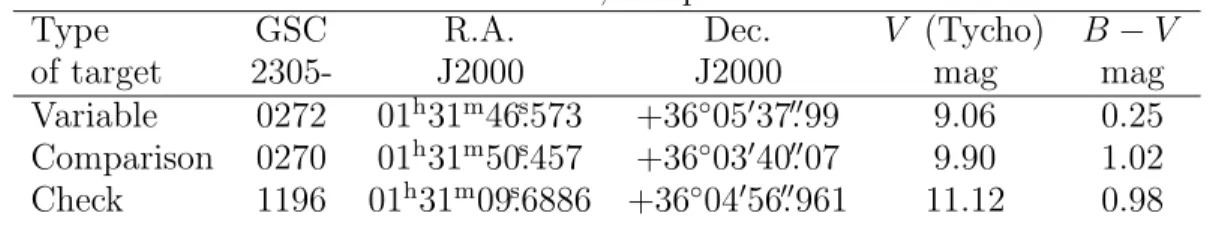
mount; the camera was an SBIG ST-10XME. Standard reductions were then applied. The comparison and check stars are listed in Table 3. The coordinates and magnitudes are from the Tycho Catalogue, Hog, et al., 2000.)
Table 3. Details of variable, comparison and check stars.
Type GSC R.A. Dec. V (Tycho) B − V of target 2305- J2000 J2000 mag mag Variable 0272 01h31m46.s573 +36◦ 05′ 37.′′ 99 9.06 0.25 Comparison 0270 01h31m50.s457 +36◦ 03′ 40.′′ 07 9.90 1.02 Check 1196 01h31m09.s6886 +36◦ 04′ 56.′′ 961 11.12 0.98
In view of the number of data points, the author binned the data into phase bins of width 0.01. He then used the 2004 version of the Wilson-Devinney (WD) light curve and radial velocity analysis program with Kurucz atmospheres (Wilson and Devinney, 1971, Wilson, 1990, Kallrath et al., 1998) as implemented in the Windows front-end software WDwint (Nelson, 2009) to analyze the data. To get started, a spectral type A2 (SIMBAD; no reference given) was used. If the system were main sequence, this would correspond to a temperature T1 = 9000 K (Cox, 2000). However, best-fit models using this temperature
yielded masses of 1.70 M⊙, too low for the interpolated standard value of 2.50 M⊙ given
in Cox (2000). From an inspection of the interpolated table, a spectral type of A8-9 was found to yield masses of 1.75 and 1.67 solar masses, respectively more in keeping with the computed values. Therefore a temperature of T1 = 7554 ± 255K (the mean of 7640
and 7468) and log g = 4.285 ± 0.003 [cgs] (the mean of 4.284 and 4.286) were adopted. (The errors correspond to an error of one spectral sub-class.) An interpolation program by Terrell (1994, available from Nelson 2009) gave the Van Hamme (1993) limb darkening values; and finally, a square root (LD = 3) law for the limb-darkening coefficients was selected, appropriate for hotter temperatures (ibid).
From the GCVS 4 designation and from the shape of the light curve mode 2 (detached binary) was used. Convergence by the method of multiple subsets was reached in a small number of iterations. Radiative envelopes for both stars were used, appropriate for hotter stars (hence the values of gravity exponent, g = 1.00 and albedo, A = 1.00 were used for each). The limb darkening coefficients are listed in Table 4.
Table 4. Limb darkening values from Van Hamme (1993). Band x1 x2 Y1 y2
Bol 0.210 0.224 0.525 0.512 V 0.120 0.132 0.684 0.675 RC 0.070 0.084 0.634 0.625
IC 0.026 0.040 0.563 0.548
During the initial stages of modelling, it was discovered that no solution was possible without third light (see below). It was tempting to add a spot to improve the fit of the computed solution at the shoulders of the secondary minimum; however, the fit improved
4
only very slightly at the expense of adding four new parameters. Therefore, the spot was abandoned.
The model is presented in Table 5. Note again that the quoted error in T2 listed above,
output by the WD program, refers to the error relative to T1. This error, when added
statistically to the error in T1 quoted below, yields an absolute error of 85 K for T2 (see
Table 6). If the error in classification is a full spectral sub-class, the estimated errors in T1 and T2 would rise to 255 K.
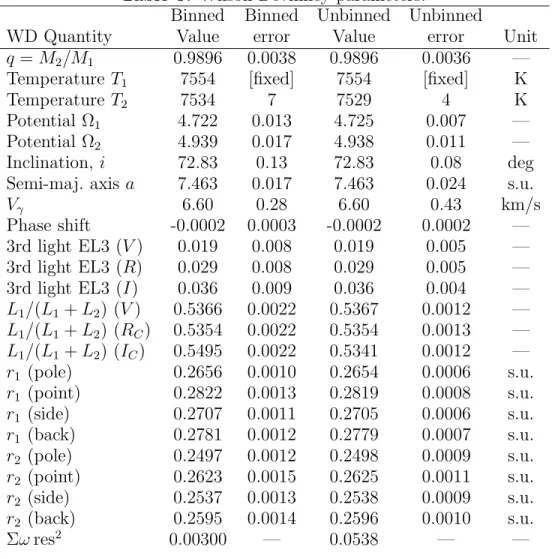
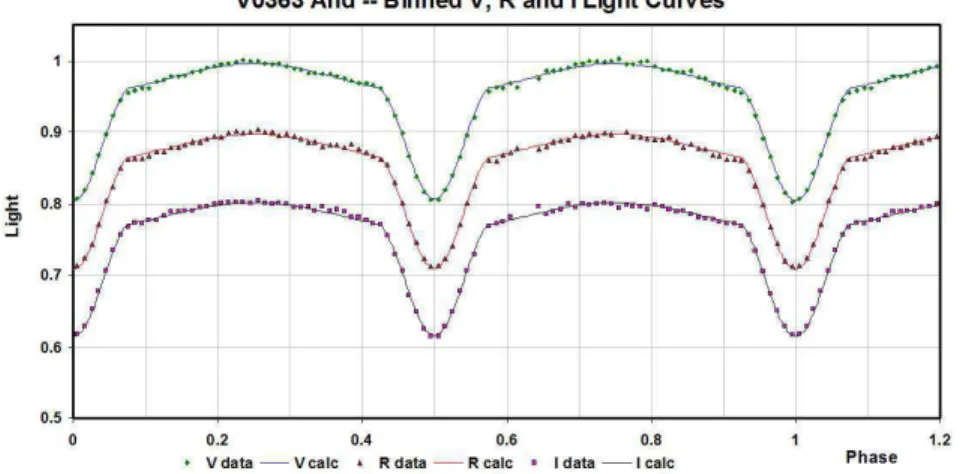
Detailed reflections were eventually used, with nref = 3, but little or no change in parameters ensued. The binned and unbinned light curve data and the their fits are displayed in Figures 2 and 3, respectively.
Table 5. Wilson-Devinney parameters.
Binned Binned Unbinned Unbinned
WD Quantity Value error Value error Unit q = M2/M1 0.9896 0.0038 0.9896 0.0036 —
Temperature T1 7554 [fixed] 7554 [fixed] K
Temperature T2 7534 7 7529 4 K
Potential Ω1 4.722 0.013 4.725 0.007 —
Potential Ω2 4.939 0.017 4.938 0.011 —
Inclination, i 72.83 0.13 72.83 0.08 deg Semi-maj. axis a 7.463 0.017 7.463 0.024 s.u. Vγ 6.60 0.28 6.60 0.43 km/s
Phase shift -0.0002 0.0003 -0.0002 0.0002 — 3rd light EL3 (V ) 0.019 0.008 0.019 0.005 — 3rd light EL3 (R) 0.029 0.008 0.029 0.005 — 3rd light EL3 (I) 0.036 0.009 0.036 0.004 — L1/(L1+ L2) (V ) 0.5366 0.0022 0.5367 0.0012 — L1/(L1+ L2) (RC) 0.5354 0.0022 0.5354 0.0013 — L1/(L1+ L2) (IC) 0.5495 0.0022 0.5341 0.0012 — r1 (pole) 0.2656 0.0010 0.2654 0.0006 s.u. r1 (point) 0.2822 0.0013 0.2819 0.0008 s.u. r1 (side) 0.2707 0.0011 0.2705 0.0006 s.u. r1 (back) 0.2781 0.0012 0.2779 0.0007 s.u. r2 (pole) 0.2497 0.0012 0.2498 0.0009 s.u. r2 (point) 0.2623 0.0015 0.2625 0.0011 s.u. r2 (side) 0.2537 0.0013 0.2538 0.0009 s.u. r2 (back) 0.2595 0.0014 0.2596 0.0010 s.u. Σω res2 0.00300 — 0.0538 — —
The radial velocities are shown in Fig. 4. A three dimensional representation from Binary Maker 3 (Bradstreet, 1993) is shown in Fig. 5.
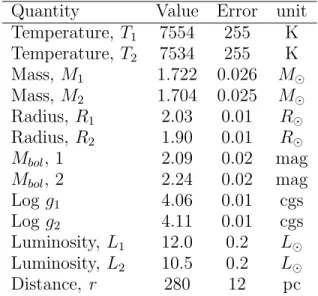
The WD output fundamental parameters and errors are listed in Table 6. Most of the errors are output or derived estimates from the WD routines. The fill factor f = (ΩI
Figure 2. V363 And: V, RC, and IC light curves – binned data and WD fit.
Figure 3. V363 And: V, RC, and IC light curves – unbinned data and WD fit.
6
Figure 5. Binary Maker 3 representation of the system – at phases 0.52 and 0.75.
of the inner Lagrangian surface, and ΩO, that of the outer Lagrangian surface, was also
calculated.
Table 6. Fundamental parameters. Quantity Value Error unit Temperature, T1 7554 255 K Temperature, T2 7534 255 K Mass, M1 1.722 0.026 M⊙ Mass, M2 1.704 0.025 M⊙ Radius, R1 2.03 0.01 R⊙ Radius, R2 1.90 0.01 R⊙ Mbol, 1 2.09 0.02 mag Mbol, 2 2.24 0.02 mag Log g1 4.06 0.01 cgs Log g2 4.11 0.01 cgs Luminosity, L1 12.0 0.2 L⊙ Luminosity, L2 10.5 0.2 L⊙ Distance, r 280 12 pc
To determine the distance r, the following procedure was followed: first the WD routine gave the absolute bolometric magnitudes of each component; these were then converted to the absolute visual magnitudes of both, MV,1 and MV,2, using the bolometric correction
BC = −0.108. The latter datum was taken from interpolated tables in Cox (2000). The absolute V magnitudes of the total system were then determined by the usual rules for addition, getting MV = 1.518 ± 0.037 magnitude. The apparent magnitude in the
V passband was 9.06 ± 0.02 magnitudes taken from the Tycho catalogue (Hog et al., 2000) and converted to the Johnson system (Kidger, no date) yielding V = 9.01 ± 0.02 magnitude. However, the author’s ensemble magnitude (taken using all the Tycho stars as standards and at phases 0.25 and 0.75) yielded V = 8.91 ± 0.02 magnitudes. This was considered more reliable because it was not known at what phase the Tycho value was determined.
It was then necessary to estimate the galactic extinction AV = R · E[B − V ] where
E[B − V ] = (B − V )obs − (B − V )tables is the colour excess, and R = the reddening
obtained). Fortunately, the dust maps of Schlegel et al (1998) (images available at Schlegel et al., (2013)) provided a maximum value of E[B−V ] = 0.051 magnitudes1 for the galactic
coordinates of V363 And. Adopting that value, distances were obtained from the standard relation:
r = 100.2×(V −MV−AV+5)
parsecs
The errors were assigned as follows: δMbol,1 = δMbol,2 = 0.02, δBC1 = δBC2 =
0.017 (1.5x the variation of a spectral sub-class), δV = 0.02, δE(B − V ) = 0.026, all in magnitudes, and δR = 0.1. Combining the errors rigorously yielded estimated errors in r of 17 pc. It was noted that the result was not overly sensitive to the value of E[B − V ] that was chosen. Dropping the value of E[B − V ] to half the Schlegel et al.’s value raised the distance by only 10 pc.
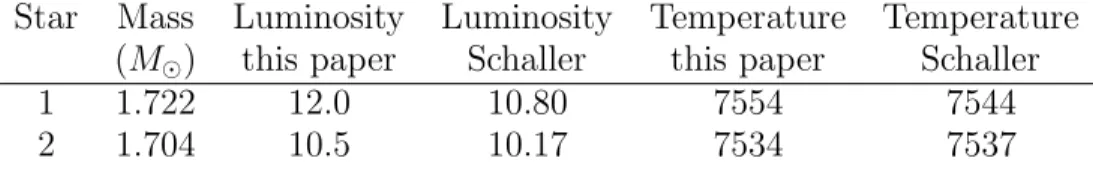
Van Leeuwen (2007), in a new reduction of Hipparcos data, derived a parallax value of 2.18 ± 1.02 mas, which yields a distance of r = 459 ± 214 pc. The value for the distance presented here certainly lies within this large range. Also (as pointed out by an anonymous referee) it is not clear whether the Hipparcos value is valid for binary systems. Reference to the evolutionary tracks of Schaller et al. (1992) for metallicity Z = 0.02 (approximately solar) and the derived masses revealed a reasonable fit at age 8.7 · 108
years for the luminosities and temperatures (see Table 7).
Table 7. Luminosities and temperatures compared to theoretical evolved values of Schaller et al. (1992).
Star Mass Luminosity Luminosity Temperature Temperature (M⊙) this paper Schaller this paper Schaller
1 1.722 12.0 10.80 7554 7544 2 1.704 10.5 10.17 7534 7537
In conclusion, this detached system of two stars, nearly equal in mass, is evolved and has an approximate age of 8.7 · 108 years. The luminosity of each star falls close to the
theoretical value; discrepancies may result from differences in the metallicity from the assumed value of Z = 0.02.
An anonymous referee has pointed out that the primary is close to the delta Scuti instability strip and hence it is a candidate to δ Scuti stars in eclipsing binaries (Soydugan et al., 2006), and the star was also observed to search forδ Scuti-like pulsations for a short time (Liakos et al., 2012).
Acknowledgements:
It is a pleasure to thank the staff members at the DAO (especially Dmitry Monin and Les Saddlemyer) for their usual splendid help and assistance.
1Since the E[B − V ] values were derived from the far-infrared all-sky images, this means that the former apply for a
light path from the observer all the way through the Galaxy (in the specified direction), and therefore represent an upper limit for the appropriate value for a star lying somewhat closer than the far edge. The error estimate in this quantity has been set to 50% of this value, and is then an appreciable contributor to the overall error in r.
8
References:
Aksu, O., et al., 2005, IBVS, No. 5588
Bradstreet, D.H., 1993, “Binary Maker 2.0 – An Interactive Graphical Tool for Pre-liminary Light Curve Analysis”, in Milone, E.F. (ed.) Light Curve Modelling of Eclipsing Binary Stars, pp 151-166 (Springer, New York)
Cox, A.N., ed., 2000, Allen’s Astrophysical Quantities, 4th ed., (Springer-Verlag, New York, NY)
Hog, E. et al., 2000, A&A, 355, L27
Kallrath, J., Milone, E.F., Terrell, D., Young, A.T., 1998, ApJ, 508, 308.
Kidger, M., http://www.britastro.org/asteroids/Tycho%20Photometry.htm Liakos, A., Niarchos, P., Soydugan, E., Zasche, P., 2012, MNRAS, 422, 1250 Nelson, R.H., Terrell, D., and Gross, J., 2006, IBVS, No. 5715
Nelson, R.H., 2009, Software, by Bob Nelson, http://members.shaw.ca/bob.nelson/ software1.htm
Nelson, R.H., 2010, “Spectroscopy for Eclipsing Binary Analysis” in The Alt-Az Initia-tive, Telescope Mirror & Instrument Developments (Collins Foundation Press, Santa Margarita, CA), R.M. Genet, J.M. Johnson and V. Wallen (eds)
Paschke, A., 2012, OEJV, 142
Rucinski, S. M. 2004, IAU Symp., 215, 17
Samus N.N., et al., 2007-2012, General Catalogue of Variable Stars, http://www.sai.msu.su/gcvs/cgi-bin/search.htm
Schaller, G., Schaerer, D., Meynet, G. and Maeder, A., 1992, A&AS, 96, 269 Schlegel, D.J., Finkbeiner, D.P., Davis, M., 1998, ApJ, 500, 525
Schlegel, D.J., Finkbeiner, D.P. & Krigel, A., 2013,
http://www.astro.princeton.edu/~schlegel/dust/data/data.html Selam, S. O., et al., 2003, IBVS, No. 5471
Senavci, H.V., et al., 2007, IBVS, No. 5754
Soydugan, E., Soydugan, F., Demircan, O., Ibanoglu, C., 2006, MNRAS, 370, 2013 Terrell, D., 1994, Van Hamme Limb Darkening Tables, vers. 1.1.
Van Hamme, W., 1993, AJ, 106, 2096 Van Leeuwen, F., 2007, A&A, 474, 653
Wilson, R.E., & Devinney, E.J., 1971, ApJ, 166, 605 Wilson, R.E., 1990, ApJ, 356, 613