HAL Id: hal-00295827
https://hal.archives-ouvertes.fr/hal-00295827
Submitted on 26 Jan 2006
HAL is a multi-disciplinary open access
archive for the deposit and dissemination of
sci-entific research documents, whether they are
pub-lished or not. The documents may come from
teaching and research institutions in France or
abroad, or from public or private research centers.
L’archive ouverte pluridisciplinaire HAL, est
destinée au dépôt et à la diffusion de documents
scientifiques de niveau recherche, publiés ou non,
émanant des établissements d’enseignement et de
recherche français ou étrangers, des laboratoires
publics ou privés.
and remote sensing data
R. Damoah, N. Spichtinger, R. Servranckx, M. Fromm, E. W. Eloranta, I. A.
Razenkov, P. James, M. Shulski, C. Forster, A. Stohl
To cite this version:
R. Damoah, N. Spichtinger, R. Servranckx, M. Fromm, E. W. Eloranta, et al.. A case study of
pyro-convection using transport model and remote sensing data. Atmospheric Chemistry and Physics,
European Geosciences Union, 2006, 6 (1), pp.173-185. �hal-00295827�
Atmos. Chem. Phys., 6, 173–185, 2006 www.atmos-chem-phys.org/acp/6/173/ SRef-ID: 1680-7324/acp/2006-6-173 European Geosciences Union
Atmospheric
Chemistry
and Physics
A case study of pyro-convection using transport model and remote
sensing data
R. Damoah1, N. Spichtinger1, R. Servranckx2, M. Fromm3, E. W. Eloranta4, I. A. Razenkov4, P. James5, M. Shulski6, C. Forster7, and A. Stohl7
1Department of Ecology, Technical University of Munich, Freising, Germany 2Canadian Meteorological Centre, Montreal, Canada
3Naval Research Laboratory, Washington, D.C., USA 4University of Wisconsin-Madison, Madison, WI, USA
5Hadley Centre for Climate Prediction and Research, Exeter, UK 6Alaska Climate Research Center, Fairbanks, AK, USA
7Norwegian Institute for Air Research, Kjeller, Norway
Received: 8 July 2005 – Published in Atmos. Chem. Phys. Discuss.: 18 August 2005 Revised: 9 November 2005 – Accepted: 13 December 2005 – Published: 26 January 2006
Abstract. Summer 2004 saw severe forest fires in Alaska
and the Yukon Territory that were mostly triggered by light-ning strikes. The area burned (>2.7×10⁶ha) in the year 2004 was the highest on record to date in Alaska. Pollutant emis-sions from the fires lead to violation of federal standards for air quality in Fairbanks.
This paper studies deep convection events that occurred in the burning regions at the end of June 2004. The con-vection was likely enhanced by the strong forest fire activ-ity (so-called pyro-convection) and penetrated into the lower stratosphere, up to about 3 km above the tropopause. Emis-sions from the fires did not only perturb the UT/LS locally, but also regionally. POAM data at the approximate loca-tion of Edmonton (53.5◦N, 113.5◦W) show that the UT/LS aerosol extinction was enhanced by a factor of 4 relative to unperturbed conditions. Simulations with the particle disper-sion model FLEXPART with the deep convective transport scheme turned on showed transport of forest fire emissions into the stratosphere, in qualitatively good agreement with the enhancements seen in the POAM data. A correspond-ing simulation with the deep convection scheme turned off did not result in such deep vertical transport. Lidar mea-surements at Wisconsin on 30 June also show the presence of substantial aerosol loading in the UT/LS, up to about 13 km. In fact, the FLEXPART results suggest that this aerosol plume originated from the Yukon Territory on 25 June.
Correspondence to: R. Damoah ([email protected])
1 Introduction
Emissions of aerosols and trace gases like carbon monox-ide, nitrogen oxides and non-methane hydrocarbons from forest fires play an important role for atmospheric chemistry (Crutzen, 1973; Crutzen and Andreae, 1990) and radiation transmission in the atmosphere (Robock, 1991; Iacobellis et al., 1999). Due to long-range transport of forest fire emis-sions, they affect not only local surroundings but also in-fluence the atmosphere on regional (Tanimoto et al., 2000; Kato et al., 2002) and even continental (Wotawa and Trainer, 2000) and hemispheric scales (Forster et al., 2001; Wotawa et al., 2001; Damoah et al., 2004; Spichtinger et al., 2004, Yurganov et al., 2004, Novelli et al., 2003).
It is well known that volcanic eruptions can produce the explosive force to inject material from the surface deep into the stratosphere (Graf et al., 1999). Only recently, how-ever, it was realized that deep convection triggered or en-hanced by forest fires (so-called pyro-convection) can also penetrate deeply into the stratosphere, leading to the deposi-tion of gaseous and particulate products of the burning in the upper troposphere and lower stratosphere (UT/LS) (Fromm and Servranckx, 2003; Fromm et al., 2005). The mecha-nisms causing this deep convection are not yet entirely clear, but it appears that normal deep convection that occurs regu-larly in the boreal region in summer-time under favourable meteorological conditions can be greatly enhanced by the heat released by the fire as well as by microphysical and ra-diative processes due to the large amounts of aerosols emit-ted. These aerosols reduce cloud droplet numbers, suppress precipitation formation, and enhance the significance of the
Fig. 1. June daily temperatures (green) for (a) Anchorage, (b) Juneau, (c) Nome and (d) Fairbanks, respectively. The horizontal red and blue
lines indicate record high and low temperatures, respectively (see from http://climate.gi.alaska.edu).
20
Fig. 2. The annual area burned in Alaska during the fire seasons
between the years 1997 and 2004 (see http://climate.gi.alaska.edu).
ice phase (hence, also enhance the amount of latent heating available at high altitudes) (Andreae et al., 2004). Similar processes have been observed to be effective in tropical pyro-convection (Andreae et al., 2004). Furthermore, the radiation absorption by black carbon particles emitted by the fires and the associated heating of the atmosphere above the cloud tops could lead to further lifting after the initial convective injec-tion into the UT/LS region (Westphal and Toon, 1991; Her-ring and Hobbs, 1994; Trentmann et al., 2002). While the rel-ative importance of these different mechanisms is not clear, several recent papers have presented dedicated case studies of pyro-convection events (Fromm and Servranckx, 2003; Fromm et al., 2005), or cases that can likely be explained by pyro-convection although the authors did not explicitly sug-gest pyro-convection to be the transport mechanism (Livesey et al., 2004; Jost et al., 2004). Some of the observations (e.g., Jost et al., 2004) even show that the emission products can be transported to levels in the stratosphere with potential tem-peratures above 380 K, a region that is commonly referred to as the stratospheric overworld.
R. Damoah et al.: Pyro-convection 175
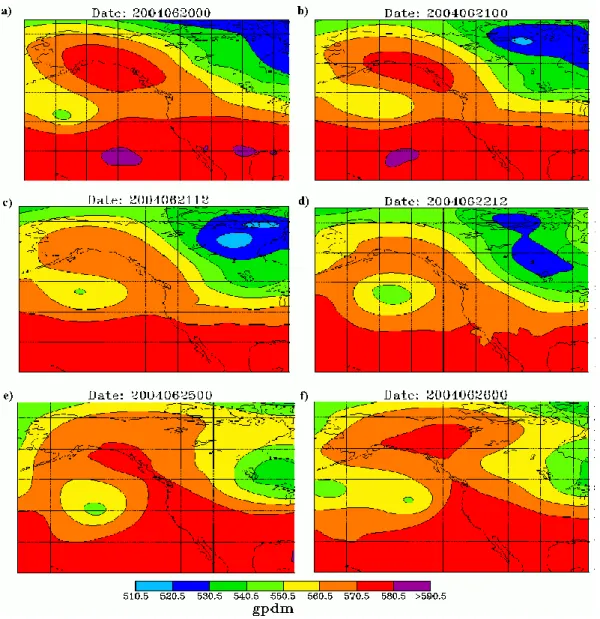
Fig. 3. ECMWF (European Centre for Medium-Range Weather Forecasts) Geopotential Height in gpdm (geopotential decametres) at 500 hPa
on (a) 20 June 2004 at 00:00 UTC, (b) 21 June 2004 at 00:00 UTC, (c) 21 June 2004 at 12:00 UTC, (d) 22 June 2004 at 12:00 UTC, (e) 25 June 2004 at 00:00 UTC and (f) 26 June 2004 at 00:00 UTC.
In June 2004, dry conditions, above normal temperatures and strong lightning activity caused severe forest fires in Alaska and the Canadian Yukon Territory. Air quality was significantly degraded in large regions by these fires. For instance, particulate matter smaller than 2.5 µm (PM-2.5) of about 1000 µg/m3were measured in Fairbanks, exceed-ing E.P.A.’s threshold (300 µg/m3)by a factor of more than three (Rozell, 2004). Also in Fairbanks measured CO of 9.2 ppm nearly violated the Clean Air Act (9.5 ppm), whereas typical mid-summer CO background mixing ratios are only about 80 ppb. Emissions from the burning were also trans-ported over long distances. High enhancements of aerosol scattering were observed at Cheeka Peak (48.3◦N, 124.6◦W, 480 m a.s.l.) (personal communication, D. Jaffe) and several
research aircraft were guided repeatedly into the fire plumes over eastern North America, the Atlantic and over Europe during the ICARTT (International Consortium for Atmo-spheric Research on Transport and Transformation) cam-paign and measured large enhancements of fire tracers in the lower and middle troposphere. In fact, Cammas et al. (2006)1 in a paper in preparation linked an enhanced CO measure-ment taking during a commercial airliner cruising at about 11 km over the North Atlantic to biomass burning. Using
1Cammas, J.-P., Brioude, J., Chaboureau, J.-P., Duron, J., Mari, C., Mascart, P., Hedelec, P., Smit, H., Volz-Thomas, A., Stohl, A., and Fromm, M.: Stratospheric injection of biomass fire smoke fol-lowed by long-range transport: a MOZAIC case study, in prepara-tion, 2006.
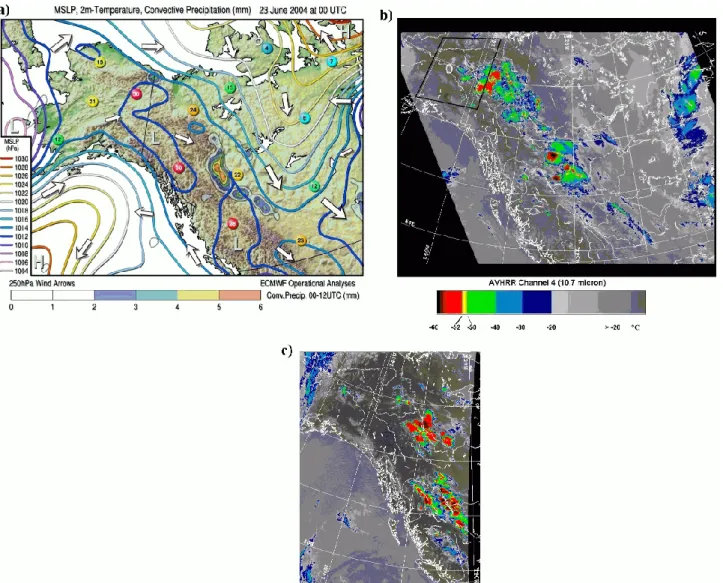
Fig. 4. (a) ECMWF analyses of mean sea level pressure (colored contour lines), 2-m temperatures at selected locations (colored buttons)
and 250 hPa winds (arrows) for 23 June at 00:00 UTC, plotted over a topography map of Alaska and western Canada. Shaded areas show the convective precipitation from a 12-h forecast from the 00:00 UTC analysis. (b) Brightness temperatures from the NOAA-12 satellite at channel 4 (10.7 µm) on 23 June at 05:00 UTC and (c) on 24 June at 01:00 UTC. The black rectangle and white circle in (b) indicate approximately the area shown in Fig. 5b and location of the radiosonde (Fig. 7), respectively.
convective mass fluxes from a mesoscale model, they show that deep convection was responsible for the high CO con-centrations in the stratosphere.
In this paper we focus on a particular episode of burning in June 2004 when pyro-convection transported fire emissions into the UT/LS. Section 2 describes model calculations used to study the transport of the plume, and Sect. 3 gives the me-teorological conditions in the observed area during the event. Model results, satellite and lidar measurements during the event are reported in Sect. 4 and, finally, summary and con-clusions are presented in Sect. 5.
2 Model description
For studying the transport phenomena associated with the pollution plumes, we used the Lagrangian particle dispersion model FLEXPART (Stohl et al., 1998, 2005) to simulate the transport of a CO tracer. CO tracer was used because CO has a relatively long life time that ranges from 1 month (in the tropics) to 4 months (in the mid-latitudes) (Seinfeld and Pan-dis, 1998) and because we want to focus here on the transport only, and do not consider chemical processes.
FLEXPART simulates long-range transport, diffusion, dry and wet deposition and radioactive decay of air pollutants released from point, line or volume sources. It treats ad-vection and turbulent diffusion by calculating the trajectories
R. Damoah et al.: Pyro-convection 177
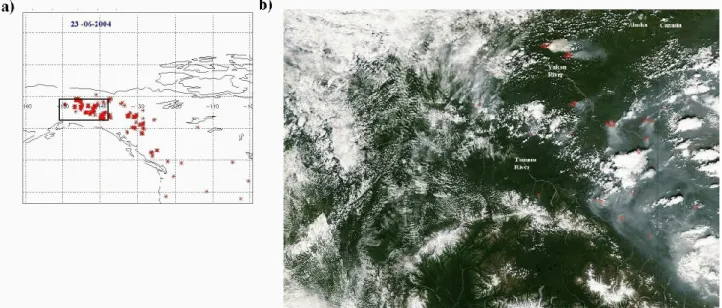
Fig. 5. (a) MODIS fire hot spots for 23 June, 2004. The black rectangle is approximately the area shown in panel (b). (b) MODIS Aqua
satellite image over Alaska and the Yukon Territory on 22 June at about 22:00 UTC. Red spots show active fires, whereas blue-grey colors indicate smoke, and the whitish colors show snow, ice and clouds.
of a multitude of particles. Stochastic fluctuations, obtained by solving Langevin equations (Stohl and Thomson, 1999), are superimposed on the grid-scale winds from global me-teorological datasets to represent transport by turbulent ed-dies, which are not resolved. Global data sets also do not resolve individual convective cells, although they reproduce some of the large-scale effects of convection. Therefore, FLEXPART has recently been equipped with a convection scheme (Emanuel and Zivkovic-Rothman, 1999) to account for sub grid-scale convective transport. The scheme requires the grid-scale temperature and humidity fields as input. and calculates as a by-product a displacement matrix for each horizontal grid box. The matrix provides the necessary in-formation for the particle redistribution which is performed on the same vertical levels as the input data. The convec-tion scheme is called every FLEXPART time step which is 900∼s. The temperature and specific humiditiy are read in from the meteorological data and linearly interpolated to the current time.
FLEXPART can be driven by meteorological analysis data either from the European Centre for Medium-Range Weather Forecasts (ECMWF, 1995) or from the Global Forecast Sys-tem (GFS) of the National Center for Environmental Predic-tion (NCEP). Due to the significantly higher vertical resolu-tion of the ECMWF data and the higher intrinsic horizontal resolution of the operational ECMWF forecast model, com-pared to the GFS model, we use ECMWF data in this study. These data have 60 hybrid model levels in the vertical and were retrieved on a global 1×1 latitude-longitude grid. Six hourly analyses were supplemented by 3-h forecast step data to provide a 3-hourly temporal resolution. An output grid
with a 1×2 latitude/longitude resolution, a vertical spacing of 1000 m and an output interval of 3 h was employed.
In the tracer simulations, 5×10⁶particles were released to calculate the transport of CO emissions from fires in Alaska and the Yukon Territory. For our simulation we consid-ered the 2-week period from 17 to 30 June 2004, during which the strongest deep convection and transport event oc-curred. In order to describe the regional and daily variations of the fires, the MODIS (http://map.ngdc.noaa.gov/website/ firedetects/viewer.htm) hot spot data were counted daily on a 1◦×1◦grid. For every 3-day period the maximum daily num-ber of hot spots in a grid cell was taken in order to minimize the effect of missing hot spot data in the presence of clouds. The daily area burned in North America on a per-province (in Canada) and per-fire-state (in the United States) basis, taken from a web page at the Center for International Disaster In-formation (http://www.cidi.org/wildfire), was distributed to those cells in the respective province containing the hot spots. Then, a constant CO emission factor of 4500 kg per hectare of forest burned, which is similar to recent estimates based on emissions from the Canadian Northwest Territories (Cofer et al., 1998), was applied to release CO on a 1◦×1◦ grid.
The altitude at which fire emissions are effectively released into the atmosphere varies from day to day and is actually not known. Lacking this information, we released the CO tracer into the lowest 3 km of the model atmosphere which is consistent with other fire simulations (Damoah et al., 2004; Spichtinger et al., 2004). Transport to high altitudes must be produced by the model itself, either as a result of resolved vertical transport or by the convection scheme. It must be noted that all the processes related to the fire itself are not
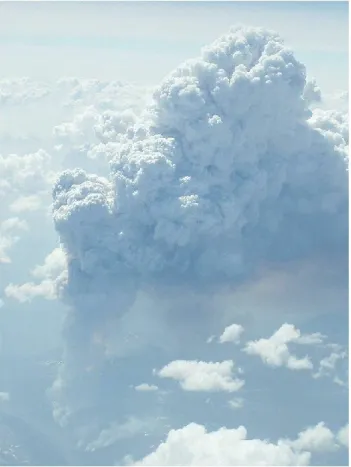
Fig. 6. Picture of a pyro-cumulonimbus located at 58◦N, 126◦W on 27 June at 21:00 UTC. The picture was taken out of the cockpit of a commercial airliner cruising at about 10 km (Picture courtesy of Noriyuki Todo of Japan Airlines).
treated in the ECMWF model. To some extent the effects of the fires (e.g., a destabilization of the atmosphere) might have been indirectly introduced into the analyses through the as-similation of observations (e.g., temperature data from satel-lites and radiosondes in the vicinity of the fires). However, these effects are rather local and it is not clear whether ob-servations that were affected by the fires indeed entered the ECMWF data assimilation. It is, thus, likely that convective transport over the fires is underestimated by FLEXPART.
3 Meteorological conditions in the burning area
It is known that, climatologically, maximum daily tempera-tures are related to the number of lightning strikes, and the number of lightning strikes is in turn related to the num-ber of started fires (Rorig and Ferguson, 1999). During the year 2004, most of Alaska experienced the warmest summer on record. In June, temperatures were warmer than normal across the State (Alaska Climate Research Center; see http: //www.climate.gi.alaska.edu). Anomalies of the monthly mean temperature ranged from 2.5◦C to 4◦C. In
Anchor-age (lat. 61 N, long. 150 W), southern Alaska, the monthly average temperature in June was about 14◦C, 2.5◦C above
normal. The highest temperature of the month (28◦C)
oc-curred on 26 June (Fig. 1a). More than 65% of the daily maximum temperatures were above normal. The conditions in Juneau (lat. 58 N, long. 134 W) were extreme; a string of 7 days (18–24 June) had record highs (red asterisks, Fig. 1b). The highest measured temperature was above 29◦C. Nome (lat. 64 N, long. 165 W) also registered three record high tem-peratures (Fig. 1c). The monthly mean temperature in Fair-banks (lat. 65 N, long. 148 W) was almost 19.5◦C, 4◦C above normal.
Between 14 and 15 June, about 17 000 cloud-ground flashes were reported to have hit Alaska within 24 h, the highest number in 25 years (AICC, 2004). Of the 707 fires reported in 2004, almost 300 were triggered by lightning strikes (see, http://fire.ak.blm.gov). Being the third driest summer on record (Rozell, 2004), the fires, also fanned by surface winds of about 9 m/s (Rozell, 2004) on average in June, consumed large areas in Alaska and its surroundings. Figure 2 shows the annual area burned in Alaska from 1997 to 2004. In 2004, 707 fires burned a new record of about 2.7×10⁶ha. The old record of 2×10⁶ha was registered in 1957.
During the second half of June 2004, anti-cyclonic con-ditions prevailed over Alaska and north-western Canada (Fig. 3a). However, on 21 June a mid-tropospheric low-pressure system developed west of the Canadian west coast weakening the anticyclone over Alaska and north-western Canada over the next two days (Figs. 3b, c, d). Then the an-ticyclone strengthened again (Figs. 3e, f) and remained until the end of June. The low pressure system caused only a slight decrease in surface pressure and did not bring a major change in surface temperatures (see colored buttons in Fig. 4a and temperature time series in Fig. 1), but colder temperatures associated with the mid-tropospheric cut-off low triggered strong convection, as shown in an infrared satellite image on 23 June at 05:00 UTC (Fig. 4b). Several centers of convec-tive activity can be seen, with the coldest cloud top bright-ness temperatures (<−52◦C) located over the Yukon Terri-tory and British Columbia. On the following days even lower brightness temperatures (<−60◦C) were observed (Fig. 4c). As we shall show below, the convective activity was strongest during the afternoon and evening hours and weakened over night. This daily cycle was repeated several days after 20 June. The northern cluster of convection seen in Figs. 4b and c was responsible for the upward transport of forest fire emissions into the UT/LS.
4 Transport of fire emissions into the upper troposphere and lower stratosphere
Figures 5a and b show the distribution of active fires and smoke on 23 and 22 June, respectively, from NASA’s
R. Damoah et al.: Pyro-convection 179
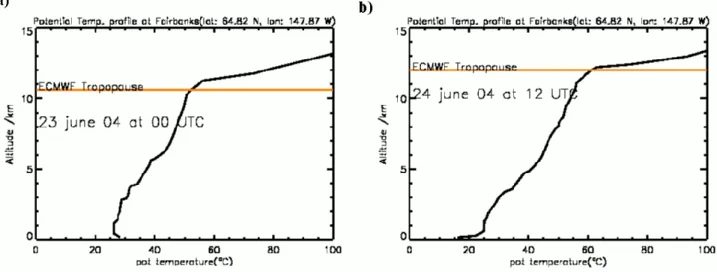
Fig. 7. Potential temperature profile derived from radiosonde temperature data at Fairbanks, Alaska (a) on 23 June at 00:00 UTC and (b) on
24 June at 12:00 UTC. The horizontal orange line indicates the dynamical tropopause height calculated from ECMWF data.
Moderate Resolution Imaging Spectroradiometer (MODIS) aboard the Terra and Aqua satellites (Kaufman et al., 2003, 1998; Justice et al., 1996). It indicates intense burning in Pingo and Winter Trail along the Yukon River (upper left of Fig. 5b). The Billy Creek and Porcupine fires south-east of the Tanana River sent piles of smoke (blue-grey) into the at-mosphere. Another cluster of hot spots can be seen in Yukon Territory through to Juneau and in the north-west of British Columbia (Fig. 5a). These fires had been burning for weeks and also continued to burn into July.
By comparing Figs. 4b, 4c and 5, it can be seen that the northern clusters of deep convection were located almost exactly over the region with the strongest burning activity. While it is impossible to say to what extent the fires en-hanced the convection, the strong correlation between fire locations and the coldest cloud tops is striking, such that a causal relationship is suggested. In support of this view, Fig. 6 shows a picture taken out of the window of a com-mercial aircraft on 27 June within the region. The picture shows a pyro-cumulonimbus cloud with cloud tops above 10 km. Three things about this image are striking: Firstly, the cloud’s brownish color, which is reminiscent of pictures of volcanic eruptions and is caused by the huge mass of aerosols transported upward by the cloud from the forest fires seen to be burning underneath. Secondly, the exact co-location of the convective cloud and the forest fire and it’s consider-able depth. The cloud top is obviously much higher than the tops of the convective clouds seen in the background. Thirdly, despite the maturity and depth of the convection, the cloud doesn’t seem to precipitate. This supports our sugges-tion that, in addisugges-tion to the heat and water vapor (i.e., latent heat) released by the fire, microphysical mechanisms similar to those reported by Andreae et al. (2004) suppressed pre-cipitation and, thus, allowed the latent heat of freezing to be released at high altitude.
Based on radiosonde potential temperature measurements from Fairbanks (Fig. 7), taken approximately within the white circle indicated in Fig. 4b, the coldest cloud tops were located at around 11 to 12 km. According to the soundings, the thermal tropopause height was at approximately 11 km on 23 June at 00:00 UTC and at 12 km on 24 June at 12:00 UTC. The dynamical tropopause (orange lines in Fig. 7) taken from the ECMWF analysis was located somewhat lower at about 10.5 km on 23 June (the dynamical tropopause is the altitude where the potential vorticity exceeds the value of 2 potential vorticity units). The radiosonde temperature profiles show a strong gradient and no significant structure in the free tro-posphere but a very sharp tropopause. These features are characteristic of an environment shaped by deep convection (Salby, 1996). Note that the sounding from 24 June was taken during night hours and shows a very shallow surface inversion. The cloud top height is consistent with the simu-lated transport of the CO emissions from the fires. The fires were located east of Fairbanks, and a vertical section of the FLEXPART CO tracer at 64◦N with convection turned on (Fig. 8a) and off (Fig. 8b) on 24th at 12:00 UTC confirms the injection of fire emissions into the Alaskan lower strato-sphere due to convection at around 138◦W. In the simulation
with convection turned on, forest fire tracer can be found up to about 12 km altitude. The top of the tracer cloud at about 12 km is in good agreement with the coldest cloud top tem-peratures (Fig. 7). No injection into the stratosphere takes place in the simulation without convection showing that the use of the convection scheme in FLEXPART brings a better agreement between measurements and model results.
Figure 9 shows FLEXPART vertical cross sections along 64◦N cutting through the region with the strongest burning activity at around 140◦W. It demonstrates how the convec-tion weakens during the night and morning hours, and how the forest fire emission injected into the free troposphere and
Fig. 8. Vertical sections through the FLEXPART CO tracer at 64◦latitude on (a, f) 23 June at 09:00 UTC and (b, g) 21:00 UTC, (c, h) on 24 June at 00:00 UTC, (d, i) 03:00 UTC and (e, j) 06:00 UTC. Panels (a–e) show simulations with convection turned on, panels (f–j) show simulations with convection turned off. The black solid line is the dynamical tropopause height (height of the 2PVU surface) determined from ECMWF operational data.
R. Damoah et al.: Pyro-convection 181
Fig. 9. TOMS aerosol index over North America on (a) 23 and (b) 24 June 2004. FLEXPART 9–15 km CO tracer columns over North
America with convection turned on, at (c) 23 June 03:00 UTC, (d) 24 June 03:00 UTC. (e) and (f) Same as (c) and (d), respectively, but with convection turned off. The orange and green rectangles shown in Fig. 10f indicate the locations of the POAM and SAGE measurements, respectively, shown in Fig. 11a. The red rectangle shows the location of the lidar measurements shown in Fig. 12.
lower stratosphere during the day are transported eastwards (Figs. 9a, b). In the afternoon hours of the following day the convection gets active again (Fig. 9c) and transports forest fire emissions to regions above the tropopause within a cou-ple of hours (Figs. 9d, e). This cycle is repeated every day in the period from 20 June until the end of June, and forest fire emissions were repeatedly injected into the stratosphere during this period. Figures 9f–j show the same as Figs. 9a–e, but for a FLEXPART simulation with the convective parame-terization turned off. No transport into the stratosphere takes place reflecting again the importance of the representation of convection in transport models.
4.1 UT/LS observations of forest fire smoke
The aerosol index derived from data provided by the To-tal Ozone Mapping Spectrometer (TOMS) instrument on board the Earth Probe satellite (see http://toms.gsfc.nasa. govfordetails) gives information on the spatial distribution of UV-absorbing tropospheric aerosols (Hsu et al., 1996). On 23 and 24 June, the TOMS aerosol index (Figs. 10a and b, respectively) shows filaments of enhanced values that stretch from Fairbanks and the Yukon Territory through Edmonton to Wisconsin. Distinct maxima of more than 4.5 are observed over Fairbanks and the Yukon Territory on both days. These locations correspond remarkably well with the locations of the very cold cloud tops in Figs. 4b and c. The sensitivity
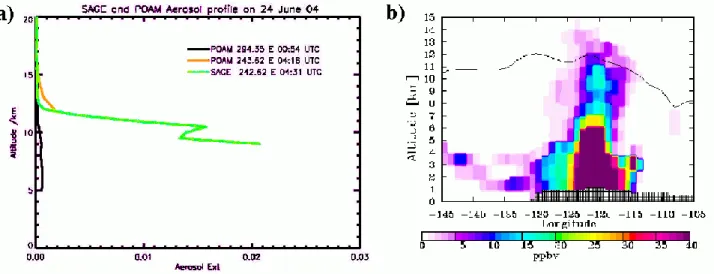
Fig. 10. (a) POAM III (orange) and SAGE II (green) aerosol extinction profiles at 1 µm approximately over Edmonton on 24 June at
04:00 UTC. The location of the profiles is shown in panel (f). The unperturbed black profile is the POAM aerosol extinction over Quebec at 00:00 UTC. (b) Vertical section through the FLEXPART CO tracer at 54◦latitude on 24 June at 03:00 UTC with convection turned on. The black solid line is the dynamical tropopause height (height of the 2PVU surface) determined from ECMWF operational data.
of the TOMS aerosol index to the presence of absorbing aerosols increases strongly with altitude. Thus, the maxi-mum values of the TOMS aerosol index are likely due to aerosols located at high altitudes, which have passed through the deep convective clouds.
The features of enhanced TOMS aerosol index on 23 and 24 June are in remarkable agreement with the FLEXPART CO tracer located between 9 and 15 km (Figs. 10c and d) in the simulation with the convection parameterization turned on. On 23 June at 03:00 UTC (Fig. 10c), the simulated CO tracer shows a similar filament over the Yukon Territory and British Columbia while on 24 June at 03:00 UTC (Fig. 10d) the maxima are at eastern Fairbanks, Yukon Territory and Edmonton. Figures 10e and f show the corresponding re-sults, but with the convection parameterization turned off. The very low CO tracer in this simulation shows again that the upward transport in the simulation with convection turned on was indeed due to the sub-grid-scale convection parame-terization. In fact, the average of the tracer between 9 and 15 km with convection relative to without convection shows a nearly nine-fold enhancement on both days. The feature in the TOMS image which is close to the Beaufort Sea on 23 and over the sea on 24 (red rectangle) is not visible in the FLEXPART 9–15 km column (Figs. 10c and d). However, inspection of the 0–15 km column (not shown) indeed shows CO tracer over the Beaufort Sea. Thus this feature may be located at lower (<9 km) altitude.
Other instruments that testify to the perturbation of the UT/LS by the Alaskan fires are the Polar Ozone and Aerosol Measurement (POAM III) aboard the SPOT-4 satel-lite (Lucke et al., 1999) and the Stratospheric Aerosol and Gas Experiment (SAGE II) aboard the Earth Radiation
Bud-get satellite (Mauldin et al., 1985). Figure 11a shows en-hanced aerosol extinction at 1 µm wavelength in the UT/LS from SAGE II (green) and POAM III (orange) over Ed-monton (green and orange rectangles in Fig. 10f) on early hours of 24 June. The SAGE profile shows a strong en-hancement between 10 and 12 km, the ECMWF dynamical tropopause (Fig. 11b) over the location is at about 10–11 km. The POAM profile over Edmonton shows an even stronger enhancement above 12 km but no values below. This termi-nation of POAM data at such a high altitude is what is re-ferred to as “High Zmin” (Fromm et al., 1999). This nor-mally indicates that optically sufficiently thick clouds ob-scure the sun from the POAM sun tracker and, thus, mea-surements are available only above the cloud. An investiga-tion of GEOS infrared imagery, however, revealed that there were no high clouds in the region. Visible imagery showed some greyish features, whose color suggests these were not normal water or ice clouds. In fact, backward trajectories (not shown) from the enhanced POAM profile travel back to the fire source in Alaska. Thus, it seems that the aerosol layer was optically sufficiently thick to terminate the POAM sun tracker measurements. Another POAM profile over Quebec at 54◦N, 66◦W (black line in Fig. 11a) outside the region of the Alaskan fire emission plume shows an unperturbed profile for reference. The two POAM profiles (orange and black profiles in Fig. 11a) above 12 km show an approxi-mately four-fold enhancement of the aerosol extinction of the perturbed (orange) relative to the unperturbed profile (black). Although the FLEXPART CO tracer across 54◦N on 24 June at 06:00 UTC (Fig. 11b) shows the main part of the forest fire plume west of Edmonton, there is clear evidence of for-est fire CO plume well above (1–2 km) the local tropopause
R. Damoah et al.: Pyro-convection 183
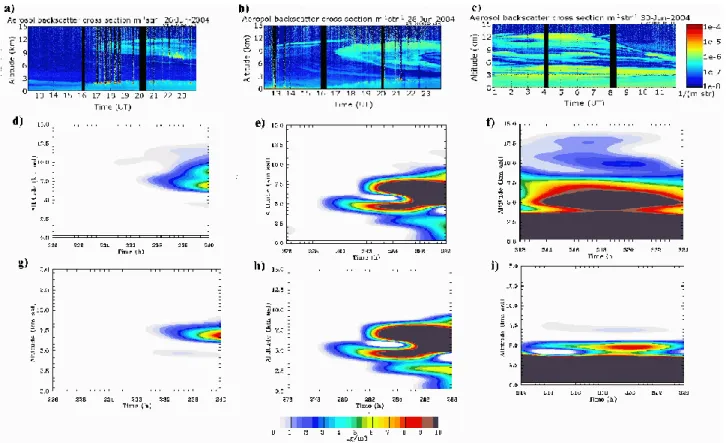
Fig. 11. Lidar time-height plot of aerosol backscatter cross section over Madison (red rectangle in Fig. 10f) on (a) 26 June from 12:00 UTC
to 24:00 UTC, (b) 28 June from 12:00 UTC to 24:00 UTC and (c) 30 June 2004 from 01:00 UTC to 12:00 UTC. The vertical resolution is 7.5 m. FLEXPART time-height plots of the CO tracer from the simulation with convection turned on at the lidar location on (d) 26, (e) 28 (f) 30 June for the same time periods as the corresponding lidar data plots (a–c). (g), (h) and (i) Same as (d), (e) and (f), respectively, but with convection switched off.
at Edmonton. This underlines that the enhanced POAM and SAGE extinction in the UT/LS were likely due to a pyro-convective blow up.
4.2 Lidar observations at Madison
During the last four days of June 2004, the High Spectral Resolution Lidar (HSRL) (Eloranta, 2005) at the University of Wisconsin (red rectangle in Fig. 10f), used for long-term cloud studies (43.1◦N, 89.4◦W), registered unusually high values of the aerosol backscatter cross section in the upper troposphere (Fig. 12). The strong signal was presumably smoke that was transported from Alaska and the Yukon Ter-ritory. Figures 12a–c show observed aerosol backscatter on 26, 28 and 30 June, respectively, (note that the first two pan-els show the last 12 h of the day while the last panel shows the first 12 h of the day). It is obvious that there is a consistent aerosol layer build up high above the atmospheric boundary layer at altitudes up to 13 km.
The observed patterns of the aerosol backscatter through-out this period agree well with the simulated FLEXPART CO tracer patterns from the fires both with convection on (Figs. 12d–f) and off (Figs. 12g–i). Although FLEXPART
tends to underestimate the plume height by about 2–3 km, the overall features are well produced. It is evident from the sim-ulations that convection did not alter the CO tracer distribu-tion over Madison significantly during 26 and 28 June. How-ever, during the last 2 h of 26 of June traces of the CO lifted into the UT/LS by pyro-convection is evident above 9 km. The strongest aerosol backscatter was observed on 30 June, with the pyro-convective CO plume seen at 6 to 13 km. In fact, according to a FLEXPART movie showing maps of the total tracer column (not shown), this thick plume over Madi-son was advected north-eastwards from the Yukon Territory on 25 June. 24 h later, it has taken a south-eastern direc-tion from south of Victoria Island (69◦–73◦N, 100◦–115◦W) where it was stagnant for some hours before it headed to Wis-consin, where it engulfed most of the upper troposphere over Madison and reached about 13 km.
5 Summary and conclusions
In this paper, we have used satellite and lidar data and the Lagrangian transport model FLEXPART to study a pyro-covection event that occurred in Alaska and the Yukon
Territory in June, 2004. Although pyro-convection is not in-cluded in the model, and that the vertical transport of the forest fire CO is due to other processes (i.e. regular deep convection), there is no generally accepted definition for pyro-convection at least for now, so one cannot clearly draw a line between regular deep convection and pyro-convection. But pyro-convection seems likely from the observation.
After a mostly dry period of anticyclonic conditions over Alaska with unusually high temperatures, a cyclone devel-oped west of the Canadian coast on 21 June. It weakened the anticyclone over Western Canada and Alaska and triggered strong convection. Several deep convective centers with very low cloud top brightness temperatures were observed. The cluster of the coldest cloud top temperatures (below −60◦C) was located almost exactly over the region with the strongest fire activity in the boreal forest, suggesting that the fires may have enhanced the convection. A picture taken from a com-mercial airliner a few days later over another fire also shows the pyro-convection over the fire to be much higher than the convective clouds in the environment. The picture also clearly shows how smoky the pyro-convection was.
POAM and SAGE extinction profiles that were available on 24 June, one day after one of the pyro-convection events, showed that there was enhanced aerosol extinction up to about 13 km, whereas the local tropopause was at about 11 km. Lidar measurements at Madison, Wisconsin, showed strongly enhanced aerosol backscatter at up to about 13 km altitude on 30 June, about 1 week after the strongest pyro-convection.
The Lagrangian particle dispersion model FLEXPART was used to establish relationships between the different ob-servations of the fire plume. These simulations could indeed trace back the POAM and SAGE observations as well as the lidar observations to the pyro-convection events in the second half of June 2004. However, the simulations were only suc-cessful when the deep convection parameterization of FLEX-PART was switched on. Without the convection parameteri-zation the deep transport of the fire emissions into the strato-sphere could not be simulated at all. Even with the convec-tion parameterizaconvec-tion turned on, the maximum altitude of the simulated pollution plume over the lidar location was some-what lower than observed. This is likely because the convec-tion parameterizaconvec-tion does not account for processes related directly to the fire. However, the ECMWF data used to drive FLEXPART likely benefited from the assimilation of close-by (only about 557 km from the coldest cloud top tempera-tures) radiosonde data that clearly showed the signatures of the deep convection taking place. In other cases, where there are no such close-by radiosonde data available, tracer simula-tions of pyro-convection may be much less successful. This demonstrates the need to include information about fire ac-tivity in numerical weather forecast models and observation assimilation schemes.
Acknowledgements. We acknowledge ECMWF and the German Weather Service for permitting access to the ECMWF archives. We appreciate the provision of data via the internet by the science teams at the Alaska climate research centre including those of MODIS, TOMS, POAM, SAGE and lidar group in Madison. We are thankful to N. Todo of Japan Airlines International Co. Ltd. for his image of a pyro-cb. This study was funded by the European Commission in the European Research Framework 5 program as part of the PARTS (no. EVK2CT200100112) project and the German Federal Ministry for Education and Research in the Framework of the Atmospheric Research 2000 program as part of NOXTRAM (07 ATF05).
Edited by: H. Wernli
References
Alaska Interagency Coordination Center (AICC) Report (see, http: //fire.ak.blm.gov): Review of the 2004 fire season, 2004. Andreae, M. O., Rosenfeld, D., Artaxo, P., Costa, A. A., Frank, G.
P., Longo, K. M., Silva-Dias, M. A. F.: Smoking rain clouds over the Amazon, Science, 303, 1337–1342, 2004.
Cofer, W. R., Winstead, E. L., Stocks, B. J., Goldammer, J. G., and Cahoon, D. R.: Crown fire emissions of CO2, CO, H2, CH4, and TNMHC from dense jack pine boreal forest fire, Geophys. Res. Lett., 25, 3919–3922, 1998.
Crutzen, P. J.: A discussion of the chemistry of some minor con-stituents in the stratosphere and troposphere, Pure Appl. Geo-phys., 106–108, 1385–1399, 1973.
Crutzen, P. J. and Andreae, M. O.: Biomass burning in the trop-ics: impact on atmospheric chemistry and biogeochemical cy-cles, Science, 250, 1669–1678, 1990.
Damoah, R., Spichtinger, N., Forster, C., James, P., Mattis, I., Wandinger, U., Beirle, S., Wagner, T., and Stohl, A.: Around the world in 17 days – hemispheric-scale transport of forest fire smoke from Russia in May 2003, Atmos. Chem. Phys., 4, 1311– 1321, 2004,
SRef-ID: 1680-7324/acp/2004-4-1311.
ECMWF: User Guide to ECMWF Products 2.1, Meteorol. Bull. M3.2, ECMWF, Reading, UK, 1995.
Eloranta, E. W.: High Spectral Resolution Lidar in Lidar: Range-Resolved Optical Remote Sensing of the Atmosphere, edited by: Weitkamp, K., Springer Series in Optical Sciences, Springer Ver-lag, New York, 143–163, 2005.
Emanuel, K. A. and Zivkovic-Rothman, M.: Development and eval-uation of a convection scheme for use in climate models, J. At-mos. Sci., 56, 1766–1782, 1999.
Forster, C., Wandinger, U., Wotawa, G., James, P., Mattis, I., Al-thausen, D., Simmonds, P., O’Doherty, S., Jennings, S., Kleefeld, C., Schnieder, J., Trickl, T., Kreipl, S., J¨ager, H., and Stohl, A.: Transport of boreal forest fire emissions from Canada to Europe, J. Geophys. Res., 106, 22 887–22 906, 2001.
Fromm, M., Bevilacqua, R., Hornstein, J., Shettle, E., Hoppel, K., and Lumpe, J. D.: An analysis of Polar Ozone and Aerosol Mea-surement (POAM) II Arctic polar stratospheric cloud Observa-tions, 1993–1996, J. Geophys. Res., 104, 24 341–24 357, 1999. Fromm, M. D. and Servranckx, R.: Transport of forest fire smoke
above the tropopause by supercell convection, Geophys. Res. Lett., 30, 1542, doi:1029/2002GL016820, 2003.
R. Damoah et al.: Pyro-convection 185
Fromm, M., Bevilacqua, R., Servranckx, R., Rosen, J., Thayer, P. J., Herman, J., and Larko, D.: Pyro-cumulonimbus injection of smoke to the stratosphere: observations and impact of a super blowup in northwestern Canada on 3–4 August 1998, J. Geo-phys. Res., 110, D08205, doi:10.1029/2004JD005350, 2005. Graf, H., Herzog, M., Oberhuber, J. M., and Textor, C.: The effect
of environmental conditions on volcanic plume rise, J. Geophys. Res., 104, 24 309–24 320, 1999.
Herring, J. A. and Hobbs, P. V.: Radiatively driven dynamics of the plume from the 1991 Kuwait oil fires, J. Geophys. Res., 99, 18 809–18 826, 1994.
Hsu, N. C., Herman, J., Gleason, J., Torres, O., and Seftor, C.: Satellite detection of smoke aerosols over a snow/ice surface by TOMS, Geophys. Res. Lett., 26, 1165–1168, 1999.
Iacobellis, S. F., Frouin, R., and Somerville, R. C. J.: Direct climate forcing by biomass-burning aerosols: impact of correlations between controlling variables, J. Geophys. Res., 104, 12 031– 12 045, 1999.
Jost, H. J., Drdla, K., Stohl, A., Pfister, L., Loewenstein, M., Lopez, J. P., Hudson, P. K., Murphy, D. M., Cziczo, D. J., Fromm, M., Bui, T. P., Dean-Day, J., Gerbig, C., Mahoney, M. J., Richard, E. C., Spichtinger, N., Pittman, J. V., Weinstock, E. M., Wilson, J. C., and Xueref, I.: In-situ observations of mid-latitude forest fire plumes deep in the stratosphere, Geophys. Res. Lett. 31, 11 101, doi:10.1029/2003GL019253, 2004.
Justice, C. O., Kendall, J. D., Dowty, P. R., and Scholes, R.: Satel-lite remote sensing of fires during the SAFARI campaign using NOAA advanced very high radiometer data, J. Geophys. Res., 101, 23 851–23 863, 1996.
Kato, S., Pochanart, P., Hirokawa, J., Kajii, Y., Akimoto, H., Ozaki, Y., Obi, K., Katsuno, T., Streets, D. G., and Minko, N. P.: The influence of Siberian forest fires on carbon monoxide concentra-tions at Happo, Japan, Atmos. Environ., 36, 385–390, 2002. Kaufman, Y. J., Justice, C. O., Flynn, L. P., Kendall, J. D., Prins,
E. M., Giglio, L., Ward, D. E., Menzel, W. P., and Setzer, A. W.: Potential global fire monitoring from EOS-MODIS, J. Geophys. Res., 103, 32 215–32 238, 1998.
Kaufman, Y. J., Ichoku, C., Giglio, L., Korontzi, S., Chu, D. A., Hao, W. M., Li, R.-R., and Justice, C. O.: Fire and smoke ob-served from Earth Observing System MODIS instrument – prod-ucts, validation, and operational use, Int. J. Remote Sensing, 24, 1765–1781, 2003.
Livesey, N. J., Fromm, M. D., Waters, J. W., Manney, G. L., San-tee, M. L., and Read, W. G.: Enhancement in lower stratospheric CH3CH observed by the Upper Atmosphere Research Satellite Microwave Limb Sounder following boreal forest fires, J. Geo-phys. Res., 109, D06308, doi:10.1029/2003JD004055, 2004. Lucke, R., Korwan, D., Bevilacqua, R., Hornstein, J., Shettle, E.,
Chen, D., Daehler, M., Lumpe, J., Fromm, M., Debrestian D., Neff, B., Squire,M., K¨onig-Langglo, and Davis J.: The Polar Ozone and Aerosol Measurement (POAM) III instrument and early validation results , J. Geophys. Res., 104, 18 785–18 799, 1999.
Mauldin, L., Zuan, N., McCormic, M., Guy, J., and Vaughn, W.,: Stratospheric Aerosol and Gas Expriment II instrument: A func-tional description, Opt. Eng., 24, 307–312, 1985.
Novelli, P. C., Masarie, K. A., Land, P. M., Hall, B. D., Myers, R. C., and Elkins, J. W.: Reanalysis of tropospheric CO trends: Effects on the 1997-1998 wildfires, J. Geophys. Res., 108, 4464,
doi:10.1029/2002JD003031, 2003.
Robock, A.: Surface cooling due to forest fire smoke. J. Geophys. Res., 96, 20 869–20 878, 1991.
Rorig, M. L. and Ferguson, S. A.: Characteristics of lightning and wildland fire ignition in the Pacific Northwest, J. Appl. Meteor., 38, 1565–1575, 1999.
Rozell, N.: Smoked pike on menu for Yukon Flats scientists, Alaska Science Forum, 1710, 2004.
Salby, M. L.: Fundamentals of Atmospheric Physics, International Geophysics Series, 622 pp., Academic Press, 1996.
Seinfeld, J. H. and Pandis, S. N.: Atmospheric Chemistry and Physics, 1326 pp., John Wiley, Inc., New York, 1998.
Spichtinger, N., Damoah, R., Eckhard, S., Forster, C., James, P., Beirle, T., Wagner, T., Novelli, P. C., and Stohl, A.: Boreal forest fires in 1997 and 1998: A seasonal comparison using transport model simulations and measurement data, Atmos. Chem. Phys., 4, 1857–1868, 2004,
SRef-ID: 1680-7324/acp/2004-4-1857.
Stohl, A., Hittenberger, M., and Wotawa, G.: Validation of the Lagrangian particle dispersion model FLEXPART against large scale tracer experiment data, Atmos. Environ., 32, 4245–4264, 1998.
Stohl, A. and Thomson, D. J.: A density correction for Lagrangian particle dispersion models, Boundary-Layer Meteorol., 90, 155– 167, 1999.
Stohl, A., Forster, C., Frank, A., Seibert, P., and Wotawa, G.: The Lagragian particle dispersion model FLEXPART version 6.2, At-mos. Chem. Phys., 5, 2461–2474, 2005,
SRef-ID: 1680-7324/acp/2005-5-2461.
Tanimoto, H., Kajii, Y., Hirokawa, J., Akimoto, H., and Minko, N. P.: The atmospheric impact of boreal forest fires in far eastern Siberia on the seasonal variation of carbon monoxide : observa-tions at Rishiri, a northern remote island in Japan, Geophys. Res. Lett., 27, 4073–4076, 2000.
Trentmann, J., Andreae, M. O., Graf, H.-F., Hobbs, P. V., Ottmar, R. D., and Trautmann, T.: Simulation of a biomass-burning plume: Comparison of model results with observations, J. Geo-phys. Res., 107, 4013, doi:10.1029/2001JD000410, 2002. Westphal, D. and Toon, O. B.: The short-term temperature response
to smoke from oil fires, J. Geophys. Res. Lett., 96, 22 379– 22 400, 1991.
Wotawa, G. and Trainer, M.: The influence of Canadian forest fires on pollutant concentrations in the United States, Science, 288, 324–328, 2000.
Wotawa, G., Novelli, P. C., Trainer, M., and Granier, C.: Inter-annual variability of summertime CO concentrations in the Northern Hemisphere explained by boreal forest fires in North America and Russia, Geophys. Res. Lett., 28, 4575–4578, 2001. Yurganov, N. L., Blumenstock, T., Grechko, I. E., Hase, F., Hyer, J. E., Kasischke, E. S., Koike, M., Kondo, Y., Kramer, I., Le-ung, F.-Y., Mahieu, E., Mellqvist, J., Notholt, J., Novelli, C. P., Rinsland, P. C., Scheel, E. H., Schulz, A., Strandberg, A., Suss-mann, R., Tanimoto, H., Velazco, V., Zander, R., and Zhao, Y.: A quantitative assessment of the 1998 carbon monoxide emis-sions anomaly in the Northern Hemisphere based on total col-umn and surface concentration measurements, J. Geophys. Res., 109, D15305, doi:10.1029/2004JD004559, 2004.