Assessing and Reducing Product Portfolio Complexity in the Pharmaceutical Industry
By
Kevin M. Leiter
B.S.E. Systems Science and Engineering, University of Pennsylvania, 2006
Submitted to the MIT Sloan School of Management and the Engineering Systems Division in Partial Fulfillment of the Requirements for the Degrees of
MASSACHUSETTS INSTITUTE
Master of Business Administration OF TECHNOLOGY
and
Master of Science in Engineering Systems
JUN 15 2011
In conjunction with the Leaders for Global Operations Program at the LIBRARI ES
Massachusetts Institute of Technology
ARCHNES
June 2011
0 2011 Kevin Leiter. All rights reserved. The author hereby grants MIT permission to reproduce and to distribute
publicly copies of this thesis document in whole or in part in any medium now known or hereafter created.
Signature of Author
May 6, 2011 MIT Sloan School of Management Department of Engineering Systems Certified by
Dr. RoOWelsch, Thesis Supervisor Eastman Kodak Leaders for Global Operations Professor of Management Professor of Statistics and Engineering Systems, MIT Sloan School of Management Certified by _
s o r. Antliony Sinskey, Thesis Supervisor Professor of BiologyHealth Sciences & Technlogy, and Engineering Systems, MIT Accepted by
ancy Leveson Professor of Lon'gineering Systems and Aeronautics & Astronautics, MIT Chair, Engineering Systems Division Education Committee Accepted by
Debbie Berechman Executive Director of MBA Program, MIT Sloan School of Management
This page has been intentionally left blank.
~w
Assessing and Reducing Product Portfolio Complexity in the
Pharmaceutical Industry
By
Kevin M. Leiter
Submitted to the MIT Sloan School of Management and the Engineering Systems Division on May 6, 2011 in Partial Fulfillment of the Requirements for the Degrees of Master of Business
Administration and Master of Science in Engineering Systems ABSTRACT
Overly complex product portfolios lead to inefficient use of resources and limit an organization's ability to react quickly to changing market dynamics. The challenges of reducing portfolio complexity are defining excess complexity, identifying it in the portfolio, and removing
it while still delivering value to customers. Novartis Pharmaceuticals, in agreement with the prevalent operational excellence culture, is exploring complexity reduction as a mechanism to reduce waste, costs, and inventory levels.
This thesis proposes the use of a comprehensive complexity reduction approach which targets both large and tail-end products for rationalization. The first complexity reduction focus area, redundant product rationalization, targets medium to large stock keeping units that do not directly satisfy a unique customer requirement. Removing redundant products has two benefits. First, larger products consume more resources, so the cost savings associated with removing a large redundant product are greater than that of smaller products. Second, sales levels will be preserved, as the demand for the rationalized product will shift to the remaining products that still meet the customer requirement in question. The second focus area is the more traditional tail-end pruning. By removing smaller, less profitable products and product groups, critical resources can be reallocated to more profitable products or new product launches.
Novartis has piloted and partially implemented this approach with impressive results. With the support of influential leaders across all functions, Novartis is expecting a reduction of
15% of the portfolio in terms of number of finished product stock keeping units and a reduction
of up to $22 million USD in inventory value. Other benefits include improvements in demand forecast accuracy, production write-offs, asset utilization, and replenishment lead times. Thesis Supervisors:
Dr. Roy Welsch
Eastman Kodak Leaders for Global Operations Professor of Management
Professor of Statistics and Engineering Systems, MIT Sloan School of Management Dr. Anthony Sinskey
ACKNOWLEDGMENTS
I would first like to thank the administrators, professors, students, alumni, and everyone
else associated with the Leaders for Global Operations program at the Massachusetts Institute of Technology. The dedication to ethical leadership and continuous improvement is truly
contagious, and I am confident that the knowledge I have gained during my time at LGO will stay with me throughout my career. Further, I will never forget the experiences I shared with classmates and alumni all over Europe.
Secondly, I would like to thank all of the professionals I had a chance to interact with at Novartis in Basel, Switzerland. The organizational support behind the complexity reduction initiative was instrumental in achieving the early successes and will ensure future
accomplishments. Specifically, I would like to acknowledge the complexity reduction team and the Pharma Supply Chain group. In addition to providing an optimal working atmosphere, I would like to thank Thomas Proell, Gilles Messier, Dirk Bergjohann, and Tina Bailey for repeatedly going out of their way to ease my transition to Switzerland.
Thank you to both of my advisors, Dr. Roy Welsch and Dr. Tony Sinskey, who provided timely and relevant guidance throughout my internship and during the development of this thesis.
I am extremely proud of the work completed, which I credit to the challenges and support I
received from my advisors.
Lastly, I must acknowledge Drew, Anita, Justin, Jeff, Inna, and the entire Elohssa family for consistently making the six-hour time difference and nine-hour flight seem insignificant and immaterial.
TABLE OF CONTENTS Abstract...3 Acknowledgm ents ... 5 Table of Contents ... 6 Table of Figures... 8 Glossary ... 9
Chapter 1 - Introduction and Problem Statem ent ... 10
1.1 The Pharm aceutical Industry ... 10
1.2 Novartis AG and Novartis Pharm aceuticals AG ... 11
1.3 Operational Excellence at Novartis Pharma - Drive for 5 ... 12
1.4 Motivation for Complexity Reduction and Problem Statement ... 13
1.5 Thesis Overview ... 14
Chapter 2 - Com plexity Reduction Literature ... 15
2.1 Complexity Reduction Challenges ... 15
2.2 Benefits of Complexity Reduction... 17
2.3 Sum m ary ... 18
Chapter 3 - Complexity Reduction in the Pharmaceutical Industry...19
3.1 Drivers of Portfolio Com plexity at Novartis ... 20
3.2 Current State of Product Portfolio at Novartis... 21
3.3 Proposed Complexity Reduction Process... 24
3.4 Critical Success Factors ... 25
3.4.1 Key Stakeholders ... 25
3.4.2 Alignment with Strategic Goals... 25
3.4.3 Data Quality and Availability ... 26
3.4.4 Cost Valuation ... 26
3.5 Summ ary ... 27
Chapter 4 - Redundant Product Rationalization ... 28
4.1 Process ... 29
4.2 Scope Definition ... 35
4.2.1 M arket Scope ... 36
4.2.2 Product Scope ... 37
4.3 Implementation in Local M arkets... 38
4.4 Critical Success Factors ... 40
4.4.1 Local M arketing Support ... 40
4.4.2 Coordination with Global Organization... 41
4.4.3 Form al Inform ation Transfer Process ... 41
4.5.1 Case Study: Redundant Product Rationalization Proof-of-Concept Pilot .42
4.5.2 Local M arket Benefits... 44
4.5.3 Global Benefits ... 45
4.6 Shortcomings of Redundant Product Rationalization... 45
4.7 Summary ... 46
Chapter 5 - Tail-End Pruning ... 47
5.1 Approach... 47
5.2 Identifying the Tail-End...51
5.2.1 Applying Mixed Integer Linear Programming Optimization... 51
5.2.2 Case Study: Identifying the Tail-End with Imperfect Data at Novartis....53
5.3 Critical Success Factors ... 54
5.3.1 Integration with Standard Operating Processes ... 54
5.3.2 Alignment with Strategic Goals... 54
5.4 Benefits of Tail-End Pruning ... 55
5.5 Shortcomings of Tail-End Pruning ... 55
5.6 Summary ... 56
Chapter 6 - Conclusion ... 57
6.1 Key Findings... 58
6 .2 R esu lts...5 9 6.3 Future Opportunities for Novartis... 62
6.3.1 Full-Scale Redundant Product Rationalization Implementation...62
6.3.2 Portfolio Complexity Governance, M etrics, and Dashboard... 62
6.3.3 Identification of Future Complexity Reduction Focus Areas... 62
6.3.4 Revised Cost Valuation Process ... 63
6.3.5 Complexity Reduction in New Product Introductions... 63
6.4 Closing Statement ... 63
TABLE OF FIGURES
Figure 1 -Global TechOps network (van Laar, 2007)... 12
Figure 2 -Drive for 5 work streams (Drive for 5, 2010)...13
Figure 3 - Illustrative complexity fingerprint (Scheiter, 2007)...16
Figure 4 -Sales contribution and finished product inventory contribution of N ovartis' product portfolio... 22
Figure 5 -Novartis Portfolio breakdown by SKUs ... 23
Figure 6 -Complexity reduction process...24
Figure 7 -Redundant product rationalization focus area...28
Figure 8 -Redundant product rationalization process ... 30
Figure 9 -Illustrative example of identifying redundant products ... 33
Figure 10 -Selection of brand review worksheet (illustrative data) ... 34
Figure 11 - Selection of CPO and brand summary reports (illustrative data) ... 34
Figure 12 -Novartis Region Europe CPO prioritization analysis (illustrative data)...36
Figure 13 -Brand prioritization analysis ... 38
Figure 14 -Pilot implementation plan ... 39
Figure 15 -Selected results from proof-of-concept pilot ... 44
Figure 16 -Tail-end pruning focus area ... 47
Figure 17 -Tail-end pruning process... 48
Figure 18 -Pharmaceutical value chain and cost implications of pruning different product groups ... 49
GLOSSARY
Country Pharma Organization (CPO): Country-specific Novartis affiliates located in each of
the local markets that Novartis Pharma conducts business. While these organizations are primarily sales and marketing organizations, some local supply chain and finance
operations are performed there. These organizations purchase product from headquarters at Novartis Pharma Basel and then sell the products to distributers, providers, and
patients.
Dosage Form: The physical form of a dose of a chemical compound used as a drug or
medication intended for administration or consumption. Common dosage forms include pill, tablet or capsule, solution or syrup, aerosol or inhaler, liquid injection, and natural or herbal form. Various dosage forms may exist for a single particular drug, since different medical conditions can warrant different routes of administration (Dosage form, n.d.). Dosage Strength: The concentration or volume of active ingredient included in a dosage. Medical Need: Drugs that have been classified as critical treatments for the patient base. These
could be drugs that provide life-saving treatments, drugs that have no alternative treatment in the market, or drugs that are part of a pandemic preparedness agreement. There are Global Medical Need drugs as well as drugs that are Medical Needs in specific countries and markets only.
Primary Pack: The first stage of packaging. The primary pack is the mechanism that comes in
contact with the product, such as a blister pack, a tablet container, syringe, or bottle. Primary pack(s) are processed into finished packs after customer labeling has been applied.
Chapter 1
- INTRODUCTION AND PROBLEM STATEMENT1.1 The Pharmaceutical Industry
The pharmaceutical industry has been and will continue facing increasing pressures to reduce costs. These pressures include: skyrocketing research and development (R&D) costs, rapidly decreasing periods of exclusivity, increasing pressure from the generics marketplace, increasing price scrutiny, and greater enforcement of current good manufacturing practices from regulatory agencies (Neway, 2003).
Extremely high R&D costs have always been a characteristic of the pharmaceutical industry. In fact, pharmaceutical industries invest approximately three to four times more in R&D, relative to sales, than traditional manufacturing companies (Cohen, 2005). Additionally, R&D costs continue to increase dramatically. Over the past 30 years, the cost to develop a new drug has increased from $138 million USD in 1975 to $1.318 billion USD in 2006 (PhRMA Industry Profile, 2009).
Patents granting exclusive rights are increasingly hard to come by and significant patent expirations are looming in 2011. In the United States, a loophole allowing companies to receive multiple extensions on their initial patents has been closed by the "Greater Access to Affordable Pharmaceuticals Act," which limits the number of 30-month patent extensions to one (US House of Representatives, 2003). According to International Marketing Services (IMS), patents for products with sales of more than $30 billion USD are expected to expire in 2011 which will continue to shift major therapies to generic dominance (IMS Health, 2011). In general, the price for a drug falls by 20% when the first generic alternative enters the market, and by as much as
90% as other generics enter (Nocera, 2006).
Market growth rates are expected to remain relatively modest in developed markets. According to IMS, the global pharmaceutical market is expected to grow 5-7 percent in 2011, compared to a 4-5 percent increase in 2010, but this growth rate is largely a result of expected
growth rates of 15-17 percent in emerging markets (IMS Health, 2011). The introduction and uptake of innovative new drugs in 2011, including five potential blockbuster products, will
largely dictate the market growth in 2012 (IMS Health, 2011).
Increasing R&D costs, pharmaceutical price reductions as a result of generic competition and political pressures, and slowing growth rates in developed markets highlight the need for pharmaceutical producers to reduce costs and improve the efficiency in which mature products are managed. Additionally, resources will need to be available to launch and produce the upcoming innovative new products.
1.2 Novartis AG and Novartis Pharmaceuticals AG
Novartis AG was created in 1996 through the merger of Ciba-Geigy and Sandoz, and currently is composed of four divisions: Pharmaceuticals, Sandoz (generic pharmaceuticals), Vaccines and Diagnostics, and Consumer Health (over-the-counter products). In 2010, Novartis
AG recorded net sales of $50.6 billion USD, which represents a 14% increase over 2009 net
sales (Novartis International AG, 2010). Novartis AG is headquartered in Basel, Switzerland. Novartis' mission statement is:
We want to discover, develop and successfully market innovative products to prevent and cure diseases, to ease suffering and to enhance the quality of life. We also want to provide a shareholder return that reflects outstanding performance and to adequately
reward those who invest ideas and work in our company (Novartis International AG,
2010).
Novartis AG is an industry partner with the Leaders for Global Operations (LGO) program at the Massachusetts Institute of Technology (MIT). LGO is a partnership between MIT School of Engineering, MIT Sloan School of Management, and several industry partner companies. LGO fellows receive a Master of Science in Management or a Master of Business Administration, and a Master of Science in one of several participating engineering disciplines. This thesis is the result of a six-month internship within the technical operations group of the Pharmaceuticals division of Novartis.
Novartis Pharmaceuticals AG (Novartis Pharma), the largest division of Novartis AG accounted for $30.6 billion USD in net sales in 2010 (Novartis International AG, 2010).
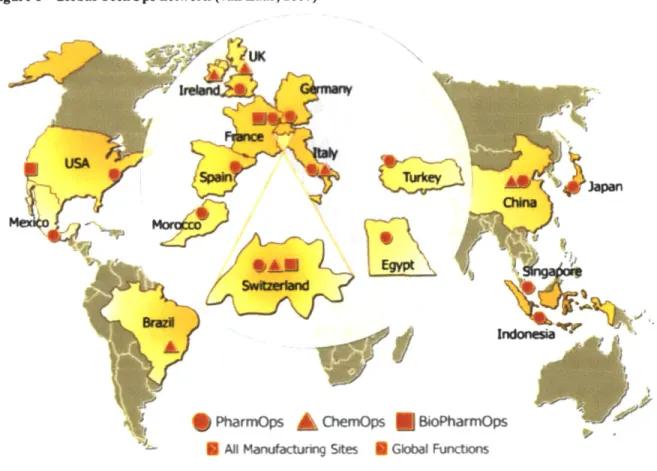
Novartis Pharma employs almost 60,000 full time associates (Novartis International AG, 2010). The technical operations (TechOps) group in Novartis Pharma is responsible for production, distribution, and facilities across the worldwide network. As of 2007, Global TechOps produced
about 350 brands, operated or managed 32 production plants, including 8 third-party plants, and employed 9000 associates (van Laar, 2007). Figure 1 illustrates the global TechOps production network. As of 2011, Novartis Pharma sells products in approximately 140 countries (Novartis Pharmaceuticals Corporate Fact Sheet, 2011). The Pharma Supply Chain (PhSC) group within TechOps is responsible for managing end-to-end material movements between the 32 production sites, to distribution centers, and, finally, to the customers located in the 140 country markets.
Figure 1 -Global TechOps network (van Laar, 2007)
* PharmOps A&ChemOps BoPharmOps
0 Al Manufactunng Sites 6 Gkbal Functons
1.3 Operational Excellence at Novartis Pharma - Drive for 5
Operationally, Novartis is well regarded in the pharmaceutical industry. In 2007, TechOps leadership expressed the desire to be the "Toyota of the Pharma Industry" (van Laar,
2007). Operational excellence at Novartis Pharma is founded on three primary pillars: Lean
Manufacturing, Process-Oriented Organization (POO), and Enhanced Business Process Re-engineering (eBPR).
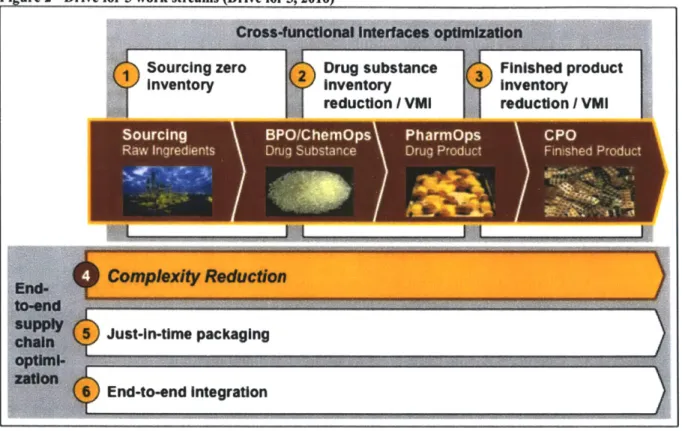
In early 2010, Novartis Pharma launched the Drive for 5 program, a comprehensive inventory task force. The vision of the Drive for 5 program is to "catapult Novartis Pharma from a lagging position to a leader in the industry" in terms of average months of inventory on hand, and "to drive the transition to a customer centric, end-to-end integrated supply chain" (Drive for
5, 2010). Figure 2 illustrates the six work streams that comprise the Drive for 5 program, one of
which is product portfolio complexity reduction.
Figure 2 -Drive for 5 work streams (Drive for 5, 2010)
1.4 Motivation for Complexity Reduction and Problem Statement
Industry pressures, including rising R&D costs, selling price reductions, and modest growth rates, are squeezing pharmaceutical companies and resources tighter than they are accustomed to. Novartis Pharma has the advantage of previously instilling an operational excellence culture and has committed to using these fundamentals to remove waste across the entire organization. A preliminary analysis of the product portfolio has indicated the possibility that excess complexity is resulting in inefficient use of resources (see Section 3.2). Novartis is seeking a complexity reduction solution to identify and assess products which, when removed
from the portfolio, allow for more efficient delivery of value to patients, customers, and the organization as a whole. This thesis focuses on the product portfolio complexity challenges and proposes a comprehensive complexity reduction approach applicable to the pharmaceutical industry.
1.5 Thesis Overview
This thesis is organized into the following chapters:
* Chapter 1 provides an overview of current trends in the pharmaceutical industry impacting complexity reduction efforts, background on Novartis AG and Novartis Pharmaceuticals AG, and introduces the problem of portfolio complexity
* Chapter 2 provides a summary of available research around complexity reduction * Chapter 3 introduces the comprehensive complexity reduction approach discussed
in this thesis
* Chapter 4 details the first focus area of the complexity reduction approach: redundant product rationalization
e Chapter 5 details the second focus area: tail-end pruning
* Chapter 6 concludes the thesis with a discussion of key findings, results, and future complexity reduction opportunities
Chapter 2
- COMPLEXITY REDUCTION LITERATUREThe pharmaceutical industry is experiencing unprecedented change in market dynamics, which are causing companies to explore new cost saving concepts such as complexity reduction. Although it is a relatively understudied approach in the pharmaceutical industry, complexity reduction, also referred to as SKU rationalization, SKU reduction, product variety reduction, or product pooling, has been studied and implemented in other industries, such as consumer products and retail. This chapter draws on experiences and literature from other industries to introduce the challenges and benefits associated with complexity reduction.
2.1 Complexity Reduction Challenges
Companies are constantly looking to grow and one of the most common strategies for doing so is to create new products, but, although new products may increase revenues, they do not guarantee profits (Van Hoek, 2006). This way of thinking has manifested itself in the form
of large, highly customized product portfolios. Lost in the customization are increased production, distribution, and other organizational costs. However, not all complexity is bad.
"Quite often, value-adding complexity is a real competitive advantage and should be actively and efficiently controlled" (Scheiter, 2007).
In addition to resisting the urge to over-customize a portfolio, identifying areas of "value destroying complexity" is another primary challenge to complexity reduction. Scheiter et al. suggests using a "complexity fingerprint" to identify specific areas of excess complexity. The complexity fingerprint, shown in Figure 3, "is created by identifying the specific complexity drivers of a company - such as existing technologies, brands, products, and customers - and comparing this total number against the segment producing 80 percent of total EBIT" (Scheiter,
2007). A large gap, as illustrated by the large yellow area under the Products (SKUs) and
Customer drivers, between the total number and the segment producing 80 percent of total EBIT, indicates the need for complexity reduction measures. "The complexity fingerprint is a useful tool because it enables transparency, catches management's attention, and leads to focusing and prioritizing problematic areas" (Scheiter, 2007). A leader in the hypothetical organization with this complexity fingerprint can easily identify the areas in his or her business. For example,
packaging is not a driver of value destroying complexity as 17 of the 33 (52%) of the packaging configurations account for 80% of the total EBIT contribution of packaging. Now contrast this with the customer driver, where only 214 of the 2,142 total customers (10%) contribute 80% of the total EBIT. The complexity reduction leader would focus resources and analytical effort to determining if value destroying complexity can be reduced by changing how some of the less beneficial customers (i.e. those falling in the 90% of customers which make up less than 20% of total EBIT) are managed or by recommending the organization stops satisfying these customers demand all together. Additionally, the leader will feel comfortable with the level of complexity in packaging and not need to invest any additional time or effort to reduce it.
Figure 3 - Illustrative complexity rmgerprint (Scheiter, 2007)
riversOEUEU
EU
0
CD
Number per driver that produce 80% of the total EBIT
Total number per driver Serr A T KanrqJ
Further, there are risks of reducing complexity in the wrong areas. There is a real risk "that a company cuts too deeply into its revenue streams and discovers it has discontinued products that key customers care for, damaging important relationships" (Van Hoek, 2006). Companies can and should conduct frequent product reviews with customers to ensure the correct products are being targeted.
Lastly, the traditional complexity reduction philosophy, removing tail-end products, does not always achieve the desired results. "Focusing solely on tail-end SKUs has little actual
16 0
0
impact - little change in inventory, gross margin, market share, changeovers, or distribution complexity" (Byrne, 2007). Additionally, any cost savings resulting from tail-end products tend to be short-term as the tail-end of the portfolio always replaces itself over time.
2.2 Benefits of Complexity Reduction
The benefits of a successful complexity reduction process can be felt across the entire organization. In fact, A.T. Kearney, a global strategic management consulting firm, estimates that, "on average, systematic complexity management can lead to an upturn in [earnings before interest and tax (EBIT)] of 3 to 5 percentage points" (Scheiter, 2007). This increase in EBIT comes from optimizing production and logistics, reducing material costs, adjusting service capacities, and increased margins (Scheiter, 2007). Retail sales per SKU at Clorox, a consumer products company with revenue of $5.5 billion in 2010, have grown by more than 25%, and net customer sales per SKU have almost doubled over the past four years as a result of strategically reducing SKUs (Van Hoek, 2006). Lastly, Jie Zhang and Aradhna Krishna found that brands with higher market shares, higher price levels, and more frequent promotions tended to gain share when effective SKU reduction processes are in place (Zhang, 2007). This conclusion was validated with a quantitative model based off of an anonymous online retailer. However, Zhang and Krishna did find that a drastic reduction of SKUs in the same brand had negative impacts on the brand performance, and that brands with small market share were less likely to experience the benefits of complexity reduction.
When uncontrolled and unregulated, portfolio complexity can have detrimental impacts on production. Excess complexity "acts to reduce economies of scale and buyer power, and to increase costs for production and logistics" (Scheiter, 2007). Additionally, "with a plethora of SKUs, forecasting and planning is not only difficult but also requires more of everything -supervisors, training, inventory, production-line changeovers, capital, and time and expense in product development" (Byrne, 2007). When a complexity management process focuses on large, but unnecessary products, production-related benefits include reduced manufacturing footprint,
fewer changeovers, shuttered or dedicated production lines, fewer out-of-stocks, and reduced distribution channel footprint (Byrne, 2007).
2.3 Summary
This section is meant to be a discussion of some of the research conducted around complexity management to introduce some of the challenges and benefits pharmaceutical companies can expect to experience when they embark on their own complexity reduction initiatives. Unfortunately, quantifying the benefits is difficult because it is hard to isolate the impact of a complexity reduction effort from other changing variables such as market dynamics and other internal initiatives. Complexity reduction, in terms of process and benefits, is
extremely cross-functional, thus measurements must be high-level enough to include efficiency gains in production, finance, and marketing. Despite measurement difficulties, most sources believe the expectation of various cost savings and efficiency gains as a result of complexity management is valid, although the magnitude of savings is questioned. However, there is consensus that effective product portfolio management is an essential capability for companies
looking to get the most out of their resources and preparing to react quickly to changing market conditions.
Chapter 3
- COMPLEXITY REDUCTION IN THE PHARMACEUTICAL INDUSTRYReducing the complexity of a product portfolio can be a powerful mechanism to reduce operating costs throughout the organization. Chapter 2 summarizes some of the literature that is available, but it has become increasingly clear that complexity reduction in a pharmaceutical organization is an understudied topic. Why is there little literature focusing on the
pharmaceutical industry? It is likely because, historically, cost reduction has not been a primary focus of large pharmaceutical companies. Demand for medical treatments is largely price inelastic. In fact, pricing in general is not heavily dependent on the cost to produce the product. Pricing is more correlated with the perceived value of the treatment, the size of the potential patient base, the extremely high development costs, and separate negotiations or agreements with local health authorities and large distributers.
Market conditions in the pharmaceutical industry are changing. Some products are becoming commoditized with the rise of higher quality generic products. Development and production capabilities are expanding globally, which is increasing competition. Operational excellence, including cost reduction initiatives, is getting more attention in the industry. Novartis Pharmaceuticals has recognized these new market pressures and is in the process of transforming end-to-end operations. In past years, Novartis has seen a significant increase in average inventory on hand as compared to other large pharmaceutical producers. The Drive for
5 program was launched to drastically reduce inventory levels over the next three years. Complexity reduction is one initiative underway to achieve this goal.
In this chapter, we will focus on Novartis' complexity reduction effort as an example of how excess complexity can be removed from a large pharmaceutical company's product portfolio. First, we will discuss the drivers of portfolio complexity at Novartis. Next, we will provide a description of the current state of Novartis' portfolio as of 2010. Lastly, we will discuss the proposed complexity reduction approach with a discussion of several critical success factors. Subsequent chapters will further detail the two-part complexity reduction approach.
3.1 Drivers of Portfolio Complexity at Novartis
Novartis had approximately 14,000 finished product SKUs in the active product portfolio as of June 2010. This number alone does not have a lot of significance, as consumer product companies can easily have over 50,000 finished product SKUs and still have a very efficient product offering. Similarly, other pharmaceutical companies may have significantly fewer. SKUs because of a focus on specific treatments or markets. This section discusses the causes and drivers of portfolio complexity at Novartis in an effort to provide context around the 14,000 SKU value.
The first major driver of SKU proliferation is the number of markets in which Novartis currently operates. As of 2011, Novartis sells products in approximately 140 countries (Novartis Pharmaceuticals Corporate Fact Sheet, 2011). In general, there is a unique SKU created for each market the product is sold in. Some exceptions apply in developing countries where a product with common language packaging is sold. This same SKU can be sold in multiple countries.
The second cause of extensive SKU creation is the introduction of multiple dosage forms, such as film-coated tablets, pre-filled syringes, or sugar-coated tablets, and multiple dosage strengths, which measures the amount of the active ingredient in each dosage, for the same brand in the same market. Again, this varies by market and by brand, but in a major market, it is not uncommon to see more than three dosage forms for a major brand as well as more than three dosage strengths for each dosage form.
The next level down from dosage strength is an assortment of different pack sizes, volumes, and packaging mechanism. For each country, brand, dosage form, dosage strength combination, Novartis creates several different packages to distribute in different sales channels. Generally, each of the combinations mentioned above will have at least one sample size pack for distributers and providers, at least one bulk pack sold to hospitals and clinics, and an assortment of commercial packs.
Further adding to portfolio complexity is the fact that production sites have unique SKUs. For example, if the same product for the same market is sourced from multiple production plants, there will be multiple SKUs created for these products. This is necessary for regulatory
purposes. Products, including the production locations, are registered with regulatory agencies in each market and products from different sites are considered unique regardless of whether the process and materials are exactly the same.
The last driver of portfolio complexity is the difficulty of retiring a product. There are many forces and agreements that restrict pharmaceutical companies from ceasing supply of certain products. For one, it is common for a pharmaceutical company to enter into distribution
agreements with other companies or agencies that include a group of products. These agreements usually include a supply requirement for all products for an agreed to amount of time. Breaking these agreements has financial and brand perception implications. Further, Novartis, along with other pharmaceutical companies, enters into charitable agreements in which
they agree to supply a market with products independent of profitability. Similarly, Novartis produces some drugs that have been classified as medical needs. Law often restricts retiring charitable or medical need products unless an alternative product is available in the market at a similar price. Finally, pressures from patient groups are often a factor when a company is deciding to end supply. For example, some treatments have been largely replaced by new treatments, but patients who are satisfied with the results of the original treatment are,
understandably, not very receptive to switching treatments. This results in a situation where the customer base is shrinking over time and the production of the old treatment is increasingly expensive. It is a difficult decision for a pharmaceutical firm to decide that the patient population is too small to justify continued production.
All of these drivers have contributed to the current state of product portfolio complexity
in pharmaceutical companies. The following sections discuss Novartis' current product portfolio and introduces a complexity reduction process that can overcome the described complexity drivers in an efficient and effective manner.
3.2 Current State of Product Portfolio at Novartis
The complexity reduction initiative was launched at Novartis in early 2010 as part of the Drive for 5 operations improvement program. A preliminary analysis of the entire portfolio prior to the launch of the initiative produced the findings summarized in Figure 4. Based on this
analysis, it certainly appears that Novartis has excess complexity and that there are substantial inventory benefits to reducing complexity. The last 60% of SKUs contributes less than 5% of total sales value while making up for 22% of total fmished product inventory value. Although
Figure 4 - Sales contribution and finished product inventory contribution of Novartis' product portfolio
Sales value
Percent
100
50
0
0
20
40
6p
8p
100
Numbr of SKUsPercent
65
Inventory
Contribution
Percent
13 6the warning signs of excess complexity are evident, further analysis is needed before Novartis could simply decide to cut production on the tail-end of the portfolio. For example, the tail-end includes some medical need products, sample packs not commercially sold, recently launched products without historical sales, products that are complimentary treatments for very profitable products, and products with supply agreements. Additionally, there are some small volume products that have high profit margins. In an environment with excess production capacity, it may not be beneficial to cut these relatively low sales and volume products.
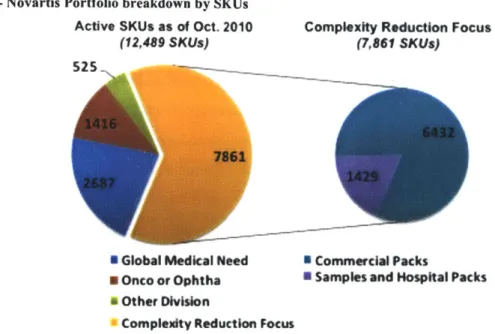
Figure 5 depicts Novartis' portfolio in a different manner. Sales and inventory are not included in this analysis. The pie chart shows a breakdown of the portfolio by number of SKUs into groups that are relevant to Novartis' strategic objectives in an effort to define the scope of the complexity reduction initiative. As Novartis' top priority is patient care and pandemic
22
Figure 5 -Novartis Portfolio breakdown by SKUs
Active SKUs as of Oct. 2010 Complexity Reduction Focus
(12,489 SKUs) (7,861 SKUa)
* Global Medical Need 8 Commercial Packs
a Onco or Ophtha U Samples and Hospital Packs
i Other Division
* Complexity Reduction Focus
preparedness, medical need products (shown in dark blue) were excluded from pruning
consideration. Similarly, oncology products (shown in red with ophthalmology products) were determined to be critical strategic products that would not be considered at this time. Some oncology products could be considered at a later date, but the reputation risk of removing an oncology product was too large in 2010. Ophthalmology products were determined to be out of scope due to a large on-going acquisition. There were too many moving parts and large-scale changes to assess the future ophthalmology portfolio from past data. Lastly, products sold to other Novartis divisions, such as Sandoz and Novartis Consumer Health, were analyzed separately because the pricing and demand characteristics operated very differently from other products sold externally. This left about 8000 SKUs, 1500 of which are samples or hospital packs, to be considered for complexity reduction.
This is a very different picture than the one provided in Figure 4. 60% of SKUs may only account for less than 5% of total sales, but many products that should be evaluated on different criteria and many strategic products are likely included in that 60%. However, there was consensus at Novartis that portfolio complexity can and should be reduced. The key at this point was to develop a process that identifies the correct products in a manner that minimizes
sales loss, profit loss, and on-hand inventory while alleviating the necessary resources.
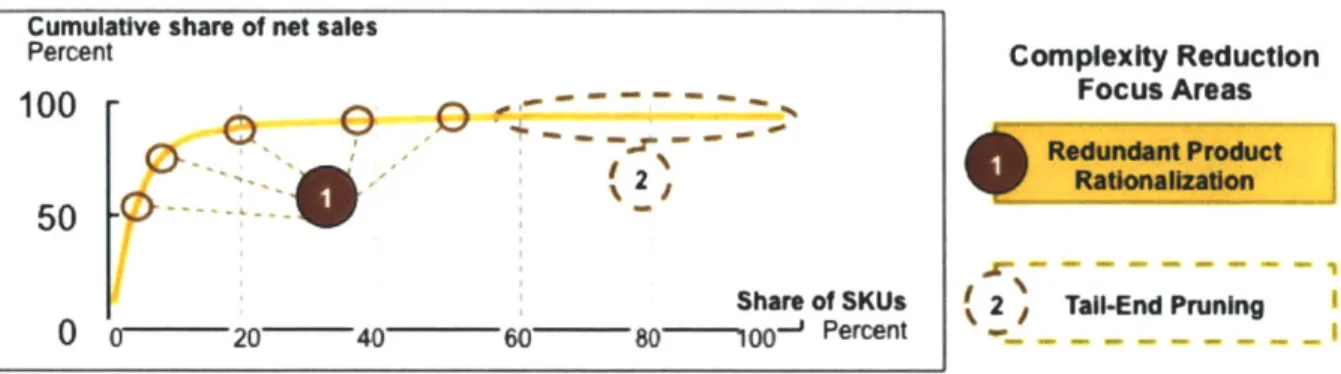
3.3 Proposed Complexity Reduction Process
To effectively reduce complexity in a pharmaceutical product portfolio, it is advisable to have two parallel focus areas: redundant product rationalization and tail-end pruning. These two focus areas are fundamentally different and target different products. Redundant product
rationalization, as you can see in Figure 6, targets medium to large SKUs that do not directly satisfy a unique customer need. When these redundant products are removed from the portfolio,
100% of the sales are transferred to remaining products, thus there is no revenue loss.
Additionally, these larger products consume more resources and require more inventory. By streamlining the product offering, substantial cost savings can be realized.
Figure 6 - Complexity reduction process
Cumulative share of net sales
Percent Complexity Reduction
Focus Areas
100
50
Share of SKUs T
0 0 - 20 40 60 80----100' Percent
Tail-end Pruning is the more traditional SKU rationalization approach, as it focuses on eliminating the lowest volume, least profitable products from the portfolio. In the
pharmaceutical industry, identifying the tail-end is a difficult process. As explained in Section
3.1, many tail-end products are not valid candidates for pruning because of agreements, strategic
value, or high profitability (in terms of percent margin). Contrary to other industries with lower margins and relatively less health critical products, there is substantial risk in blindly removing the tail-end of the portfolio. A thorough analysis, detailed in Chapter 5 is needed to accurately identify the tail-end and to identify the small, but critical products that must remain in the portfolio.
Chapters 4 and 5 detail the two focus areas for complexity reduction. The two processes are thoroughly explained, implementation strategies are discussed, and the relative benefits and shortcomings are discussed.
3.4 Critical Success Factors
Complexity reduction is a simple concept and the benefits, in theory, are hard to deny, but in practice it is a difficult process to implement. Adding to this challenge is the fact that the benefits are difficult to quantify and predict precisely. Additionally, there are cultural barriers to this effort at almost every step. Depending on whom you are speaking to in the organization, it may become controversial to talk about removing a product from a market or to talk about reducing production volume at a specific plant. In order to overcome these challenges and successfully implement a complexity reduction process there must be strong vocal support from key stakeholders, the process must be aligned with the organization's strategic goals, data must be of high quality and readily available, and a mechanism to accurately estimate complexity costs beyond cost of good sold must be in place. These critical success factors are discussed further in the following sections.
3.4.1 Key Stakeholders
Before the process can be implemented, a group of influential stakeholders must be gathered. This group, after they agree on the objectives of complexity reduction, will be a necessary influence over others in the organization. Redundant product rationalization is only successful when the marketing organization is incentivized to make operational improvements.
A deep-rooted trust in the benefits of complexity reduction may be necessary to implement
tail-end pruning, as the difficulties in accurately quantifying complexity costs may make the business case appear to be negative. A strong group of supportive stakeholders will be necessary to overcome the inevitable naysayers. Additionally, the benefits of reducing complexity take some
time to develop, especially in the pharmaceutical industry, where deregistering products can take over a year. Key stakeholders must demonstrate patience in the process.
3.4.2 Alignment with Strategic Goals
A great way to gain the support of key stakeholders is to ensure the complexity reduction
efforts are aligned with the strategic goals of the organization. Complexity reduction is a powerful tool that has many applications. It can be used as a mechanism to reduce inventories through improved forecast accuracy. It can be used to identify high cost products that could be candidates for divestment to external companies. It can be used to streamline production
technologies or even to help free up critical resources in the most efficient manner for new products and production footprint decisions. Additionally, the organization's strategy should include a plan on how to use the resources made available after complexity reduction. These resources could be used to meet unmet demand, alleviate over-utilized equipment, or free up resources in preparation for a large new product launch.
At Novartis, there is an on-going goal of drastically reducing inventories and a culture committed to cost reduction and process improvement. After communicating how complexity reduction naturally supports these organization-wide goals, key stakeholders were eager to support this initiative. If a company's strategic goals include a commitment to high product variety, this process may not get the necessary support to be successful.
3.4.3 Data Quality and Availability
To facilitate an efficient and complete analysis, product, market, and production data must be of high quality and readily available. Both focus areas of the proposed complexity reduction approach require extensive quantitative and qualitative analysis. Some data elements are usually easily available, including sales, volumes, and demand forecast. Other data elements,
such as true complexity costs and treatment information, are harder to gather but equally critical to the analysis. Substantial effort must be applied to gathering all of the available data for the entire portfolio before analysis can begin.
3.4.4 Cost Valuation
Lastly, an agreed upon method to estimate complexity costs of individual products is a critical piece of the analysis as well. Complexity costs include cost of good sold as well as other
overhead costs that could be avoided if the product is rationalized from the portfolio. These costs include marketing resources, production changeovers, intermediate inventories, testing and quality resources, and regulatory costs. These costs can be significant and need to be included in any SKU reduction business case.
3.5 Summary
The pharmaceutical industry has many intricacies that distinguish it from other industries with well-documented SKU rationalization approaches. These intricacies demand a more thorough analysis of the product portfolio in terms of market usage and production data. The proposed complexity reduction process for the pharmaceutical industry involves a market-centric
redundant product rationalization focus as well as a tail-end pruning focus. The redundant product rationalization process seeks to build an efficient portfolio based off of identified
customer requirements. If a product does not meet an explicit customer requirement, it should be removed from the portfolio. All identified redundant products, when rationalized, will result in
100% sales compensation by another product that remains in the portfolio. The tail-end pruning
process intends to identify small, underperforming products that consume resources that are better used elsewhere. With this process, there is the potential of losing some revenue, but the cost savings, which includes complexity costs, should make up for any loss in revenue.
Additionally, the newly available resources should be applied to other products in an effort to grow revenues for lower cost products. In order to successfully implement this complexity reduction approach, there must be strong vocal support from key stakeholders, the process must be aligned with the organization's strategic goals, data must be of high quality and readily available, and there must be a mechanism to accurately estimate complexity costs beyond cost of goods sold. This comprehensive complexity reduction approach has the potential to greatly reduce costs while making critical resources available for reassignment. The following two chapters further detail the two focus areas, redundant product rationalization and tail-end pruning.
Chapter 4
- REDUNDANT PRODUCT RATIONALIZATIONThe first of two focus areas for complexity reduction in a large pharmaceutical company is redundant product rationalization. This is a bottom-up approach focusing on identifying true customer requirements, and, then, creating the optimal product portfolio to meet all of the identified requirements. As depicted in Figure 7, all products, including those with high sales
Figure 7 - Redundant product rationalization focus area
Cumulative share of net sales
Percent Complexity Reduction
100 -
0-
- - - -- Focus Areas50
---Share of SKUs (2 Tall-End Pruning 0 0 20 40 60 8 0- 1 lo-- Percent -
--and margin, are in-scope for this exercise. In fact, high volume SKUs offer the greatest cost savings opportunity. Redundant product rationalization seeks to identify and eliminate products that do not directly address a documented customer need. For example, suppose a
pharmaceutical company offers both a finished pack to cover one month of treatment and a two-month pack in Brand X in the same market, and suppose both products have extremely strong sales. By speaking with medical providers prescribing this treatment, it is brought to light that patients requiring Brand X must have monthly check-ups, at which point the provider decides whether to continue prescribing Brand X or not. Given this scenario, it is clear that the customer requires a one-month pack of Brand X, and anything in excess of this amount is actually
suboptimal because of the potential for the patient to continue treatment beyond the provider's directions. Although it is not immediately clear why the two-month pack has high sales, it is clear that this particular customer requirement can be met with one SKU instead of two.
Rationalizing the redundant product (i.e. the two-month pack) has significant benefits, which are detailed in Sections 4.5.2 and 4.5.3. Most notable is the potential to transfer 100% of the sales of the two-month pack to the one-month pack while streamlining sales and operations efforts and improving patient care.
The redundant production rationalization approach piloted at Novartis is detailed in this chapter, along with a discussion of the recommended implementation plan, critical success factors, benefits, and shortcomings of utilizing this approach.
4.1 Process
As previously alluded to, redundant product rationalization is a fundamentally different way of reducing portfolio complexity, SKU rationalization, and streamlining operations. This process is driven by the sales and marketing organization who are the closest to the customers
and end-users. Typically, the supply chain or finance organization leads SKU-reduction exercises (Byrne, 2007) but at Novartis, and likely other pharmaceutical and other large corporations, the product and customer knowledge in these organizations is not adequate to identify redundant products. This results in a disproportionate focus on the tail-end of the product portfolio. Because these data are usually available to the supply chain and finance groups, criteria such as low sales, low margin, and low volume are used exclusively to identify
SKU rationalization candidates. Although extremely important to the analysis, these criteria
alone are not sufficient. Other information, such as health authority agreements, local market purchasing power, complimentary treatments, and medical need classifications, is needed to make informed decisions and to create the optimal portfolio. The best source of this information is the sales and marketing organization. Further, because redundant product rationalization requires deep knowledge of the local customers and market, CPO sales and marketing representatives are critical to this process.
As stated, the success of this approach depends greatly on the involvement and leadership of the sales and marketing group. Unfortunately, there is a natural bias against redundant
product rationalization because of the belief in the sales and marketing world that more choices or more products result in more sales. Although the Pharmaceutical industry is different in many ways, a valuable finding from the retail industry, where SKU reduction activities are currently the most mature, can be applied to this case. Research has shown that "brands with higher market shares [and] higher price levels.. .tended to gain share" with a moderate SKU reduction (Zhang, 2007). With high brand loyalty, large market shares, and high price levels, as compared to retail products, Novartis is poised to actually grow unit sales as a result of applying redundant
product rationalization to large and medium sized brands. Communication of the sales and marketing benefits, as well as the operational benefits is essential to gain buy-in from the critical sales and marketing organization. Further, executive support is essential to drive results. When this process was piloted with a CPO in Europe, the direct support of the Region Europe Head, the CPO CEO, and CPO CFO proved invaluable. In fact, a similar process initiated by the CPO supply chain group without the executives' support failed the previous year.
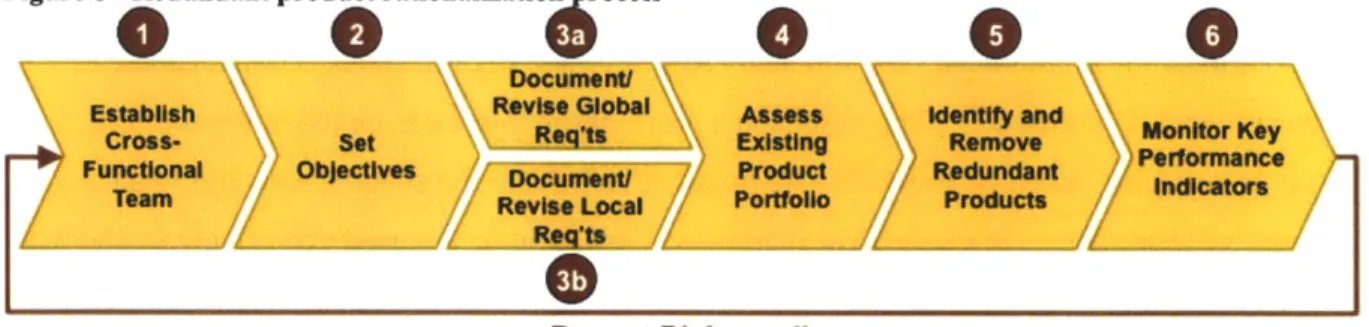
After securing executive and sales and marketing support, the approach highlighted in Figure 8 will facilitate cost savings and increased consolidated margin. Because of new product
Figure 8 - Redundant product rationalizati ocess Documnu\
Establish 5sb~h Rvi acess G ..
Its~a~ MmsM Newry and Monitor Key
cross- set Enassng Remove Monne
Functlonal Objectives Doanan Product Redundant
Team PReOVUa Products
0
Repeat Bi-Annually
introductions and changing customer requirements, redundant product rationalization should be conducted twice a year. For best results, the process should be integrated into the standard sales and operating planning (S&OP) process. This will ease the process governance effort and facilitate efficient key performance indicator measurement and tracking.
First (Step 1), a cross-functional team needs to be created. The team should be composed primarily of CPO representatives but members from the global supply chain, finance, operations, and marketing organizations should be available in a support role. The exact team make up will vary depending on the country, but there are some key pieces that should be present in all countries. First, the team sponsor should be the country CEO, Marketing Head, or CFO, depending on which individual has the most influence over the sales, marketing, and finance organizations. The sponsor should be present for the kickoff of each review cycle to reinforce the objectives and expectations. Second, the team leader should be an influential member of the marketing group. If the process is incorporated into the S&OP activities, then the leader should
already be actively involved in these regular reviews. Team members should include
representatives from marketing, finance, regulatory affairs, supply chain, and quality assurance. Actual time commitments will vary depending on the knowledge areas of each individual, as well as which brands will be the primary focus of the redundant product rationalization. Lastly, to promote process efficiency, every effort should be made to keep many of the same individuals involved in the process for several review cycles.
After the team is established, Step 2 is to set objectives. This step will include informing any new team members of the process. Further, this is where the product scope is determined. Every brand sold in the market does not need to be evaluated every cycle. More focus should be given to brands with high complexity - many dosage forms, dosage strengths, or SKUs.
Additionally, qualitative information should be considered in the scoping process. More details of defining the product scope will be discussed in Section 4.4.2. Finally, the team sponsor and team lead should work together to set targets for the number of SKUs to reduce and the expected
sales per SKU average based on the defined scope. The importance of this step is to remind the team that they are tasked with identifying products that, when removed from the portfolio, will not negatively impact sales. 100% sales substitution remains the goal throughout the process.
Step 3 is the bulk of the marketing work. This is where customer requirements are documented. The best source of this information is the brand managers at the CPO. They will have critical information about changes in health authority policies, treatment instructions, demand shifts, and growth potential of the brands under evaluation. Additionally, the supply chain and finance team members will provide critical information around inventory levels, write-offs, and forecast accuracy. Lastly, the global team members can provide trends and findings from other CPO, and they can provide an update on any relevant corporation-wide initiatives that may impact redundant product rationalization. All of this information should be documented for future reference and updating. Also, it is useful to pass this information on to other CPOs in order to share further SKU reduction opportunities. Novartis agrees that clear documentation is critical and will be considered a best practice going forward.
After all patient, provider, distributer, and health authority requirements are documented from a local and global perspective, it is time to assess the existing product portfolio (Step 4).
This is more of a data management task, but it is a key piece in keeping this process efficient. At Novartis, the CPOs are legally separate entities from the headquarters at Basel, which sometimes hinders data integrity. The CPOs are sometimes on different information technology systems than headquarters, and the type of information available to the CPO is always limited. Most notably, the CPOs have no access to manufacturing cost data or consolidated margin values. Although some data restrictions are required, it has also created an avoidable disconnect between the CPO product portfolio and the global product portfolio. For example, a CPO may have decided to prune an individual SKU from its portfolio, but this decision did not get
communicated to global. From headquarters' perspective, the SKU remains active, despite a lack of recent sales activity. Step 4 is an opportunity to reconcile these two portfolios. As previously mentioned, this is not complexity reduction activity as it merely cleanses data, but it will help make this process more efficient, as well as make product portfolio metrics more
manageable and accurate.
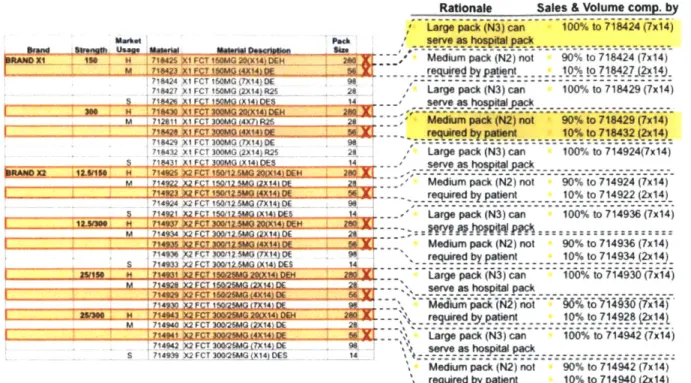
Step 5 is to identify and remove redundant products. To do this, the customer requirements should be matched to individual SKUs in the portfolio. Figure 9 provides an illustrative example of one of Novartis' larger brands in a single European market. After documenting the customer requirements for this brand, it was determined that a sample pack size, a 28-tablet pack, and a 98-tablet pack were required for each dosage strength. Put
differently, the 56-tablet pack size and the hospital bulk pack are not required by the customer. The SKUs highlighted in red denote the SKUs that were removed from the portfolio because they do not meet a specific customer requirement. During this process, it is important to
document the rationale behind removing a particular SKU. In this case, SKUs were removed for one of two reasons: the demand for the hospital pack can be satisfied by the largest commercial pack or the medium packaging quantity is not required. It is also useful to document which SKUs will compensate for the sales and volume of the redundant products after they are
removed. Note that when the medium pack (56-tablets) were removed, the pilot CPO realized a shift of 90% of sales to the larger pack size and 10% of the sales of the 56-tablet pack shifted to the smaller pack size. Similarly, 100% of the sales of the hospital packs were shifted to the 98-tablet pack. To promote
Figure 9 -Illustrative example of identifying redundant products
Rationale Sales & Volume comp. by
11' j La ieakN3can -- 0066%to718424(7 x14)
Mavkst P.wk set" as holpItapack
_ _ _ 9_ __In 710425 Xi FCT 160MG ~ Medium pack (N2) not 90% to 718424 (7x14)
- 7---- -M- V-F-- -required by patient 10% to 718427 (2x14)
718424 X1FCT 60MG (7X14)DE 98
718427 X1 FCT 150MG (2XI4 R2 2 / Largepack(13)can 100%to718429(704)
s serve as ho a
M 712.11 X1 FCT 300MG 7) R26 2u p (N2)ot 90%to718429(7x14)
718429 )1FCT300MG(7X14)DE 98- -- - p - -n - - - t o 7 ZV - - -
-718432 X1I FCT 30MG (2X14)R25 2 Large pack (N3) can 100% to 714924(74)
S 71431 X1FQT300MOK 141OE- seve as hosp3t}x4ack
raiDr I 1 . 7 -2.-- -L4N -
---M 714922 x2FCT150/12G 2x 1410F Medium pack(N2)not 90%to714924(7x14)
714924 MPGT 105MGX0141DE required by patient 10% to 7149 Rx 14)
714924 X2 F CT I6W112.5MG (7X(14) ,- -E - -- - - -- - - -- - --.-
-5 714921 a PCT 1 5, 1Z2dQ LK141 DES 14 1 . Large pack (N3) can 100% to 714936 (7x14) M 714934 X2 FCT 30025MO (r2X141DE 2"
4N-5 Medium pec (N2) not 90% to 714936 (7x14)
714936 X2 FCT 3W012 5MO (7X14) DE 9quired bypatient 10% to 714934 (2x14)
S 714933 X2 F4 G (14) DES
-731 2 FCT 16MG20fXM14DE Large pack (N3) can 100% to 714930 (7x14)
. M 7 U2.ECL15pMG.12K4) --- seve as hospital pack
714930 X2 FCT 150(X aTt 1
2O DN 2 '! Lediue pc (Ncan 100%T2o714942
M 714940 X2 FCT 3025MG (X14) DE 28
M 714932 X2 FCT 300t25MG (7X14) DE 9-a814
71402 X2FCT3OV4G jX 14 DELarge pack (N3) can 100% to 71842 (7x14)
.4sere as hop* ja
Medium pack (N2) not 90% to 714942 (7x14)
requiredbypatient 10% to 714940(2x14)
Large ~ ~ pac-(3)-an -100 7193-(714
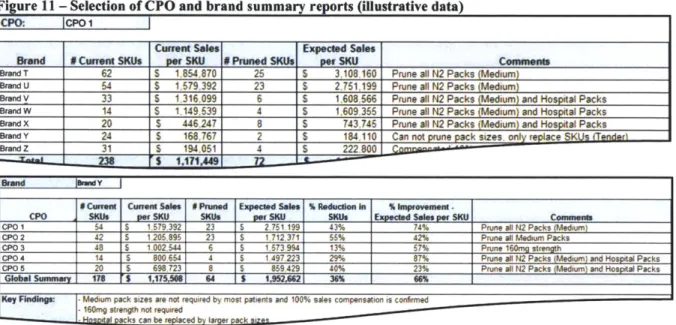
---consistency across all CPOs and to aid the creation of summary reports, all brands should be evaluated using the brand review worksheet; a selection of which is shown in Figure 10. The next part of Step 5 is to create summary reports for the current redundant product rationalization
cycle. Figure 11 depicts selections of summary reports by CPO and by brand. This is a global perspective and is useful to summarize the expected impact of the latest review cycle, as well as
to compare CPOs to each other. Because this process is heavily contingent on the leadership of individuals scattered across the world, it is useful to compare the results on a CPO level. Further, if one CPO observed a change in the customer requirements of a brand, it is likely that other CPOs would be able to use that information as they review the same brand in their market. With all of the information recorded, the redundant products should now be removed from the local and global portfolios, and the benefits of a streamlined product offering will begin to be realized.