Publisher’s version / Version de l'éditeur:
Canadian Journal of Civil Engineering, 33, August 8, pp. 1050-1064, 2006-08-01
READ THESE TERMS AND CONDITIONS CAREFULLY BEFORE USING THIS WEBSITE. https://nrc-publications.canada.ca/eng/copyright
Vous avez des questions? Nous pouvons vous aider. Pour communiquer directement avec un auteur, consultez la
première page de la revue dans laquelle son article a été publié afin de trouver ses coordonnées. Si vous n’arrivez pas à les repérer, communiquez avec nous à PublicationsArchive-ArchivesPublications@nrc-cnrc.gc.ca.
Questions? Contact the NRC Publications Archive team at
PublicationsArchive-ArchivesPublications@nrc-cnrc.gc.ca. If you wish to email the authors directly, please see the first page of the publication for their contact information.
NRC Publications Archive
Archives des publications du CNRC
This publication could be one of several versions: author’s original, accepted manuscript or the publisher’s version. / La version de cette publication peut être l’une des suivantes : la version prépublication de l’auteur, la version acceptée du manuscrit ou la version de l’éditeur.
For the publisher’s version, please access the DOI link below./ Pour consulter la version de l’éditeur, utilisez le lien DOI ci-dessous.
https://doi.org/10.1139/L06-042
Access and use of this website and the material on it are subject to the Terms and Conditions set forth at
Possibilistic approach for consideration of uncertainties to estimate
structural capacity of ageing cast iron water mains
Tesfamariam, S.; Rajani, B. B.; Sadiq, R.
https://publications-cnrc.canada.ca/fra/droits
L’accès à ce site Web et l’utilisation de son contenu sont assujettis aux conditions présentées dans le site LISEZ CES CONDITIONS ATTENTIVEMENT AVANT D’UTILISER CE SITE WEB.
NRC Publications Record / Notice d'Archives des publications de CNRC:
https://nrc-publications.canada.ca/eng/view/object/?id=96cd439b-c792-4e35-bc0b-29ffaabf0ffa https://publications-cnrc.canada.ca/fra/voir/objet/?id=96cd439b-c792-4e35-bc0b-29ffaabf0ffaPossibilistic approach for consideration of
uncertainties to estimate structural capacity of
ageing cast iron water mains
Solomon Tesfamariam, Balvant Rajani, and Rehan Sadiq
Abstract:Drinking water distribution networks form essential components of all urban centres. Water mains buried in the soil–backfill are exposed to different deleterious reactions, with the result being that the design factor of safety may significantly degrade, leading to structural failure. In particular, metallic distribution and trunk mains are subject to cor-rosion. Proactive pipeline management, which entails timely maintenance, repair, and renovation, can increase the ser-vice life of pipes. Several nondestructive evaluation techniques have recently become available to measure the remaining wall thickness of metallic pipes. In this paper, a previously developed analytical model based on Winkler-type pipe–soil interaction (WPSI) is cast in a “possibilistic” framework to translate the remaining pipe wall thickness to current structural factor of safety. The WPSI model takes into consideration external (traffic, frost, etc.) and internal (operating and surge pressures) loads, temperature changes, and loss of bedding support and the reduction of pipe structural capacity in the presence of corrosion pits. Uncertainties associated with the input data–parameters are han-dled using fuzzy arithmetic operations and interpreted through possibility theory. A Monte Carlo type random sampling method is carried out for performing sensitivity analyses to identify the critical data–parameters that merit further in-vestigation.
Key words:water mains, pipe–soil interaction, uncertainty analysis, fuzzy arithmetic, possibility theory.
Résumé :Les réseaux de distribution d’eau sont parmi les composantes essentielles de tout centre urbain. Les condui-tes de distribution enfouies dans le sol/remplissage sont exposées à plusieurs réactions délétères et il peut en découler que le coefficient de sécurité se dégrade de manière importante, engendrant une défaillance structurale. Plus particuliè-rement, les conduites métalliques principales et d’alimentation sont sujettes à la corrosion. La gestion proactive des conduites, qui demande de la maintenance, des réparations et des rénovations en temps opportun, peut accroître la durée de vie des conduites. Plusieurs techniques d’évaluation non destructives pour mesurer l’épaisseur résiduelle des parois des conduites métalliques sont maintenant disponibles. Le présent article met un modèle analytique développé antérieurement et basé sur une interaction conduite-sol de type Winkler (WPSI) dans un cadre « possibiliste » afin de traduire l’épaisseur résiduelle des parois des conduites en un coefficient de sécurité structurale actualisé. Le modèle WPSI tient compte des charges externes (circulation, gel, etc.) et internes (pression de fonctionnement et coups de bé-lier), les changements de température et la perte de support de remplissage ainsi que la réduction de la capacité struc-turale des conduites en présence de piqûres de corrosion. Les incertitudes associées aux données/paramètres d’entrée sont traitées par des opérations arithmétiques floues et interprétées par la théorie des possibilités. Une méthode d’échantillonnage aléatoire de Monte-Carlo est effectuée pour les analyses de sensibilité afin d’identifier les don-nées/paramètres critiques qui méritent une attention plus approfondie.
Mots clés :conduites de distribution, interaction conduite-sol, analyse d’incertitude, arithmétique floue, théorie des pos-sibilités.
[Traduit par la Rédaction] Tesfamariam et al. 1064
Introduction
The ability to reliably deliver safe potable water without major interruptions is paramount. The deterioration of
age-ing water mains is of major concern to water utilities and their customers. The financial costs to repair and replace these water mains are estimated to exceed Can$1 billion an-nually in Canada alone. The implementation of a proactive
Received 2 May 2005. Revision accepted 27 February 2006. Published on the NRC Research Press Web site at http://cjce.nrc.ca on 23 October 2006.
S. Tesfamariam,1B. Rajani, and R. Sadiq.Institute for Research in Construction, National Research Council Canada, Ottawa, ON K1A 0R6, Canada.
Written discussion of this article is welcomed and will be received by the Editor until 31 December 2006.
asset-management strategy is essential to maintain a water distribution network that is both reliable and safe, given the limited availability of financial resources.
Figure 1 shows a risk-based approach to decision making for renewal of deteriorating buried pipes. The risk-based de-cision-making process entails quantifying the initiation of deterioration, condition evaluation, and determination of condition state and failure risk. Pipe inspection typically identifies different distress indicators, i.e., geometry of cor-rosion pits, frequency of pits along pipe length, number of broken wires and their frequency in prestressed concrete cyl-inder pipe (PCCP), etc. One of several approaches to trans-late distress indicators to condition state is to use a mechanistic (physical) model to determine the residual fac-tor(s) of safety.
In the past few years, different nondestructive techniques (NDT) have become available (Jackson et al. 1992; Hartman and Karlson 2002; Lillie et al. 2004; Rajani and Kleiner 2004) to measure remaining wall thickness, corrosion pits (ductile iron), or graphitization depths (cast iron) along pipes. These NDT measurements have to be incorporated within a broad decision support system to assess the pipe condition, determine remaining service life, and make deci-sions whether to renew–replace the pipe and when to do it. In most cases, a combination of circumstances leads to the pipe failure. It is very difficult to ascertain the precise cause of failure because all the operational factors, design parame-ters, or data that define a problem are known imprecisely and (or) recorded inaccurately, e.g., external (traffic, frost, etc.) and internal (operating and surge pressures) loads, tem-perature changes, loss of bedding support, pipe condition, and corrosion pit geometry. Any attempt to establish or esti-mate the condition of the pipe has a degree of uncertainty, given that many of the factors that contribute to pipe failure have significant uncertainties, either because of the large spatial variability (e.g., soils) or because of inherent variabil-ity (e.g., pipe material properties). Uncertainties in the deter-mination of the remaining service life are further exacerbated by the difficulties associated with obtaining rea-sonable estimates of past, present, and future corrosion rates. Rajani et al. (1996) and Rajani and Tesfamariam (2004) have developed Winkler-type pipe–soil interaction (WPSI) models (based on mechanics and hence termed mechanistic or physical models) that account for most of the predomi-nant factors or data–parameters identified earlier. The WPSI may also involve model-associated uncertainties, which oc-cur as a result of model formulation and model parameters– coefficients.
Most existing mechanistic models for pipe–soil interaction coupled with material failure theories are deterministic and provide point estimates for the factor of safety (FS). Deter-ministic models do not consider the uncertainties involved in the data and parameters and therefore may result in false pre-cision. A possible approach to overcome this limitation is to estimate “probability” or “possibility” of pipe failure by using various methods such as Monte Carlo simulations, analytical methods (e.g., first- and second-order reliability methods), probability-bound analysis (p-boxes), random set theory, and possibilistic analysis using fuzzy arithmetic (Joslyn and Booker 2004).
This paper builds on our previous work (Rajani et al. 1996; Rajani and Tesfamariam 2004) in which WPSI models were developed to determine stresses, strains, and displace-ments at any point along the length of a jointed pipe. In this paper these models are recast in “fuzzy” terms using a possibilistic approach to describe uncertainties in operational factors and input data as discussed earlier. In the following sections, material failure theories specific to cast iron mains are described and combined with fuzzy stress solutions to determine the fuzzy structural capacity in terms of factor(s) of safety (FS). It should also be noted that the discussion in this paper is limited to the translation of distress indicators in the form of corrosion pits to a condition rating expressed in term of factors of safety (box denoted by the broken line in Fig. 1). Although the focus in this paper is on cast iron mains, the proposed approach should be equally applicable to other pipe materials. Sensitivity analyses (through Monte Carlo type random sampling techniques) using rank-correlation coefficients are conducted to identify and evalu-ate the contributions of critical factors, parameters, and data that dictate the factor(s) of safety.
Pipe–soil interaction models
As noted previously, Rajani and Tesfamariam (2004) re-cently developed an approach, based on the Winkler-type pipe–soil interaction model, that accounts for the unsup-ported length (likely to develop as a result of prolonged leakage or washout) and soil elastoplasticity. Further, the ax-ial, flexural, and circumferential stress components were consolidated with the previously reported responses (Ugural and Fenster 1987; Rajani et al. 1996) to provide an overall picture of the response of buried water mains under the in-fluence of earth, frost, and live loads, water pressure, tem-perature differential, unsupported length, and pipe–soil interaction. It must be noted that these responses consider the loss of support in the longitudinal direction only, and not in the in-plane direction.
Only succinct details of the WPSI models developed by Rajani et al. (1996) and later by Rajani and Tesfamariam (2004) are given here to explain the extension of the model to include failure analysis of cast iron mains. In general, the stress components due to external loadsσxw, internal pressure σxpi, temperature differentialσxT, and longitudinal bendingσxf that contribute to the total axial stress (σxa)are
[1] σxa =σxw+σxpi +σxT+σfx
Similarly, the total hoop stress (σθTotal) has contributions from external loads (σθw), internal pressure (σ )
θpi ,
tempera-ture differential (σθT), and longitudinal bending (σ)
θ f :
[2] σθTotal =σθw+σθpi +σθT +σfθ =σθw+σθpi +σθT−ν σp xf whereνp is the Poisson’s ratio. The thermal axial (σxT)and thermal hoop (σθT) stresses in eqs. [1] and [2] are a conse-quence of temperature differential (∆T between the inside) of the pipe and the surrounding soil. Each of the stress com-ponents in eqs. [1] and [2] can be estimated using the solu-tions provided in the references cited earlier.
Failure theories
In-service water mains or pipes are subjected to continu-ous deletericontinu-ous reactions and internal and external loads that undermine the intended design factor of safety (FS). Conse-quently, the service life is significantly reduced if existing stresses on structurally deteriorated pipe exceed the expected or admissible design loads or stresses. Pipe failure is defined as an event in which the factor of safety (FS) falls below a critical value, FScr (usually set to 1), i.e., FS < FScr. Cast iron, a brittle material, typically fails through facture at strains of 0.5%, rather than through yielding. Thus, the fail-ure of brittle materials such as cast iron is dictated by its ul-timate strength. In contrast, yield strength is used to describe failure of ductile materials like that in ductile iron mains. Two specific failure criteria (theories) applicable to cast iron, namely, in-plane (ip) and biaxial distortion energy (de), are discussed in the following. The omission of subscripts “ip” and “de” in reference to FS means that either or both criteria are applicable. The “ip” criterion, as the name implies, en-visages in-plane failure modes, and the “de” criterion ex-plains longitudinal and (or) flexural action failure modes. In most circumstances the failure criterion that leads to an FS that is below FScr dictates the failure mode.
In-plane failure criterion for cast iron
Several theories (e.g., Ugural and Fenster 1987) explain the failure of cast iron materials, but the most common fail-ure theory used for the design of cast iron mains (AWWA 1977) is based on interaction curves developed by Schlick (1940). The AWWA (1977) design guidelines C101-67 treat a cast iron pipe as a rigid structural ring element; as a result,
loads are supported by resistance in the in-plane direction and not in longitudinal bending, since a well-constructed new pipe is not expected to undergo differential lateral movement–displacement (along the length of the pipe). Ex-perimental work carried out by Schlick (1940) showed that the failure of a grey cast iron pipe is governed by parabolic interaction curves (Fig. 2) expressed in terms of normalized internal pressure, pi/P, and normalized external bearing load,
w/W:
[3] ( / )w W 2+p Pi/ ≤1
where pi is the internal pressure; w is the external bearing
load; W = π σt2 r/ (3D+T)is the three-edge crushing (ring) load necessary to cause failure in the absence of internal pressure, where σr is the rupture modulus, D is the pipe di-ameter, and t is the pipe wall thickness; and P = 2σbut D/ is
the internal bursting pressure necessary to cause failure in the absence of external load, where σbu is the burst tensile
strength. The external load, w, in the AWWA (1977) design guidelines C101-67 considers traffic and overburden loads; however, additional frost loads induced during cold seasons in frost-susceptible soils or backfills are not explicitly con-sidered. Rajani and Makar (2000) suggested that the frost load could be estimated as a percentage, ranging from 0% to 100%, of the earth load in accordance with the frost load theory developed by Rajani and Zhan (1996).
AWWA (1977) advocates the application of a factor of safety of 2.5 to internal pressure (pi) and external loads (w) for the design of cast iron pipes. Now one would use a “load factor,” since the design is based on limit states. Melchers (1987) noted that it makes little difference which term is used in the design procedure as suggested by AWWA Fig. 1.Schematic diagram for water mains from installation to renewal–replacement. The discussion in this paper is limited to those aspects within the box formed by the broken line.
(1977), since the same (proportional) factor of safety of 2.5 is advocated for both internal pressure (pi) and external loads (w). An additional pipe wall thickness of 2.03 mm (0.08 in.) is suggested for corrosion (graphitization) allow-ance, which should increase the FS of new pipes to values beyond that suggested for structural resistance only (Moore 1939). Nevertheless, as corrosion or graphitization pits initi-ate randomly and subsequently grow over time, the struc-tural FS of a pipe diminishes (Rajani and Makar 2000; Rajani and Tesfamariam 2004) until failure occurs (FS < 1), even though external and internal loads may not have changed substantially.
The in-plane failure criterion (eq. [3]) can be rewritten in terms of the in-plane factor of safety, FSip, as follows: [4] FS2ip( / )w W′ 2+FSip(p Pi′/ )=1
where w′ and p′ are working loads and pressures, respec-i
tively. AWWA (1977) also specifically indicates that two load cases should be examined for design. Load case 1 re-fers to the consideration of normal operating pressures, earth and traffic loads, and load case 2 refers to the consideration of normal operating pressures, transient pressure and earth loads, which recognizes the low probability of concurrence of transient pressures and traffic loads. Although working loads and working pressures w′ (and p′ ) may not vary withi
time, its resistance strength (as determined byσr andσbu) is undermined as a result of corrosion-induced deterioration. Failure is imminent when FSip < 1. As illustrated in Fig. 2, longitudinal split failures are likely when normalized pres-sures (p′ /P) dominate, and crushing failures are likely wheni normalized external loads (w′/W) dominate. A combined fail-ure mode is likely to occur, however, when the normalized external loads and pressures are in mid-range, arbitrarily set at, for example, 0.4 < p′ /P < 0.8 and 0.4 < w′/W < 0.8.i
Biaxial distortion energy failure criterion for cast iron
The development of cast iron fracture criteria under bi-axial (hoop and bi-axial) stresses dates back to the 1950s
(Cof-fin 1950; Fisher 1952; Mair 1968). These researchers inves-tigated the response of cast iron in the presence of graphite flakes. Typically, the ferrite–graphite matrix transmits the load when the cast iron is in compression; however, the graphite flakes act as stress raisers when subjected to ten-sion. Consequently, the ultimate tensile strength of a cast iron pipe is substantially lower than its ultimate compressive strength. Mair (1968), based on his experimental work and that of Coffin (1950) and Fisher (1952), arrived at the con-clusion that the cast iron failure criterion is best represented by the distortion energy theory developed by von Mises. This theory states that failure by yielding or fracture occurs when the distortion energy per unit volume in a state of combined stress at any point in the body becomes equal to that associated with yielding or fracture in a simple tension test (Ugural and Fenster 1987). The biaxial failure criterion based on distortion energy theory is
[5] σ12 −σ σ1 2+σ22 =σu2
whereσ1 and σ2 are biaxial stresses, and σu is the ultimate
tensile strength. The distortion energy failure criterion for biaxial stresses (eq. [5]) can be rewritten for cast iron mate-rial in terms of the distortion energy factor of safety, FSde, and stress concentration factor, K, as follows:
[6] Kσi =σu/FSde for σ1 >0and σ2 >0 (K = 3, tension–tension) (Kσ1)2−Kσ σ1 2+σ22 =(σu/FSde)2 for σ1 >0 and σ2 <0 (K = 3, tension–compression) (Kσ1)2 Kσ σ σ (σ / ) 1 2 22 2 − + = u FSde for σ1 <0 and σ2 <0 (K = 1, compression–compression)
The stress concentration factor, K, discussed here should not be confused with that typically used to calculate stresses in the presence of defects with specific geometry, although it has the same connotation because the stress concentration factor discussed here represents an aggregate reduction in tensile strength in the presence of carbon flakes that act as stress raisers.
Figure 3 illustrates the interaction diagram for axial and hoop stresses that correspond to a specific pipe design as ex-pressed by eq. [6] for cast iron with an ultimate strength of σu = 206 MPa. The outer and inner strength envelopes in
Fig. 3 represent stress conditions for factors of safety (FSde) of 1.00 and 2.50, respectively. An increase in deterioration diminishes the failure envelope shown in Fig. 3, and the de-terioration may compound with the increase in biaxial stresses. Consequently, failure is imminent when FSde < 1. The longitudinal, combined, and circumferential failure modes are depicted in Fig. 3. As indicated earlier, AWWA (1977) did not consider longitudinal action, and therefore the selection of load cases does not arise for design on this ba-sis. Therefore, it is deemed appropriate to use the same two load cases adopted for longitudinal analyses and use distor-tion energy failure criterion, as is customary for in-plane analyses.
Fig. 2.In-plane failure criterion interaction diagram for cast iron water mains (modified after Watkin and Anderson 2000).
Residual ultimate strength
The ultimate strength referred to in eq. [3] (by way of def-inition of P) and eq. [5] is pertinent to cast iron that has no defects or corrosion (or graphitization) pits, i.e., intrinsic material property. The corrosion pits diminish the intrinsic material strength of cast iron to the so-called residual ulti-mate strength (σur) in accordance with fracture mechanics theory (Rajani et al. 2000) as follows:
[7] σ α β ur ur q = K d t an s ( / )
whereαur and s are constants; Kqis the provisional fracture toughness; d is the corrosion pit depth; an= L1dis the lateral
dimension of a pit (in the absence of data, the multiplier L1 is assumed to have a value in the range of 1–5); and β =
a1(d/t)b1is a geometric factor, where a
1and b1are constants.
Rajani et al. (2000) established fracture toughness and other related parameters (Kq, d, a1, b1) based on limited experi-mental tests conducted on cast iron specimens taken from cast iron pipe samples. Others (ASME 1991) have developed similar relationships for materials such as steel. It must be emphasized that the application of residual strength is most suitable (Rajani and Makar 2000) when stresses are calcu-lated nominally, without the presence of corrosion pits, rather than rigorously, with the presence of corrosion pits.
Uncertainty analyses
Models often involve input data or parameters with uncer-tainties, which are commonly represented by random vari-ables with known or assumed probability distributions (Ross 2004) or ranges (interval) of values based on experience and engineering judgment. In addition to many other taxonomies of uncertainty, uncertainties can be broadly grouped under two major classes. The first class of uncertainty is model-associated, which includes the model formulation itself and
coefficients–parameters involved in the model. This uncer-tainty is the result of the abstraction (oversimplification) of natural processes. The second class of uncertainty is associ-ated with the state of input data, which itself can be classi-fied into two main types. Type I (variability, aleatory) uncertainty arises as a result of natural heterogeneity or stochasticity which cannot be reduced. Type II (epistemic) uncertainty is due to partial ignorance that results from mea-surement and systematic errors or subjective uncertainty. It is postulated in this paper that epistemic uncertainty (incom-plete knowledge and (or) lack of data) dominates the deci-sion analysis of the problem at hand. Contrary to aleatory uncertainty, the epistemic uncertainty can be reduced by col-lecting more information and data. It plays an important role when the evidence base is small, i.e., sparse data situation. High consequences associated with failures of major water supply lines make it vital to analyze these uncertainties (Ferson and Ginzburg 1996; Ferson et al. 2004).
Different uncertainty analysis techniques have been used to study the reliability of cast iron pipes. Ahammed and Melchers (1994) used the first-order reliability method (FORM) to incorporate uncertainties in the input parameters. Sadiq et al. (2004) used Monte Carlo (MC) simulations based on Latin hypercube sampling to develop a hazard function of time to failure of cast iron pipes. Both MC simu-lations and FORM methods are parametric techniques, which assume that the model inputs are random variables that can be represented by probability density functions. Such probability distributions can best be derived from sta-tistical data that adequately represent the populations of in-terest. Unfortunately, such statistical samples are not always available for most buried pipe infrastructure.
In this paper, fuzzy set theory is used to represent uncer-tainties in input parameters. This theory is able to deal effec-tively with epistemic uncertainties (including subjective judgment) and allows approximate reasoning. It also has an intrinsic ability to propagate uncertainties through various stages that constitute a model (Zadeh 1965). Fuzzy-based techniques are a generalized form of interval analysis used to address uncertain and (or) imprecise information. Fuzzy sets qualify as fuzzy numbers if they are normal, convex, and bounded (Klir and Yuan 1995). The use of fuzzy-based techniques obviates the requirement to make assumptions about the type of probability distribution, as required in MC simulations or FORM. In cases where some input data or pa-rameters are supported by statistical evidence to establish probability density functions, these functions can be com-bined with fuzzy numbers to form a hybrid approach (Guyonnet et al. 2003).
A fuzzy set theory is an extension of the classical set the-ory (in which x is either a member of set Aior not) in that x can be a member of set Ai with a membershipµx. A fuzzy number describes the relationship between an uncertain quantity x and a membership functionµx, which ranges be-tween 0 and 1. Triangular fuzzy numbers (TFNs) are used here for simplicity, although any normal and convex shape is possible. The selected shape should be justified by available information (Guyonnet et al. 1999).
Another important concept related to fuzzy sets requires the introduction of theα-cut level, denoted as Aiα. The Aiα, a subset of Ai, represents a cut on a fuzzy set Ai and consists Fig. 3.Failure envelopes for cast iron in accordance with biaxial
of an interval for which membershipµAi(U)≥ α, where U is
the universe of discourse. Figure 4 illustrates theα-cut con-cept applied to the factor of safety. At α = 0.4, the subset FS0.4 represents the FS interval of [0.18, 1.65]. The α-cut can be used to form a fuzzy confidence band, which can be viewed as a possibilistic confidence interval analogous to the probabilistic confidence interval. The α-cut concept is used later to perform sensitivity analyses.
Possibility theory
A possibility distribution represents a state of knowledge about an issue, distinguishes between what is “plausible” and what is less plausible and between what is “surprising” and what is “expected” (Dubois and Prade 1988). Earlier, the idea of “possibility” was supported by the famous economist Shackle (1961), who stated “… a man cannot, in general, tell what will happen, but his conception of nature of things, the nature of the men and their institutions and affairs, and of the non-human would enable him to form a judgment as to whether any suggested thing can happen.” Zadeh (1978) later formulated the contemporary possibility theory as an extension of fuzzy set theory, in which a possibility distribu-tion is numerically equal to the membership funcdistribu-tion. In this paper, uncertainty analysis using fuzzy arithmetic is per-formed by TFNs of input parameters. The computed value of factor of safety is also a TFN, which can be interpreted as a possibility distribution.
Epistemic uncertainty in possibility theory is described using “dual measures” of possibility denoted by Π and ne-cessity denoted by Ν (Dubois and Prade 1988). The dual measures of possibility theory can be interpreted as the Dempster–Shafer plausibility and belief, respectively (Alim 1988). In a possibilistic framework, the “possibility of fail-ure” is defined in terms of the fuzzy factor of safety by the hypothesis, FS≤ FScr. It has been shown (Joslyn and Booker 2004) that the cumulative distribution function is bounded by a possibility distribution, i.e., “true probability” measure of failure lies between necessity Ν and possibility Π mea-sures.
The possibility and necessity measures in terms of FS can be defined by the following relationships (Dubois and Prade 1988): [8] Π(FS FScr) Supu min [ FS( ), FS ( )] cr ≤ = µ u µ u [9] Ν(FS FScr) Infu max[ FS( ), FS ( )] cr ≤ = 1−µ u µ u
whereΠ (FS ≤ FScr) is read as the possibility that FS≤ FScr;
µFS( )u is the membership function of FS for any value u;
µFScr( )u is the membership function of FScr for any value u;
Supu is Supremum, the largest value over the universe of
discourse of u; min is the minimization operator; Infu is infimum, the smallest value over the universe of discourse of
u; and max is the maximization operator. How the dual mea-sures of necessity Ν and possibility Π can be interpreted in the present context is discussed later in the section titled Sensitivity analyses.
Deriving possibility (risk) of failure to make
decision
In possibilistic analysis, epistemic uncertainty manifests itself as an interval of dual measures [Ν, Π], which repre-sents ignorance or lack of knowledge. Therefore, the larger the interval, the bigger the epistemic uncertainty, and vice versa. This raises the issue of what value of possibility of failure should be appropriate to make a decision or manage risk. There are three common approaches for decision-making under ignorance, which can be related to the attitude of a decision-maker. The first approach accounts for a pessi-mistic attitude, where Π is selected as a representative value for the possibility of failure. The second approach accounts for an optimistic attitude, where Ν is selected as a represen-tative value for the possibility of failure. The third approach is normative or taking a compromising attitude, which uses the Laplace principle of insufficient reason and takes the arithmetic average of Π and Ν to derive the possibility of failure. These three attitudes have one-to-one correspon-dence to plausibility, belief, and pignistic probability within the Dempster–Shafer framework (Smets 2000). These three attitudes are special cases of Hurwicz decision strategy, which defines a level of optimism or degree of orness, λd∈ [0, 1] using the following function:
[10] possibility or risk of failure (FS ≤ FScr)
= λdΝ +(l−λd)Π
This function reduces toΠ when λd = 0 (the lowest
possi-ble optimism); to N, i.e., optimistic attitude, when λd = 1 (the highest possible optimism); and to an arithmetic average of Π and Ν when λd = 0.5 (the compromising optimism).
Therefore, the Hurwicz decision strategy can help derive the possibility (risk) of failure at any desired level of optimism using an interval ofλd ∈ [0, 1]. The concept of Hurwicz
de-cision strategy can be further generalized using ordered weighted average (OWA) operators. The OWA operators are beyond the scope of this paper, and interested readers are re-ferred to Yager (1988) for details.
The interpretation of Π and Ν using eqs. [8] and [9], re-spectively, is illustrated in the figures with Table 1, which show five scenarios where factors of safety decrease with an increase in deterioration. Scenario 1 shows that the possibil-ity distribution (TFN) of FS is greater than FScr = 1. Thus, both possibility and necessity measures are equal to 0. Thus, scenario 1 can be read as “it is true that the evidence has no
supportfor the hypothesis that pipe will fail” and “it is true
that the evidence has support for the hypothesis that pipe will not fail.” These two statements are complementary in probabilistic framework but they are not in the possibilistic framework due to the existence of ignorance or epistemic uncertainty.
With increasing deterioration, the lower vertex of the FS intercepts with FScr= 1. Hence, 0 <Π < 1 and Ν = 0 can be
related to the physical condition of the pipe that “it is true that the evidence has partial support for the hypothesis that pipe will fail.” Similar interpretations can be extended to scenarios 3 and 4. Scenario 5, an extreme case, illustrates that “it is true that the evidence has support for the hypothe-sis that pipe will fail” and “it is true that the evidence has no
supportfor the hypothesis that pipe will not fail.”
Integration of uncertainty analysis with
pipe–soil interaction models and failure
theories
The data–parameters required for the pipe–soil interaction models discussed in an earlier section can be grouped into three broad categories: pipe properties (geometry and mate-rial); soil properties (unit weight, Poisson’s ratio, internal friction, etc.) and trench characteristics (trench depth, trench width); and traffic type and operational conditions (internal pressure, transient pressure, temperature variation, unsup-ported length, etc.). The uncertainties in the data–parameters that define a typical buried 150 mm diameter (6 in.) cast iron main are shown in Table 2 in terms of TFNs (minimum, most likely, maximum). The uncertainties (vagueness) ex-pressed for the data–parameters are based on the authors’ best judgment and experience. Crisp (deterministic) values are assigned to properties known with near certainty.
Evidence that pipe will fail Evidence that pipe will not fail
Scenario Π Ν No support Support No support Support
1 0 0 True True
2 <1 0 Partially true Partially true True
3 1 0 True True
4 1 <1 True Partially true Partially true
5 1 1 True True
Note:For example, scenario 1 can be read as “it is true that the evidence has no support for the hypothesis that pipe will fail” and “it is true that the evidence has support for the hypothesis that pipe will not fail.”
Table 1.Interpretation of dual measures in possibility theory as deterioration increases and the hypoth-esis FS≤ FScr.
The solutions for each of the stress components in eqs. [1] and [2] and the failure theories criteria (eqs. [4] and [6]) were rewritten in terms of fuzzy numbers to obtain fuzzy factors of safety. As noted previously, fuzzy factors of safety reflect the uncertainties present in the input data–parameters. Commonly used fuzzy arithmetic operations are shown in Table 3. Fuzzy arithmetic operations require extreme care, and specific rules and applicable procedures (Klir and Yuan 1995; Cooper et al. 2000) must be followed to ensure reli-able outcomes, e.g., simplification of equations prior to es-tablishing their fuzzy form.
In general, the proposed method can be used for design and (or) condition assessment of buried pipes. Condition as-sessment is usually exercised for ageing mains after
inspec-tion to determine their current factor of safety. Sensitivity analysis is pursued to identify the influence of different in-put data–parameters in the safety of a structure. In this pa-per, only sensitivity analysis and condition assessment are addressed, primarily because they illustrate the versatility of fuzzy sets to assess uncertainties and how pipe condition can be assessed in practical circumstances.
Sensitivity analyses
This paper describes two types of sensitivity analyses. The first considers (Fig. 5) four distinct scenarios (As, Bs, Cs, and
Ds) of how the calculated fuzzy factors of safety (FSde) de-crease with the inde-crease in unsupported bedding length and corrosion pit depth. Each scenario in Fig. 5 has a TFN (shaded area) representing the membership to (minimum, most likely, maximum) fuzzy factors of safety. The long tail (positively skewed) in the TFN of the factor of safety sce-nario As, with no loss of wall thickness (no corrosion) and no loss of bedding support, diminishes towards scenarios Bs,
Cs, and Dswith reduced wall thickness and increased unsup-ported length. In accordance with the central limit theorem (Melchers 1987), the product of a large number of random variables approaches a logarithm-normal distribution, irre-spective of the individual distributions of the random vari-ables. The observed TFNs demonstrate an analogous behaviour in the possibilistic analysis described here. The long tail in the membership for fuzzy factor of safety (of scenario As) indicates that in a new pipe most input–
Min. Most likely Max.
Pipe
Nominal diameter, D (mm) 150
Wall thickness, t (mm) 13.12
Pipe length, 2L (m) 6.0
Elastic modulus, Ep(MPa) 196 000 206 000 216 000
Tensile strength,σu(MPa) 132 207 282
Ring modulus of rupture, σr (MPa) 235 310 385
Bursting tensile strength,σbu(MPa) 94.8 145.0 195.0
Poisson’s ratio,νp 0.24 0.26 0.28
Fracture toughness, Kq(MPa·m1/2) 7 10 13
Thermal coefficient,αt(×10–6/°C) 10.5
Soil
Elastic modulus, Es(MPa) 90 100 110
Poisson’s ratio,νs 0.25 0.30 0.35
Soil unit weight,γs(N/m3) 22 488 22 988 23 488
Trench characteristics and operational conditions
Trench depth, H (m) 1.47 1.52 1.57
Trench width, Bd(m) 0.71 0.81 0.91
Unsupported length, b (mm) 0 203 406
Earth load and traffic load, q (N/mm) 25.3 34.3 45.8
Water pressure, pi(kPa) 172 345 689
Transient water pressure, pt(kPa) 621 827 1034
Remaining wall thickness, tmin tmin– 10% tmin tmin+ 10%
Temperature difference,∆T (°C) 0 –14 –28
Table 2.Input parameters for pipe, soil, and operational conditions for 150 mm diameter cast iron mains.
Operator Formula Result
Summation A+ B [a1+ b1, a2+ b2, a3+ b3] Subtraction A– B [a1– b3, a2– b2, a3– b1] Multiplication A× B [a1× b1, a2× b2, a3× b3] Division A/B [a1/b3, a2/b2, a3/b1] Scalar product Q·B [Q·b1, Q·b2, Q·b3] Exponent Bn [b 1n, b2n, b3n]
Note:The values of A and B are positive and, if negative numbers are used, the corresponding minimum and maximum values have to be se-lected. A = [a1, a2, a3]; B = [b1, b2, b3]; a1< a2< a3; b1< b2< b3; aiand
bi(i = 1 to 3)> 0; n > 0; Q > 0.
Table 3.Common fuzzy arithmetic operations using two triangu-lar fuzzy numbers.
parameters play a significant role in the determination of the safety of the pipe at the design stage. As the pipe deterio-rates, however, corrosion plays a dominant role as indicated by the short tails of the TFNs representing FS in scenarios Csand Ds. The fuzzy factor of safety decreases noticeably as the remaining wall thickness decreases. The situation (sce-nario Cs, with remaining wall thickness equal to 50% of original thickness) is exacerbated when the water mains ex-perience loss of bedding support (scenario Ds, with unsup-ported length of 0.5 m), which would likely happen if the pipe developed an undetected leak.
Figure 5 also provides the possibility,Π, and necessity, Ν, measures for the possibility of failure. Scenario As indicates
a very low possibility of failure. Scenario Bsindicates that, although failure is entirely possible, it is only 16% sure. Scenarios Csand Dsindicate 51% and 100% surety of fail-ure, respectively.
The second type of sensitivity analysis is not restricted to assessing the influence of two specific variables but is broad in the sense that it assesses the outcome of variations in any of the input data–parameters (Cullen and Frey 1999). This type of analysis also serves to identify the important parame-ters to prioritize additional data-collection efforts. It can also highlight parameters that can be de-emphasized or perhaps eliminated altogether without having a major impact on re-sponses predicted by the model.
Several methods are available (Cullen and Frey 1999) to conduct a sensitivity analysis, each with advantages and dis-advantages. A sensitivity analysis is commonly carried out using random sampling (Monte Carlo type simulations) where the probability distributions for input data can be ei-ther assumed or derived from observations. Thereafter, the rank correlation method (Cullen and Frey 1999) is applied to the results of the Monte Carlo simulations to identify input data–parameters that dominate the output. The rank correla-tion method involves the determinacorrela-tion of correlacorrela-tion
coeffi-cients, which measures the strength of the linear relationship between two variables. In statistics, procedures can be either parametric, which invariably requires that variables have normal distributions, or nonparametric, where assumptions about the distributions of variables are not essential. The Pearson product moment correlation (parametric) coefficient quantifies the relationship between the variables in the raw or transformed metric, i.e., it measures the extent of linearity of a relationship between two random variables. The non-parametric correlation (Spearman rank correlation coeffi-cient,ρs) measures the strength of the relationship between the ranks of the data, i.e., it measures the extent of mono-tonicity of a relationship between two random variables. The Spearman rank correlation coefficient is used in the sensitiv-ity analysis here because the input data–variables may be normally distributed; this condition cannot always be guar-anteed for output (factor of safety). The Spearman rank cor-relation coefficient ( )ρs between two sets of variables is
obtained from the summation of the difference of ranks (dr) squared, i.e.,ρs = 1 – 6 Σ d R Rr2/ ( − , where R is the number1)
of ranked values of iterations–realizations.
The sensitivity analyses based on the rank correlation method were applied in the context of fuzzy input data gen-erated randomly (1000 iterations) using theα-cut concept of fuzzy sets. The procedure for the sensitivity analysis is sche-matically depicted in Fig. 6, and the general pseudo-code procedure is explained as follows:
FOR j = 1 to R, where R is the number of iterations in the sensitivity analysis
FOR each input, i to S, where S is the number of input data–parameters, Monte Carlo type random sampling, αi,j level (uniformly distributed), compute xi,j atµ =αi j, , where xi,j is the input data–parameter
NEXT i
IF failure criterion = “in-plane failure” THEN FSip = f(xi,j, …, xS,j)
IF failure criterion = “distortion failure” THEN FSde = f(xi,j, …, xS,j)
NEXT j
Rank FS after R iterations (FS(1) … FS(j) … FS(R)), determine the Spearman rank correlation,ρ1 …ρs,
normalize and plot theρ1 …ρs on a tornado graph
Sensitivity analyses were conducted for two cast iron pipe sizes, namely 150 mm (6 in.) and 500 mm (20 in.) buried at a depth of 1.52 m (60 in.). Each pipe had two different
re-maining wall thicknesses (tmin) of 75%t and 50%t and un-supported lengths (b). The unun-supported lengths were as-sumed to be proportional to the pipe diameter (D) and to increase as the remaining pipe wall thickness decreases, i.e., for small-diameter (150 mm) mains, unsupported lengths of 1D and 4D with remaining pipe wall thicknesses of 75%t and 50%t, respectively; and for large-diameter (500 mm) mains, unsupported lengths of 1D and 3D with remaining pipe wall thicknesses of 75%t and 50%t, respectively. Pipe sizes were selected to investigate the influence of input data–parameters on the behaviour of the small- and large-diameter pipes. Results of the sensitivity analysis are plotted in a tornado graph. The tornado graphs facilitate visualiza-tion of the positive or negative influences (percent contribu-Fig. 6.Schematic diagram for Monte Carlo type possibilistic sensitivity analysis procedure. In the tornado graph, the percent contribu-tion sum up to 1, the negative sign is shown to represent negatively correlated data.
tion) on the factor of safety, as a consequence of the variation (increase only) in one specific input data– parameter. Sensitivity of each specific input data–parameter is shown in the form of tornado graphs in Fig. 7 (in-plane
energy failure criteria) and Fig. 8 (distortional energy failure criteria) for both sizes and with remaining wall thicknesses of 75%t and 50%t. As expected, Figs. 7 and 8 show that the factor of safety increases as the input data–parameters (e.g., Fig. 7.Sensitivity of factor of safety input variables for 150 and 500 mm diameter cast iron mains in accordance with the in-plane failure criterion.
Fig. 8.Sensitivity of factor of safety input variables for 150 and 500 mm diameter cast iron mains in accordance with the distortion energy failure criterion.
remaining pipe wall thickness (tmin), fracture toughness) that contribute to the increase in pipe structural resistance, and this occurs independent of the failure criterion. On the other hand, the factor of safety decreases as stress drivers (e.g., differential temperature, traffic load, frost load, and internal pressure) increase. Figures 7 and 8 show that external loads (q) have a greater significance in terms of reduction in factor of safety on large-diameter mains than on small-diameter mains. It is also evident (Fig. 8) that an increase in unsup-ported length (b) leads to a reduction in the factor of safety
that is much more significant on small-diameter mains than on large-diameter mains. The influence of external loads (q) and unsupported length (b) heightens as the remaining wall thickness decreases. The sensitivity analyses also show that some variables, e.g., soil modulus of elasticity (Es), internal pressure (pi), and transient pressure (pt), have a very low to
an insignificant influence on the factor of safety. This out-come indicates that the uncertainties present in these vari-ables have little or no practical influence on the structural safety of buried pipes these sizes and buried at these depths. Fig. 9.Profiles of structural capacity for 150 mm cast iron mains installed in 1930 in Calgary, Alta.
It can also be argued that the analyses would not be unduly inaccurate if these variables were represented as constants “crisp” rather than as fuzzy numbers.
Case study
The City of Calgary has selectively inspected (Brander 2001; Brander and Ng 2002) its cast iron mains within the water-distribution network using a commercially available nondestructive technology (NDT) based on remote field eddy current (RFEC). This effort was largely driven by the need to implement a proactive management system to optimize repair and replacement. The specific RFEC technology (Brander and Ng 2002; Hartman and Karlson 2002) used by the city esti-mated the three most significant remaining wall thicknesses (pit depths) and the associated level of confidence in the esti-mates expressed in terms of signal quality indices (SQI) that range from 1 (excellent), to 2 (normal–average), to 3 (low). The confidence level in the estimate for remaining wall thick-ness varies because the technology relies on the interpretation of signature patterns (output) of a magnetic response rather than measurement of a specific physical feature such as pit depth and pit geometry. The uncertainty in the measurements is taken into account by using the SQI indices to fuzzify the measured remaining wall thicknesses.
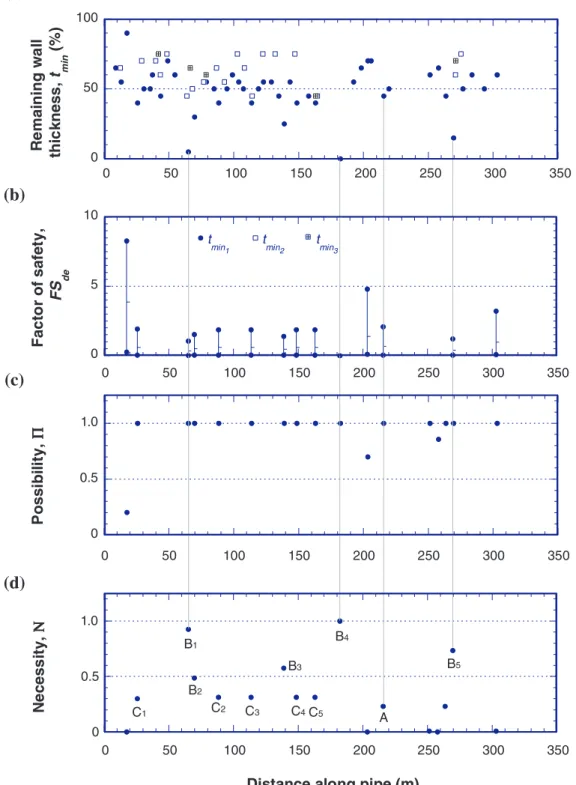
The possibilistic analysis was applied to a specific 150 mm (6 in.) diameter × 13 mm (0.51 in.) wall thickness cast iron pipe of length 309 m (1014 ft.), installed in 1930, to illustrate how its condition could be assessed. Figure 9a shows the pro-file of the remaining pipe wall thicknesses of the three most significant pits (also referred to as graphitization in cast iron) along the pipe length as estimated by the NDT inspection technology. The possibilistic pipe–soil interaction model was applied using input data–parameters (Table 2) to each of the pits identified. Figure 9b shows the profile of fuzzy factors of safety based on the distortion energy failure criterion (FSde) along the pipe length. The FSde (based on biaxial stresses) is used because the sensitivity analyses showed that unsupported length and temperature differential are the most important considerations for small-diameter pipes. The pits are assumed to have the same diameter as their depth, since the NDT used does not estimate the aerial extent of the graphitization. The fuzzy factors of safety (minimum, most likely, maximum) in Fig. 9b should not be read in terms of ordinates but rather in terms of membership values (µ values, which are perpendicular to the plane), i.e., µ(min. FS) = 0,
µ(most likely FS)= 1,µ(max. FS)= 0. For clarity, only representa-tive FSde and corresponding possibility Π and necessity Ν
values are shown in Figs. 9c and 9d, respectively. For exam-ple, the maximum and minimum values of fuzzy factors of safety values of 2.10 and 0.06 at a distance of 215 m along the pipe, location A in Fig. 9d, have memberships of 0 while the most likely FS value of 0.75 has a membership of 1. The interval between the minimum and maximum values of fuzzy factors of safety reflects the uncertainties present in the input data–parameters. It can also be observed that the interval between the minimum and maximum factors of safety lies between 0 and 1.2 at the three locations (Fig. 9d as B1(at 65 m), B4(at 182 m), and B5(at 270 m)) where the remaining wall thickness is less than 25% of the original pipe wall thickness. The membership functions for the fuzzy
factors of safety also do not have long tails; as explained earlier, this occurs largely as a result of the fact that corro-sion and loss of bedding support have an overwhelming in-fluence on pipe safety compared to other input data– parameters.
An alternative way to assess the significance of fuzzy fac-tors of safety is to determine the possibilityΠ and necessity Ν of failure at each location along the pipe length. As dis-cussed earlier, this requires the prior definition of critical factor of safety as a condition state of imminent failure. It is generally accepted that failure in civil engineering structures is imminent when FS < FScrwhere FScr= 1. Figures 9c and
9d show the profiles of possibilityΠ and necessity Ν of fail-ure for each pit along the pipe length. A close look at Fig. 9d indicates that the necessity of failure is particularly high at five locations (B1–B5), and if the pipe has not
al-ready failed at these locations, near 50%–100% certainty ex-ists that pipe failure is imminent at these locations.
The condition state of the pipe (Fig. 9a) depicts a snap-shot of the current condition. If the pipe were to continue to corrode at a certain rate, then the next wave of corrosion pits leading to pipe failures would likely occur at locations C1,
…, C5(shown in Fig. 9d). Subsequent wave(s) of corrosion pits would likely lead to future pipe failures as the pits grow over time.
The crisp (or pignistic) decision-making level of possibil-ity (risk) of failure can be derived by incorporating the deci-sion-maker’s attitude λd in the analysis. To illustrate this
concept, the possibility (risk) of failure at locations B2 (at 70 m) and A (at 210 m) are shown in Fig. 10. The corre-sponding possibility intervals [Ν, Π] at these locations are [0.49, 1] and [0.15, 1], respectively. It can be shown that for locations B2and A atλd = 0, i.e., for the lowest possible op-timism, the possibility of failure reduces to Π = 1 in both cases. Similarly, forλd = 1, i.e., for the highest possible op-timism, the possibility of failure reduces to Ν = 0.49 and 0.15, respectively. For any other intermediate degree of opti-mismλd, the possibility (risk) of failure can be derived
rep-resenting the preference of a decision-maker.
Fig. 10.Variation of possibility of failure with degree of opti-mism (orness).
Conclusions
A previously developed Winkler-type pipe–soil interaction (WPSI) model was cast in a possibilistic framework to han-dle uncertainties encountered in the input data–parameters (using triangular fuzzy numbers) and to determine the fuzzy factors of safety (FS). Fuzzification of input data–parameters in a possibilistic framework provided a systematic approach to incorporate and propagate uncertainties throughout the so-lution process. The dual measures of “possibility” and “ne-cessity” computed in this study can be integrated with failure consequences to allow the designer–owner–operator to decide the level of risk that he or she is willing to take and thus define different repair and maintenance strategies at different risk tolerances (Fig. 1).
A Monte Carlo type random sampling coupled with rank correlation method was performed to identify input data–pa-rameters that dominate the FS. This type of analysis enables the identification of critical parameters and the interaction between them. As expected, independent of the failure crite-ria, input parameters that affect the structural resistance of the pipe (i.e., remaining wall thickness, residual strength (bi-axial), and fracture toughness) are positively correlated with the FS. On the other hand, input data–parameters that con-tribute to the generation of stresses (i.e., unsupported length, temperature differential, and external load (including the ef-fect of frost load)) exhibit negative correlation with the dis-tortion factor of safety. Sensitivity analyses also confirm that large-diameter mains are more sensitive to external loads, and small-diameter mains are sensitive to the extent of loss of bedding support. The sensitivity analyses strongly suggest that reducing pit depth (graphitization) growth by using ef-fective corrosion control can be the single most efef-fective way to decelerate the breakage growth rate of existing pipes. This observation corroborates the experience of utilities and corrosion engineers.
The decision to renew or replace specific pipe segments or the whole pipe will depend on the physical parameters (cor-rosion or pit growth rate(s), density of the cor(cor-rosion pits along the pipe length, hydraulics, and water quality), eco-nomics (costs of repair, renewal or replacement, discount factor, etc.), and attitude of a decision-maker. The proposed approach is a step towards the formulation of a method to fa-cilitate the decision-making process of when to repair, re-new, or replace individual pipe lengths based on their current condition state.
References
Ahammed, M., and Melchers, R.E. 1994. Reliability of under-ground pipelines subject to corrosion. ASCE Journal of Trans-portation Engineering, 120(6): 989–1002.
Alim, S. 1988. Application of Dempster–Shafer theory for inter-pretation of seismic parameters. ASCE Journal of Structural En-gineering, 114(9): 2070–2084.
ASME. 1991. Manual for determining the remaining strength of corroded pipelines: a supplement to ASME B31G-1991 code for pressure piping. American Society of Mechanical Engineers (ASME), New York.
AWWA. 1977. American national standard for thickness design of cast-iron pipe. ANSI/AWWA C101-67 (R1977), American Wa-ter Works Association (AWWA), Denver, Colo.
Brander, R. 2001. Calgary’s experience with corrosion of water mains 1970–2000. PVC News, 24(2): 1–3, 15.
Brander, R., and Ng, B. 2002. Developing a condition assessment technique for water mains. In Assessing the future: water utility infrastructure management. Edited by D.M. Huges. American Water Works Association (AWWA), Denver, Colo. Chapt. 12. Coffin, L.F. 1950. The flow and fracture of a brittle material.
Jour-nal of Applied Mechanics, 181: 233–248.
Cooper, J.A., Ferson, S., and Cooper, D.K. 2000. Constrained math-ematics for calculating logical safety and reliability probabilities with uncertain inputs. Journal of System Safety, 36: 23–29. Cullen, A.C., and Frey, H.C. 1999. Probabilistic techniques in
expo-sure assessment: a handbook for dealing with variability and un-certainty in models and inputs. Plenum Press, New York. 352 pp. Dubois, F., and Prade, H. 1988. Possibility theory: an approach to
computerized processing of uncertainty. Plenum Press, New York. Ferson, S., and Ginzburg, L.R. 1996. Different methods are needed to propagate ignorance and variability. Reliability Engineering and System Safety, 54: 133–144.
Ferson, S., Joslyn, C.A., Helton, J.C., Oberkampf, W.L., and Sentz, K. 2004. Summary from the epistemic uncertainty workshop: consensus amid diversity. Reliability Engineering and System Safety, 85: 355–369.
Fisher, J.C. 1952. A criterion for the failure of cast iron. ASTM Bulletin, 181: 74–75.
Guyonnet, D., Côme, B., Perrochet, P., and Parriaux, A. 1999. Comparing two methods for addressing uncertainty in risk as-sessments. ASCE Journal of Environmental Engineering,
125(7): 660–666.
Guyonnet, D., Bourgine, B., Dubois, D., Fargier, H., Côme, B., and Chilès, J. 2003. Hybrid approach for addressing uncertainty in risk assessments. ASCE Journal of Environmental Engineering,
129(1): 68–78.
Hartman, W.F., and Karlson, K. 2002. Condition assessment of wa-ter mains using remote field technology. In INFRA 2002: Pro-ceedings of the 8th Annual Infra Conference, Montréal, Que., 25–27 November 2002. CD-ROM. Centre d’expertise et de re-cherche infrastructures urbaines (CERIU), Québec City, Que. Jackson, R.Z., Pitt, C., and Skabo, R. 1992. Non-destructive testing
of water mains for physical integrity. American Water Works Association Research Foundation, Denver, Colo.
Joslyn, C.A., and Booker, J.M. 2004. Generalized information the-ory for engineering modeling and simulation. In Engineering de-sign reliability handbook. Edited by E. Nikolaidis and D. Ghiocel. CD-ROM. CRC Press, Boca Raton, Fla. Chapt. 9, pp. 1–40. Klir, G.J., and Yuan, B. 1995. Fuzzy sets and fuzzy logic: theory
and applications. Prentice-Hall, Inc., Englewood Cliffs, N.J. Lillie, K., Reed, C., Rodgers, M.A.R., Daniels, S., and Smart, D.
2004. Workshop on condition assessment devices for water transmission mains. American Water Works Association Re-search Foundation, Denver, Colo.
Mair, W.M. 1968. Fracture criteria for cast iron under biaxial stresses. Journal of Strain Analysis, 3(4): 254–263.
Melchers, R.E. 1987. Structural reliability: analysis and prediction. John Wiley & Sons, Inc., New York.
Moore, D.W. 1939. Discussion on the new law of design of cast iron pipe. Journal of the American Water Works Association,
31(10): 1655–1674.
Rajani, B., and Kleiner, Y. 2004. Non-destructive inspection tech-niques to determine structural distress indicators in water mains.
In Proceedings of the Conference on Evaluation and Control of Water Loss in Urban Water Networks, Valencia, Spain, 21–25 June 2004. pp. 1–20.
Rajani, B., and Makar, J. 2000. A methodology to estimate remain-ing service life of grey cast iron water mains. Canadian Journal of Civil Engineering, 27(6): 1259–1272.
Rajani, B., and Tesfamariam, S. 2004. Uncoupled axial, flexural, and circumferential pipe–soil interaction analyses of partially supported jointed water mains. Canadian Geotechnical Journal,
41(6): 997–1010.
Rajani, B., and Zhan, C. 1996. On the estimation of frost loads. Canadian Geotechnical Journal, 33(4): 629–641.
Rajani, B., Zhan, C., and Kuraoka, S. 1996. Pipe–soil interaction analysis of jointed water mains. Canadian Geotechnical Journal,
33(3): 393–404.
Rajani, B., Makar, J., McDonald, S., Zhan, C., Kuraoka, S., Jen, C.-K., and Viens, M. 2000. Investigation of grey cast iron water mains to develop a methodology for estimating service life. American Water Works Association Research Foundation, Den-ver, Colo.
Ross, T. 2004. Fuzzy logic with engineering applications. 2nd ed. John Wiley & Sons, Inc., New York.
Sadiq, R., Rajani, B., and Kleiner, Y. 2004. Probabilistic risk anal-ysis for corrosion associated failures in grey cast iron water mains. Reliability Engineering and System Safety, 86(1): 1–10. Schlick, W.J. 1940. Supporting strength of cast iron pipe for gas and water services. Bulletin 146, Iowa Engineering Experimen-tal Stations, Ames, Iowa.
Shackle, G.L.S. 1961. Decision, order and time in human affairs. Cambridge University Press, Cambridge, UK.
Smets, Ph. 2000. Data fusion in the transferable belief model. In Fusion 2000: Proceedings of the 3rd International Conference on Information Fusion, Paris, France, 10–13 July 2000. CNRS Press, Paris. pp. PS21–PS33.
Ugural, A.C., and Fenster, S.K. 1987. Advanced strength and applied elasticity. Elsevier Science Publishing Co., New York. 471 pp. Watkin, R.K., and Anderson, L.R. 2000. Structural mechanics of
buried pipes. CRC Press, Boca Raton, Fla. 464 pp.
Yager, R.R. 1988. On ordered weighted averaging aggregation in multicriteria decision making. IEEE Transactions on Systems, Man and Cybernetics, 18: 183–190.
Zadeh, L.A. 1965. Fuzzy sets. Information and Control, 8(3): 338–353. Zadeh, L.A. 1978. Fuzzy sets as a basis for a theory of possibility.
Fuzzy Sets and Systems, 1(1): 3–28.
List of symbols
a1 constant (geometric factor)
an lateral dimension of a pit
As, Bs, Cs, Ds scenarios
Ai fuzzy set (number)
Aiα fuzzy set (number) at α-cut level
b unsupported pipe length
b1 constant (geometric factor)
Bb trench width
d corrosion pit depth
dr difference of ranks
D outside pipe diameter
Ep elastic modulus of pipe
Es elastic modulus of soil FS factor of safety FScr critical factor of safety
FSde distortion energy factor of safety FSip in-plane factor of safety
H trench depth
K stress concentration factor
Kq fracture toughness
L pipe length
L1 multiplier
pi pipe internal pressure
pi′ working pressures pt transient water pressure
P internal bursting pressure necessary to cause pipe failure
q overburden load
R number of Monte Carlo type iterations
s constant (residual ultimate strength)
S number of fuzzy input parameters
t pipe wall thickness
tmin remaining wall thickness
TFN triangular fuzzy number
u any value defined of the universe of discourse
U universe of discourse
w external bearing load
w′ working load
W three-edge crushing (ring) load
x dummy uncertain quantity (subset of set Ai)
α alpha-cut level
αd orness (decision-maker’s attitude)
αt thermal coefficient
αur constant (residual ultimate strength)
β geometric factor (fracture toughness)
∆T maximum temperature difference between water tem-perature and surrounding soil
γs soil submerged unit weight
λd degree of orness
µ fuzzy membership function µFS membership function of FSµFScr
µx membership function
νp pipe Poisson’s ratio
νs soil Poisson’s ratio
Ν necessity Π possibility
ρs Spearman rank correlation coefficient
σ1,σ2 biaxial stresses
σbu burst tensile strength
σr rupture modulus
σu tensile strength
σur residual ultimate strength
σx axial stress
σxa total axial stress
σxf stress in the longitudinal direction due to flexural action
σxpi axial stress due to internal pressure
σxT axial stress due to temperature differential
σxw axial stress due to external loads
σθ hoop stress
σθf hoop stress due to the Poisson’s effect of longitudinal
bending
σθpi hoop stress due to internal pressure σθT hoop stress due to temperature differential
σθTotal total hoop stress