Publisher’s version / Version de l'éditeur:
Vous avez des questions? Nous pouvons vous aider. Pour communiquer directement avec un auteur, consultez la première page de la revue dans laquelle son article a été publié afin de trouver ses coordonnées. Si vous n’arrivez pas à les repérer, communiquez avec nous à [email protected].
Questions? Contact the NRC Publications Archive team at
[email protected]. If you wish to email the authors directly, please see the first page of the publication for their contact information.
https://publications-cnrc.canada.ca/fra/droits
L’accès à ce site Web et l’utilisation de son contenu sont assujettis aux conditions présentées dans le site
LISEZ CES CONDITIONS ATTENTIVEMENT AVANT D’UTILISER CE SITE WEB.
Proceedings of the 3rd International Building Physics Conference: 27 August 2006, Concordia University, Montreal, QC., pp. 443-450, 2006-08-27
READ THESE TERMS AND CONDITIONS CAREFULLY BEFORE USING THIS WEBSITE.
https://nrc-publications.canada.ca/eng/copyright
NRC Publications Archive Record / Notice des Archives des publications du CNRC :
https://nrc-publications.canada.ca/eng/view/object/?id=b6d07dd5-96d0-4901-b70c-e4d2e31a6a84 https://publications-cnrc.canada.ca/fra/voir/objet/?id=b6d07dd5-96d0-4901-b70c-e4d2e31a6a84
NRC Publications Archive
Archives des publications du CNRC
This publication could be one of several versions: author’s original, accepted manuscript or the publisher’s version. / La version de cette publication peut être l’une des suivantes : la version prépublication de l’auteur, la version acceptée du manuscrit ou la version de l’éditeur.
Access and use of this website and the material on it are subject to the Terms and Conditions set forth at
Understanding air barriers in mechanically attached low slope roofing assemblies for wind uplift
http://irc.nrc-cnrc.gc.ca
U nde rst a nding a ir ba r rie rs in
m e c ha nic a lly at t a che d low slope roofing
a sse m blie s for w ind uplift
N R C C - 4 8 6 9 0
B a s k a r a n , A . ; M o l l e t i , S . ; B o o t h , R . J .
A version of this document is published in / Une version de ce
document se trouve dans : Research in Building Physics and
Building Engineering, Concordia University, Montreal, August
27-31, 2006, pp. 443-450
1
Understanding air barriers in mechanically attached low slope roofing
assemblies for wind uplift
A. Baskaran & S. Molleti
Research Officers, National Research Council Canada, Ottawa, Ontario, Canada, K1A 0R6
R.J. Booth
President, Hansed Booth Inc., Building Science and Technology. Dalkeith, Ontario, Canada
ABSTRACT: Wind flow over a mechanically attached roofing assembly (MAA) can lift the membrane and cause it to flutter or “billow”. Air leakage into the assembly from building interior is a concern for wind uplift resistance of MAA. MAA is a growing segment of the low-slope roofing market however there is no widely accepted standard specification or test method to quantify air leakage through them. An experimental procedure has been under development for quantifying the air leakage rate of MAA. Assemblies with two barrier types, conventional polyethylene film and reinforced modified bituminous film, were evaluated. Data clearly indicates that MAA with barriers had lower air leakage rate than without. The air leakage impact on wind uplift resistance has also been evaluated under dynamic environment. Assemblies with barriers performed better than the assemblies without one.
1 INTRODUCTION
In North America, low slope membrane roofing assembly can be classified in two categories according to the location of the waterproofing membrane. One is the protected roofing assembly, where the insulation is on the top with membrane below it and the other is the conventional roofing assembly, where the membrane is on the top with insulation below the membrane. The membrane in conventional roof assembly is exposed to external conditions such as wind, snow, rain, UV radiation and temperature changes. In conventional roof assemblies the membrane can be mechanically attached, fully adhered or partially attached to the substrate. A roofing assembly in which the membrane is attached, through insulation and other components, to the structural deck at discrete points using fasteners is known as a Mechanically Attached Assembly (MAA). The membrane can be a single ply of membrane or a two-ply membrane as in the case of modified bituminous system. The present study focuses on the Mechanically Attached Assembly (MAA) with single-ply membrane. Approximately one fourth of North American low slope/commercial buildings are roofed with MAA with single-ply membrane.
In general airflow control is achieved by the installation of an air barrier system. One of the system mitigation functions of the air barrier system in MAA is to minimize air leakage through the roofing system
and thereby reduce membrane flutter and associated fatigue. In cold climates the air barrier system can also reduce condensation by impeding transfer of air borne moisture into the system. The term air barrier system and vapour barrier (retarder) are sometimes misunderstood. Vapour control is achieved through a material, which is a vapour barrier, while the airflow control is achieved by the application of air barrier materials and by sealing joints and junctions, which altogether form an air barrier system. Sometimes attempts have been made to achieve the requirements of both (air and vapour control) by using one material (Quirouette, 1985). However the component properties and system performance should be considered before deciding that one material can do double duty of air and vapour control. The Canadian Roofing Contractor’s Association’s Specification Manual considers materials for air and vapour control separately (CRCA, 2002).
With advancement in roofing technology different types of commercial air barrier materials, vapour barriers and membranes are being introduced into the market. Unfortunately no standard specifications or test methods exist to quantify air leakage in MAA. An attempt to develop experimental procedure to quantify air leakage of MAA is underway. The main contribution of this paper is to:
1.Determine which component best performs the role of air barrier system in MAA.
3.Demonstrate the mitigation effect of an air barrier
system in the wind uplift resistance of MAA. 2 AIR BARRIER IN MAA
MAA differ from conventional fully adhered Built-up roofing assembly (BUR). In the BUR assembly, different plies of felt are fully adhered to the substrate and this offers significant resistance to airflow. Air leakage control in MAA is more complex due to discontinuous attachment of the flexible single-ply membrane. The installation of a single component may not significantly prevent air leakage (Baskaran et al, 2003). For effective air leakage control a system approach to air tightening is needed. One material does not provide airflow control in MAA; rather air tightening of materials including every joint and seam provides the composite air barrier. Though MAA offer good wind uplift resistance with proper design, its air leakage performance is not well understood and this can influence wind uplift performance.
For airflow to occur, there must be both:
1. a pressure difference between two locations, 2. a continuous flow path or opening connecting the
locations
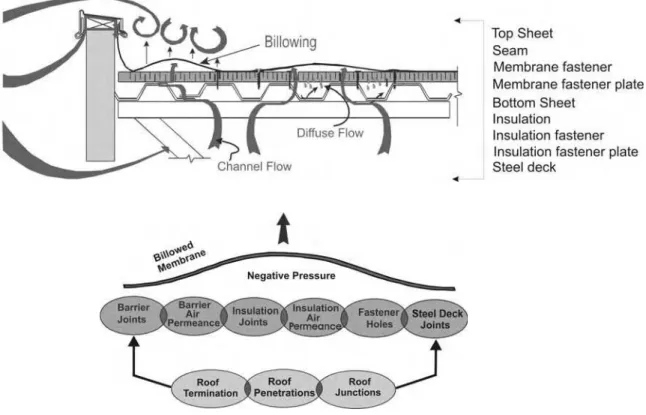
MAA meet these two prerequisites during wind uplift conditions. Figure 1 illustrates the airflow mechanism through MAA. The waterproof membrane, which is intended to act as an air barrier, is placed on top of the insulation and attached to the structural steel deck using mechanical fasteners. The attachment locations are then overlapped and seamed. Wind induced suction lifts the membrane and causes membrane elongation and billowing between the attachments. The magnitude of the wind induced suction, the membrane’s elastic properties and the fastening pattern determine the deflection of the membrane billowing. The momentary displacement or billowing of the membrane creates a relative negative pressure below the lifted membrane and this draws indoor air into the roof, thereby satisfying the first prerequisite. The second prerequisite is met by the lack of airflow control at the deck level. Flow paths are created by the 1) component’s air permeability and 2) joints/junctions/ penetrations in the roofing assembly. Based on the above discussion, the need for a separate air barrier component is clear in the case of MAA. Equally, the air barrier component can be best placed below the insulation to prevent the indoor airflow entering into the system. A vapour barrier may not
satisfy all the requirements of air barrier system. As per NBCC1 (2005), the air barrier system must meet four requirements namely continuity, air impermeability, strength and durability. Air infiltration due to air pressure differences is higher than vapour pressure differences (Bomberg & Kumaran (1986) & Tobiasson (1984)). This is due to the fact that small air currents under pressure difference are capable of carrying significant amount of vapour compared to diffusion. Thus the nature of flow and driving forces are different. In that situation, if one considered a vapour barrier to do the double duty of air and vapour control than that component should satisfy all the requirements of air barrier system as well.
3 EXPERIMENTAL APPROACH
An experimental program for quantification of air leakage through MAA has been initiated at the NRC/IRC. By constructing mock-ups at the Dynamic Roofing Facility at NRC, assemblies with and without barriers were tested. In the present experimental setup barrier means a component installed in the roofing assembly to prevent airflow into the system.
As shown in Figure 2, the testing apparatus consists of a 1 m x 1m x 0.32 m top chamber and a 1m x 1m x 0.14m bottom frame. Both the top chamber and the bottom frame were constructed of 19 mm thick plywood. The test assemblies were constructed in the bottom frame and covered by the top chamber. To ensure minimum air leakage through the test chamber:
all surfaces of the testing chamber were treated with several coats of paint to make it air tight, the top chamber and the bottom frame are
interlocked by a tongue and groove joint,
closed cell foam gaskets are used as seal between the tongue and groove joint.
clamping devices are applied to compress the top chamber with the bottom frame
In the current study a Merriam Laminar Flow Element – (Model 50 MW20) was used to measure the airflow and MKS pressure transducers measured differential air pressures. All tests were carried out in an indoor laboratory environment (air pressure 101 kPa, ambient temperature 21oC and air density 1. 202 kg/m3). This experimental set-up assumed that the continuous waterproofing membrane in the roofing assembly is airtight and therefore can be excluded from the experiment. Therefore experimental mock-ups do not include a roofing membrane.
1
3
Figure 1: Wind uplift mechanism of MAA without adequate air barrier
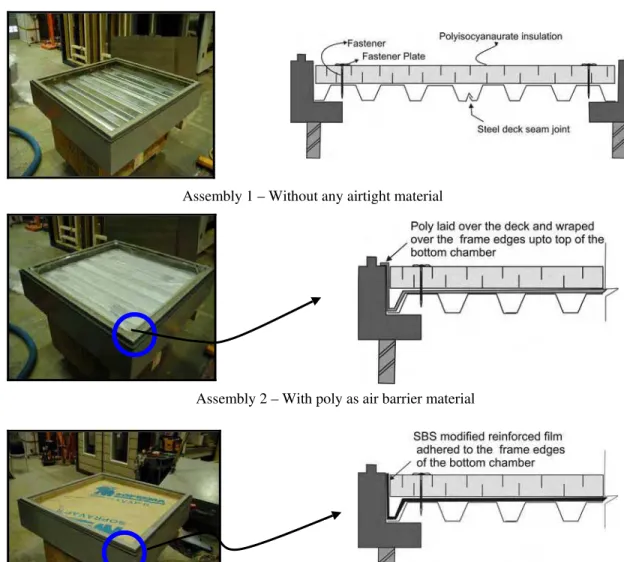
As shown in Figure 3, Assembly 1 (A1) had no barrier; Assembly 2 (A2) had polyethylene as a barrier, and Assembly 3 (A3) had self-adhered film (SAF) as a barrier.
The tested assemblies consisted of the following roofing components whose general physical and mechanical properties are:
Deck: 0.76 mm (22-Ga) thick corrugated steel deck with a profile height of 38 mm (1.5”) and a flute width of 150 mm (5.9”)
Insulation: 51 mm (2”) thick polyisocyanurate (ISO) boards of 1200 mm x 2400 mm (4 8” x 96”) with a compressive strength of 170 kPa (25 psi). In order to accommodate in the testing chamber the insulation boards were cut to dimensions of 1000 mm x 1000 mm (39” x 39”).
Barrier: In the present experimental setup, barrier means a component installed in the roofing assembly to prevent airflow into the system. Two types of barriers are used:
1) Polyethylene film -single layer of 6 mil (0.006”) sheet was loose laid over the steel deck.
2) SBS modified self-adhered film (SAF) –The SAF is composed of SBS modified bitumen and surface reinforced. The top surface is a high-density polyethylene grid laminated between two layers of polyethylene film. A silicone release plastic film covers the self-adhesive under face. The width of the membrane is 1143 mm (45”) and has a thickness of 0.8 mm.
Assembly 1 comprises steel deck, and insulation without any barrier. The steel deck was installed and fastened to the L-shaped frame of the bottom chamber. The steel deck has one seam with a v-shaped interlocking system as shown in the Figure 3. The cut insulation boards were installed and fastened to the steel deck with four fasteners equally placed from the chamber edges as shown in Figure 3. Fasteners were 127 mm (5”) long with plastic plate 76-mm (3”) diameter.
In Assembly 2, a new steel deck was installed and a continuous sheet of 6-mil (0.006”) polyethylene sheet was laid over the steel deck as shown in Figure 3. With the polyethylene in position, a new insulation board is installed and fastened to the steel deck following the same procedure as Assembly 1. The
edge treatment of polyethylene is a critical issue when using polyethylene as a barrier because the major portion of airflow occurs at the edges. In this particular setup, the polyethylene was wrapped over the frame edges of the bottom frame as shown in Figure 3.
Replacing the steel deck and insulation from Assembly 2 with a new set of steel deck and insulation a self-adhered film (SAF) was used as an air barrier in Assembly 3. The self-adhered membrane was a continuous strip without any joints as shown in Figure 3. The installation procedure for the insulation is similar to A1 and A2. To be consistent, the self-adhered membrane was self-adhered to the sides of the bottom frame as shown in Figure 3 thus making the edges sealed.
These assemblies were devoid of any barrier and insulation joints. For each assembly a minimum of two specimens were tested using the following procedure:
1. A negative pressure differential of 240 Pa to 2400 Pa (5 to 50 psf) in increments of 240 Pa (5 psf) was created across the test specimen.
2. At each pressure differential, after the test conditions were stabilized, the flow meter reading (Q) and test pressure difference (ΔP) were recorded.
3. The procedure was repeated by depressurizing from 2400 Pa to 240 Pa (50 to 5 psf) in decrements of 240 Pa (5 psf), to determine if the measurement process has affected the air leakage of the test specimen.
4 RESULTS AND DISCUSSION
Despite all efforts to make the testing chamber airtight, a small amount of air entered into the envelope of the apparatus from the exterior environment. This is called the extraneous air leakage (Qe), The actual air leakage through the assembly (Qs) is the difference between the total measured air flow (Qt) and the extraneous air leakage (Qe) i.e.
Qs = Qt - Qe (1)
The extraneous leakage of the apparatus was estimated by installing a 10 mm thick polycarbonate as a test specimen between the bottom frame and top chamber, and by following the test procedure mentioned above the extraneous air leakage can be measured. The extraneous air leakage from the testing chamber is shown in Figure 4.
5
Assembly 1 – Without any airtight material
Assembly 2 – With poly as air barrier material
Assembly 3 – With Self Adhered Film (SAF) as air barrier material
Clamping Devices
Fully installed assembly ready for testing
Figure 5 displays the air leakage data for the three tested assemblies. Data clearly indicates that A1 without barrier had a greater leakage rate when compared to A2 (Poly) and A3(SAF).
A power law equation is commonly used (CMHC, 1988) to approximate the relationship between air infiltration through the assembly (Qs) and differential pressure across the assembly (ΔP).
Qs = K A (ΔP)n (2) Where:
K = variable dependent on the intrinsic air permeability of the system
A is the cross sectional area of the assembly n is the flow exponent, ranges from 0.5
(turbulent flow) to 1.0 (laminar flow).
For A1, the flow exponent was 0.6 indicating a turbulent flow through the assembly due to the absence of a barrier. The presence of barrier in A2and A3 reduced the air leakage and flow disturbance. The
flow exponent had a value close to 1.0 suggesting laminar flow through these assemblies.
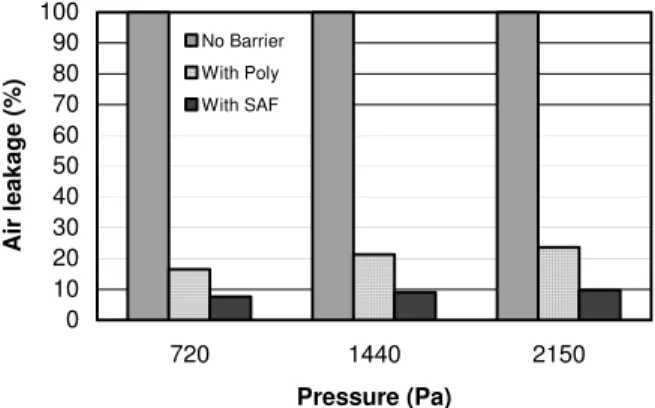
Figure 6 compares the airflow resistance of the three assemblies at three differential pressures. If it is assumed that A1 without any barrier had 100% air leakage then the poly in A2was able to reduce airflow by 80% while the self-adhered film in A3was able to reduce it by 90 %. The high leakage rate of A1 is attributable primarily to the channel flow occurring at the deck and insulation joints and secondarily due to the diffuse flow through the polyisocyanurate insulation and fastener holes (fastener holes are minor air leaks as the holes are filled with screws and compression of fastener plates against the insulation). The polyethylene sheet reduced the airflow rate into the system, however the edge treatment of polyethylene sheet (refer to Figure 2) is critical. The 10% air leakage through A3 is attributable to diffuse flow through the self-adhered film and the edge treatment. 0.00 0.05 0.10 0.15 0.20 0.25 0.30 0 500 1000 1500 2000 2500 3000
Pressure Difference (Pa)
A ir Flow R a te (L/s .m 2) Measured Data Fitted Data
Figure 4: Extraneous air leakage of the testing apparatus 0.00 0.50 1.00 1.50 2.00 2.50 3.00 3.50 4.00 4.50 5.00 0 500 1000 1500 2000 2500 3000
Pressure Difference (Pa)
A ir Flow R a te (L/s .m 2) A1- No Barrier A2 - With Poly A3 - With SAF Measured Data Fitted Data 0 10 20 30 40 50 60 70 80 90 100 720 1440 2150 Pressure (Pa) Ai r l e akage (%)
For an air barrier system, Part 5 of the NBCC (2005) specifies a maximum allowable air leakage rate 0.15 L/s.m2 at a differential pressure of 75 Pa. Air leakage rates were calculated using equation 2. A1 had a leakage rate of 0.490 L/s.m2 while A2 and A3 had leakage rates of 0.024 L/s.m2 and 0.006 L/s.m2 respectively. Comparison of these data with the NBCC indicates that both A2 and A3 clearly fall within the specified range of NBCC. This characteristic highlights the dual (air/vapour barrier) functionality of one material. However, these observations were based on small scale experiments that were devoid of localized leaks such as joints, junctions and penetrations which would, if present, add to overall system leakage. Additional research efforts are in progress on larger scale assemblies.
No Barrier With Poly With SAF
Figure 5: Air leakage through the three tested assemblies
Figure 6: Relative comparison of the air leakage resistance of the tested assemblies
5 DYNAMIC WIND UPLIFT TESTING OF MECHANICALLY ATTACHED SSYSTEMS
The impact of air leakage on wind uplift resistance in MAA was evaluated at the Dynamic Roofing Facility (DRF) established at the IRC/NRC. Three full scale 2006 mm (6.5’) x 6000 mm (20’) roofing assemblies were constructed for the wind uplift evaluation testing, which were:
7
1. Assembly 1: A1 - No barrier 2. Assembly 2: A2 - Polyethylene
3. Assembly 3: A3 - Self Adhered Film (SAF)
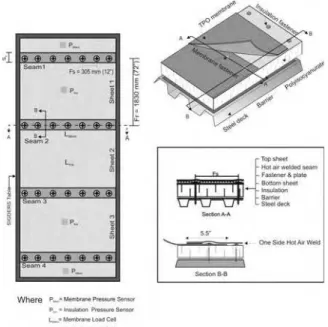
The three test assemblies comprised of a 45mil thermoplastic olefin membrane as the water proofing membrane. All the roofing components were similar to the one used for the air leakage quantification study mentioned above. Figure 7 illustrates the geometric details of a typical tested assembly.
All the three tested assemblies were subjected to the CSA dynamic load cycle (CSA, 2004). Figure 8 shows an example of the typical measured response data for assemblies with and without barrier.
Assembly 1 (NOVB) sustained a maximum pressure of 4.3 kPa (90 psf), while Assembly 2 (Poly), Assembly 3 (SAF) sustained a maximum pressure of 6.5 kPa (135 psf). Data from these preliminary findings indicated that assemblies with barriers performed better than assemblies without barriers. Wind uplift performance is improved about 50% on assemblies with barriers. To understand this, further data analysis was undertaken by comparing the
pressure and load variation between the membrane and insulation for the three assemblies.
0 10000 20000 30000 40000 50000 Time, secs 0 30 60 90 120 150 180 Pr e s s u re , p s f 23 45 68 90 45 68 90 58 86 113 Level A B No Barrier
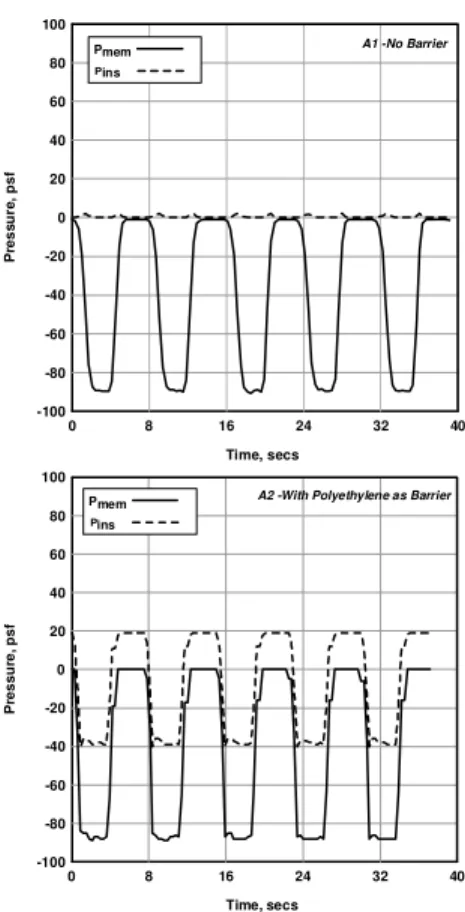
Figure 9 illustrates a segment of five wind load cycles taken from the measured pressure time history showing the pressure variation between membrane and insulation for A1 and A2. The membrane when subjected to suction at the top, billows and transfers the forces through the fastener to the structural deck. This is true irrespective of the system. In the case of A1 (No Barrier), there is no pressure building up across the insulation and the insulation acts as a spacer between the membrane and deck. However, in the case of assemblies with barrier, the insulation boards share about one third of the applied suction, because of the airflow résistance offered by these barriers. Similarly the load comparison indicated that there was load sharing between the membrane and insulation in the case of assemblies with barrier. In assembly without barrier the membrane takes the maximum load with zero load on the insulation. The presence of barrier reduces air infiltration into the roofing assembly reducing the membrane deflection thereby distributing the wind load between the membrane and insulation. This load distribution reduces the membrane stress at the fasteners thereby increasing
Figure 7: Geometric details of a typical tested assembly
Figure 8: Wind uplift rating of assemblies with and without barrier (1psf = 47.88 Pa)
0 10000 20000 30000 40000 50000 0 30 60 90 120 150 180 Time, sec Pr e s s u re , p s f 23 45 68 90 45 68 90 58 86 113 113 86 68 102 135 102 135 79 119 158 158 Level A B C D SAF 1
the wind uplift pressure. This was found true for both barrier types. More details of the analysis can be found in Molleti (2006).
4 CONCLUSION
Currently no procedure or standard exists for quantification of air leakage through mechanically attached roofing assemblies. This paper presents an approach for the quantification of air leakage through MAA. Small-scale roofing assemblies with and without barriers were quantified for air leakage. Data clearly indicated that assemblies without barrier had a high rate of air leakage, compared to assemblies with barrier. With the quantification of air leakage its impact on wind uplift performance was also evaluated. Assemblies with barriers provided better wind uplift resistance than the assemblies without one. Studies will be undertaken to quantify air leakage through full-scale MAA and correlate air leakage resistance with the wind uplift performance.
6 ACKNOWLEDGEMENTS
The presented research is being carried out for a consortium - Special Interest Group for Dynamic Evaluation of Roofing Systems (SIGDERS).
SIGDERS was formed from a group of partners who were interested in roofing design. These partners included:
Manufacturers: Atlas Roofing Corporation, Canadian General Tower Ltd., Carlisle Syn. Tech., GAF Materials Corporation, Genflex Roofing Systems, Firestone Building Products Co., IKO Industries Canada, ITW Buildex, Johns Manville Corporation, Sarnafil Ltd., Stevens Roofing systems, Soprema Canada, Tremco and Trufast
0 8 16 24 32 40 Time, secs -100 -80 -60 -40 -20 0 20 40 60 80 100 P res s u re, p s f Pmem Pins A1 -No Barrier
Building Owners: Canada Post Corporation, Public Works and Government Services Canada.
Industry Associations: Canadian Roofing Contractors' Association, Canadian Sheet Steel Building institute, National Roofing Contractors' Association and Roof Consultants Institute. 0 8 16 24 32 40 Time, secs -100 -80 -60 -40 -20 0 20 40 60 80 100 P ressu re, psf Pmem Pins
A2 -With Polyethylene as Barrier
Figure 9: Pressure variation between the membrane and insulation @ 90 psf (1 psf = 47.88 Pa)
Research Agencies: Institute for Research in Construction, Institute for Aerospace Research and Canadian Construction Material Centre.
7 REFERENCES
Baskaran, A et al. (2003). Wind uplift performance of mechanically attached roofing systems with vapour barrier, 9th Conference on Building Science and Technology, Vancouver, British Columbia, Canada, February 27-28.
Bomberg, M. & Kumaran, M.K. (1986). A test method to determine airflow resistance of exterior membranes and sheathings, Journal of Thermal Insulation, V.9: 224-235.
CSA Number A123.21-04,”Standard test method for the dynamic wind uplift resistance of mechanically attached membrane-roofing systems, Canadian Standards Association, Canada.
CRCA (2002). Canadian Roofing Contractor’s Association, 2430 Don Reid Dr., Suite 100, Ottawa, Canada.
CMHC (1998). Air permeance of building materials, Canada Mortgage and Housing Corporation, Ottawa, Canada.
Molleti,S (2006). “Performance Evaluation of Mechanically Attached Roofing Systems”, PhD thesis, University of Ottawa, Ottawa, Canada NBCC (2005). National Building Code of Canada,
Ottawa, Ontario, Canada, K1A 0R6.
Quirouette, R.L. (1985). The difference between a vapour barrier and an air barrier. Building Practice Note, Division of Building Research, National Research Council Canada, 54.
Tobiasson. W. (1984). Condensation control in low slope roofs. Proceedings of the Symposium Moisture Control in Building, Building Thermal Envelope Co-ordinating Council: pp 47-59.