HAL Id: halshs-00809753
https://halshs.archives-ouvertes.fr/halshs-00809753
Preprint submitted on 9 Apr 2013
HAL is a multi-disciplinary open access archive for the deposit and dissemination of sci-entific research documents, whether they are pub-lished or not. The documents may come from teaching and research institutions in France or abroad, or from public or private research centers.
L’archive ouverte pluridisciplinaire HAL, est destinée au dépôt et à la diffusion de documents scientifiques de niveau recherche, publiés ou non, émanant des établissements d’enseignement et de recherche français ou étrangers, des laboratoires publics ou privés.
on mobility and wages
Arna Chéron, Bénédicte Rouland, François Charles Wolff
To cite this version:
Arna Chéron, Bénédicte Rouland, François Charles Wolff. Returns to firm-provided training in France: Evidence on mobility and wages. 2010. �halshs-00809753�
WORKING PAPER
N° 2010 - 10
Returns to firm-provided training in France:
Evidence on mobility and wages
A
RNAUDC
HÉRON,
B
ÉNÉDICTER
OULAND,
F
RANÇOIS-C
HARLESW
OLFFwww.tepp.eu
TEPP - Institute for Labor Studies and Public Policies
Returns to firm-provided training in France:
Evidence on mobility and wages
#Arnaud Chéron
*Bénédicte Rouland
**François-Charles Wolff
***January 2010
Abstract: While numerous studies have provided selectivity-corrected estimates of the wage
returns to training both in the US and in European countries, less is known about the impact of training on mobility on the labour market. In this paper, we estimate the impact of firm-provided training on both the employment-unemployment and job-to-job transitions using French panel data covering the 1998-2000 period. We find that participating to a training session in 1998 reduces the probability to experience an employment-unemployment transition during the period and that the probability to switch firms is higher among untrained workers. Additional results on the effect of training on wages indicate that training participation in 1998 increases wages by 7% in 2000, the wage premium remaining flat along the wage distribution.
JEL Classification: J24, J31, J6, J7
Keywords: Returns to training, matching estimators, labour market mobility, wages, France
#
We are indebted to Salima Bouayad and Xavier Joutard for their very helpful comments. We also would like to thank participants at the EPEE seminar (Evry), the Journées Louis-André Gérard-Varet (Marseille), the Annual Congress of the European Society for Population Economics (London) and the European Economic Association Congress (Milan). The usual disclaimer applies
*
GAINS, Université du Mans, France and EDHEC, France.
Email : arnaud.cheron@univ-lemans.fr http://www.univ-lemans.fr/~acheron/ **
Corresponding author. Université du Mans (GAINS), Faculté de Droit et de Sciences Economiques, Avenue Olivier Messiaen, 72085 Le Mans Cedex 9, France.
E-mail : benedicte.rouland.etu@univ-lemans.fr ***
LEMNA, Université de Nantes, France; CNAV and INED, Paris, France. E-mail: francois.wolff@univ-nantes.fr http://www.sc-eco.univ-nantes.fr/~fcwolff
1. Introduction
The European Heads of Government in the Lisbon Summit at the beginning of the new millennium strongly committed to make Europe by 2010 as “the most competitive and dynamic knowledge-based economy in the world”. The development of high quality vocational training in Europe is a crucial part of this strategy, especially in order to improve and adapt existing skills to the changes of technology and to promote employability1. Firms have of course a key role in the training investment process since they are the main on-the-job training supplier. For instance, in France which is the country under consideration in this paper, training periods followed by employees were funded by firms in about 86% of cases in 1999 and around three-quarters of the training programs were reported to be at least partially initiated by firms.
Estimating wage returns to training leads to well-known measurement and estimation issues. The main problem concerns the recovery of a causal effect of training on wages net of selectivity bias, since training is very unlikely to be exogenous. It could be that the estimated returns to private-sector training pick up the returns to some unobservable characteristics. Leuven and Oosterbeek (2008) find that the returns to training tend to drop to zero when comparing workers participating in training and workers who wanted to participate in training, but did not do so because of random events. While most of empirical studies focus on the impact of training on wages, very few studies have paid attention to evaluating the training effect on the workers’ mobility.
This is really surprising as firms should have stronger incentives to invest in the training of their employees when the latter have no expectations to quit their current job. From a theoretical viewpoint, note that the impact of training on mobility is not necessarily obvious. Considering the transition from a job to another one, participating in a training program may have two offsetting effects. On the one hand, if there are significant wage returns to training, this should reduce the probability for participants to search for new jobs. On the other hand, trained workers could choose to behave in an opportunistic way by moving to another firm in order to receive a higher paying job with increased responsibilities2.
These two offsetting effects depend crucially on whether the training is general or specific. In this sense and according to the human capital theory (Becker, 1964) which draws a crucial distinction between general and specific skills, the worker’s post training outside
1
For comparative evidence and differences in training practices in Europe, see Bassanini et alii (2007). 2
By definition, firms have strong incentives to hire recently trained workers since they can reap the benefits of the former training programs without supporting the costs of these programs. This refers to the so-called “poaching externality” (Pigou (1912) or more recently Acemoglu (1997)).
option would be considerably reduced if the training is specific3, so that workers with specific skills are not actually in a position to behave in an opportunist way. However, this analysis first rests on the assumption that labour markets are perfectly competitive in which workers receive their marginal product. Due to search frictions (that rise the cost of turnover) or information asymmetries (the training firm is better informed about the training of its employees than outside employers) or else institutions, labour markets are actually imperfect. Training firms have then some monopsony power and are able to capture part of the returns to training, moderating in this way the opportunist behaviours of trained workers and giving them strong incentives to finance general training.
Secondky, most skills may be industry specific but also general because typically there are many firms in the same industry using similar technologies (Acemoglu and Pischke, 1999a). Accordingly, even if skills are specific, trained workers are to some extent in a position to behave in an opportunist way. Recent developments in the training literature focus on all these strategic interactions between employers and employees (Acemoglu and Pischke, 1998, Acemoglu and Pischke, 1999b). Expectations seem more clear-cut when considering transitions from employment to unemployment. The probability to be fired by the firm should be reduced among trained workers, given their increase in skills and the training costs supported by the employer.
While knowing the mobility impact of training programs is of importance for both firm managers and public policy markers, empirical evidence remains scarce in European countries. Ok and Tergeist (2003), Budria and Pereira (2004) and Goux and Maurin (2000) are interesting recent exceptions. These authors focus on different transition probabilities on the labour market and find mixed results. Again, the difficulty is to properly account for endogeneity of the training program and recovering the counterfactual (i.e. what would have been the situation of the participants if they would not have benefited from the training program) is a challenging task.
The purpose of our contribution is to bring additional evidence on the empirical effect of formal training on both employment-unemployment transition and job-to-job transitions, and also on wages using French data. Training expenditures are very important in France. The total amount of expenditures related to initial and continuing vocational training was 25.9 billions of euros in 2005, about 1.5% of GPD. A particular feature of the French funding
3
Specific skills are defined as those which are only useful in the training firm and increase the worker’s productivity only in her current job. In contrast, general skills are also useful with other employers. In fact, in a competitive labour market, firms could never recoup their investments in general skills, so they will never pay for general training.
system for continuing training is the existence of mandatory contributions. All firms have to devote a specific percentage of their total wage bill to train their employees. When this is not the case, they have instead to pay a tax, leading to the so-called ‘pay-or-train’ system4.
To investigate the consequences of training on the labour market mobility, we use two French data sets on continuous training and on labor participation, both gathered by INSEE, covering the period from 1998 to 2000. This allows us to study the consequences of training two years after the program. We find that participation to a training session in 1998 reduces the probability to experience an employment-unemployment transition during the period and that the probability to switch firms is higher for untrained than for trained workers. Finally, we find that participation in training has a significant and positive impact on wages, but the wage premium remains rather flat along the wage distribution.
The remainder of our paper is organized as follows. In the next section, we provide a brief review of European empirical works on the impact of training, with special emphasis on the worker’s mobility. The data used in our study and the corresponding descriptive statistics are presented in Section 3. We estimate the impact of training on mobility using both matching estimators and bivariate Probit models in Section 4, while Section 5 focuses on the wage returns to training. Finally, Section 6 concludes the paper.
2. Literature review on training and mobility
Numerous empirical studies have proposed estimates of the wage returns to training. The main problem concerning the recovery of the causal effect of training on wages lies in the correction for selectivity into training. While many papers have found large returns to formal private sector training, recent studies based on exogenous variation in training participation find much smaller wage effects of training (Leuven, 2004). Conversely, few studies have focused on the training impact on professional mobility.
Using US data from the National Longitudinal Survey of Youth, Lynch (1991) estimates the effect of different types of training among young workers on the probability of leaving an employer. Estimates from Cox proportional hazard with time-varying covariates show that young people who had some formal on-the-job training are less likely to leave their employer, while those who participated in some form of off-the-job training are more likely to
4
In the case of private-sector companies, the contribution amount and the method of calculating it vary according to the size of the company workforce. Mandatory required contributions are equivalent to 1.6% of the total wage bill of companies with a workforce of 20 employees or more The total amount is divided in the following way: i) 0.9% for financing training plans, ii) 0.5% for financing the professionalisation measures and individual training entitlement and iii) 0.20% for financing individual training leave. These contributions are equivalent to 1.05% of the total wage bill of companies with a workforce from 10 to 19 employees, while the contribution of smaller firms (less than 10 employees) is 0.55% of their total wage bill.
leave. Using the same data, Loewenstein and Spletzer (1999) analyze how job-to-job mobility between 1993 and 1994 is influenced by measures of specific and general training in 1993. General training does not influence the probability that a worker changes jobs, while specific training reduces the magnitude of workers’ mobility5.
In Europe, Ok and Tergeist (2003) find that the probability of being unemployed three years after a training session (that took place in 1994) amounts to 4% among trained workers. The same probability among workers with comparable individual characteristics who did not receive training is about twice higher (7.5%). Their analysis is based on data from Austria, Belgium, Denmark, France, Greece, Ireland, Italy, the Netherlands, Portugal and Spain. However, there is no evidence that trained workers are more likely to stay in the firm than their non-trained counterparts.
Dearden et alii (1997) investigate the relationship between mobility and training using data from the British National Child Development Survey with information between 1981 and 1991 and the UK Labor Force Survey. Receiving either work-related or employer-funded training decreases the men’s probability of job switching, while the overall effect of training is not significant among women6. Still with data from the UK, Green and alii (2000) examine the multiple factors that affect the impact of training on mobility, mobility being measured through respondents’ expectations. While training has on average no impact on mobility, training tends to reduce the likelihood of job search when training is paid by firms.
Budria and Pereira (2004, 2007) study the impact of training both on wages and mobility using pooled data from 1998 to 2000 collected in Portugal. They consider training schemes that do not refer to a particular time, so that the training activities may have been completed several years ago. Being trained does not significantly reduce the probability of entering unemployment. However, as pointed out by the authors, these findings have to be interpreted with cautious since very few covariates influence the outcome under consideration. This could be due to the fact that the transition equation is poorly specified.
Finally, in France, previous evidence on mobility and training remains scarce. Using the 1993 survey on Education and Qualifications matched with the Corporate Tax Return database, Goux and Maurin (2000) find that the impact of a training session that took place between 1989 and 1992 on the probability of changing firm between 1989 and 1993 is negative, but of small magnitude and not significantly different from zero. Blasco and alii
5
Using the NLSY data and proportional hazard models, Parent (1999) finds that on-the-job training reduces to a sizeable extent the conditional probability of leaving. However, skills acquired with previous employers are not a significant factor of increased mobility once controlling for unobserved individual heterogeneity.
6
(2008) use the 2003 FQP survey that allows a 60 months follow-up between 1998 and 2003 for each respondent. They focus on the effect of a participation in training spells (either dedicated to employed or unemployed workers) on the employment and unemployment duration distributions. Estimates from a multi-state transition model first show that past participation in training programs increases the conditional probability of return to employment. More surprisingly, they also show that participation in employment training during the previous year (a training period during an employment spell) increases the probability of exiting employment.
Compared to this study, our study gives the impact of a training session not only on the employment-unemployment transition, but also on the job-to-job transition. We also evaluate the impact of training on a longer term since we allow training participation to have an impact up to 24 months after completion. Finally, we provide additional results on the effect of training on wages.
3. Data and descriptive statistics
3.1. The French data
To assess the effect of training on labour market mobility and wages, we use in this study two complementary French databases. The first one is a cross-sectional survey entitled “Formation Continue” conducted by INSEE (the French National Institute for Statistics and Economic Studies) in March 2000. It was carried out on a sample of 28667 individuals. The main interest of this survey is that it includes detailed information on training. In particular, it provides accurate information on the different training periods followed by each respondent along the life cycle. From the questionnaire, it is possible to separate three main periods: i) from exit to school to February 1998, ii) from March 1998 to December 1998, and iii) from January 1999 to March 2000.
The “Formation Continue” survey describes the type of experienced training using four main categories: i) training in a work situation, ii) apprenticeships, iii) work placement or training courses and iv) self-training. We have also information about the purpose of the training activity, which has to fit in one of the following categories: i) to adapt to the job, ii) to switch to another job or to get a job, iii) to obtain a diploma or a certification, iv) to execute political duties, v) personal or cultural reasons, and vi) no specific reason. When turning to the data, we choose to only consider the first motive since it was the result of 76% of the training
sessions taken by employees in 19987. More precisely, 64% among them have participated to a training program in order to adapt to their job as a result of a change in the content of their work. This reflects the fact that new technologies and organizations require continuing learning. In so doing, we only account for work-related training which is expected to have some influence on the labour market situation of the respondents. Furthermore, we decide to only consider firm-financed training, which was the case of 86% of the employees having participated in a training program in 19988. Finally, we also know that 86% of the training sessions taken by employees in 1998 did not to lead to any recognized certification. This fact corroborates a theoretical point previously mentioned about asymmetric information. The monopsony power of the current employer is more important when the training content is not obvious for the market. Certifications could have decreased this uncertainty.
Keeping those facts in mind, it must be well understood that the predominance of a sort of training in the data does not allow us to provide the econometric estimation for different categories of training. Of course, the motive ‘to obtain a job’ is likely to contain more general training than ‘to adapt to her job’, but again, due to the small number of observations for other motives than ‘to adapt to her job’, we were not able to differentiate the training between specific or general.
We merge these data with the “Emploi” survey conducted over the 1998-2000 period. This is a rotating panel since exactly one-third of the sample is dropped from the sample each year and is replaced with a new, comparable sample drawn from the current population. The size of the “Emploi” survey is about 135000 individuals who are interviewed about their situation on the labour market. The main feature of these data is that they provide detailed information over three-years for one-third of the 1998 original sample. This means that we can investigate the effect of formal training received in 1998 both in terms of labour market mobility and wages two years after the program.
For each employee, the “Emploi” survey provides detailed individual characteristics including gender, age, marital status, citizenship, level of education, place of residence, years spent in the firm, type of job contract, number of worked hours, occupation and sector of activity among other covariates. In what follows, we focus on the two following variables of interest. The first one is about mobility on the labour market. We define two dummy variables
7
Concerning the other motives, 2.1% of the employment training sessions were followed in order to switch to another job (or to get a job), 4.8% in order to obtain a diploma, 0.5% in order to execute political duties, and 7.3% for personal or cultural reasons. Finally, 8.1% of training spells were followed without specific reasons. 8
Concerning the other participations in training, 7% of them have been financed by workers themselves, 2% by regions, 2.5% by the State, 1% by suppliers, 1% by associations, 1% by the institution that manages the funds for training leaves and 0.5% by other sources.
respectively associated to transition from employment to unemployment and to job-to-job transition. The second outcome is the monthly wage level, expressed in euros. Another important question is about the type of sector, either private or public. In our empirical analysis, we only focus on the former case since wages are essentially fixed by the French legislation in the public sector. As a consequence, they are not necessarily responding to productivity reasons. Furthermore, mobility is very infrequent in the public sector.
We define our sample in the following way. First, we focus on the population of respondents who were working in March 1998 and consider their participation to a training spell between March 1998 and December 1998. They have thus to remain employed during this period. We get information on the various training periods that they have experienced (if any) during ten months and on their professional mobility and wages during the two following years (from March 1998 to March 2000). Secondly, we choose to select the subsample of workers aged from 18 and 60 and exclude farmers and self-employed. As part-time is not infrequent in France, we decide to account for both full-time and part-time jobs. Thirdly, we delete the few observations with missing values, mainly because of missing wages. These different selections leave us with a ‘restricted’ sample comprising 5107 observations. This sample has the main advantage to allow a higher standpoint to evaluate the impact of training.
However, considering a labour market outcome two years after a training program may set some problems. In particular, it could be argued that either mobility between 1998 and 2000 or wages in 2000 are likely to be influenced by training periods experienced after 1998 by the respondent. For instance, if we observe a case of job mobility between 1998 and 2000 for a person who has no training period in 1998, we cannot rule out the possibility that the job mobility is linked to training received in 1999 or even in the early months of 2000. So, for the sake of robustness and to avoid misleading conclusions, we construct another sample where individuals have a job during all the period and construct a training variable which is equal to one when the work has benefited from training at least once during the 1998-2000 period. This ‘extended’ sample includes 4761 workers9.
3.2. Descriptive statistics
When considering participation in a training program from April 1998 to December 1998 (our ‘restricted’ sample), we find that 762 individuals have benefited from such training experience. The participation rate is hence 15.0% (762/5107). According to the French data, the mean duration of the training period is 41.4 hours. Furthermore, nearly 28% of these
9
Note that the size of this ‘extended’ sample is lower than that of the ‘restricted’ sample since we only focus on individuals who had a job during the whole period.
training experiences are reported to be in a work situation. We also find that the training spells in a work situation are significantly longer than that of the other types of training. The mean duration is about 52.1 hours for the former, but only 37.2 hours for the latter. As expected, we find a much higher proportion of workers having benefited from a training period when we extend the possibility of participating in such program during the period covering April 1998 to March 2000. The proportion of trained workers is about twice higher within the ‘extended’ sample, 32.4% (1541/4761) instead of 16%. Interestingly, we find that a significant proportion of the respondents have participated more than once in the training programs over the period. Among the 1541 recipients, 48.3% of them have benefited from training activities both in 1998 (from March to December) and in 1999-200010. It thus matters to account for the fact that workers may have benefited from several training periods.
Our main outcome of interest is related to mobility on the labour market. As shown in Table 1, the probability of observing a transition following the training period is somewhat low. The proportions of workers reporting either job-to-job transition or employment to unemployment mobility are respectively equal to 7.1% and 3.3% in the restricted sample. Interestingly, there are large differences depending on whether workers have participated in training activities in 1998 or not. Both rates of mobility are much lower among trained workers, respectively 3.7% instead of 7.7% for job-to-job transition (a decrease of 51.9%) and 1.1% instead of 3.7% for employment-to-unemployment transition (a decrease of 70.3%)11.
Insert Table 1 here
While the differences in labour mobility that we observe from the data may be a consequence of the training program, they are presumably strongly affected by the non-random participation in training activities. The characteristics of the untrained and trained workers reported in Table 1 show that it is important to account for selectivity when assessing the consequences of participation in training. On average, the proportion of male workers involved in training activities is slightly higher than that of female workers (59.3% instead of 40.7%). Participation is more frequently observed among middle-aged workers (from 30 to 49 years old) and among workers having spent more than 10 years in their firm.
There are also substantial differences depending on education. The proportion of low-educated respondents (no diploma or BEPC) is for instance equal to 38.6% among untrained
10
The proportions of trained workers who have benefited from only one training period is respectively 19.7% in 1999 and 31.9 in the 1999-2000 period.
11
The figures associated to job-to-job mobility are very similar when considering the extended sample, although there are fewer differences between untrained workers and trained workers when considering job-to-job transitions. Since we account for the possibility of training periods over the whole period, then some workers may have participated in training activities in their new location, i.e. after the job-to-job mobility.
workers, while it is 18.5% among trained workers. Conversely, more than 32% of the participants are high-educated (undergraduate, graduate, postgraduate studies) instead of 13.2% among non-participants. Job characteristics also matter, since the participation in training activities is more frequent among permanent contracts, full-time workers, executives and intermediary professions, and among workers in large firms (more than 500 em ees)12.
To summarize, these descriptive statistics show that the propensity to participate in training activities is more important among workers endowed with high earnings generating characteristics. It thus matters to account for this positive sele
ploy
ction into training since it is kely to bias the effect of training on both mobility and wages.
4. The
, e turn to a bivariate Probit model to solve the endogeneity problem of the training variable.
of li
effect of training on mobility
To address the selectivity issue, we rely on two different methods. As the participation in the training program is expected to be a function of both observable and unobservable characteristics of each worker (like a high degree of productivity or commitment), we ideally need to rely on an instrumental variable strategy. The difficulty here is to find a variable that would be strongly correlated to participation in training, but not with labour market outcomes (either mobility or wages). Given the lack of appropriate instruments in the French data, we decide to first apply matching estimators that only control for observed heterogeneity. Then w
4.1. A propensity score matching analysis of mobility
As a preliminary approach, we assume that participation in the training program is only influenced by individual characteristics which are observed from the data. This allows us to rely on matching estimators (see Heckman et alii, 1998). This method consists in building a control group of non-treated individuals whose characteristics are very similar to those of individuals of the treatment group (i.e. trained workers), and then in comparing the outcomes of the two groups. Differences in outcomes of treated and non-treated workers are attributed to the training program. The matching estimator controls for the selection bias at the entry programs since it mimics random assignment through the construction of a control group.
Let us briefly describe the evaluation methodology. We denote by T the treatment variable which is equal to 1 when the individual has participated in a training program and to 0 otherwise. Let X be a vector of observed individual characteristics and Y be the outcome
12
Among participants, 14.2% of them are working in firms with less than 20 employees and 46.9% in firms with more than 500 employees. The same figures are respectively 36.5% and 23.5% among non-participants.
under consideration, either job-to-job mobility or employm t-unemployment transition in our case: Y refers to the outcome of trained workers, while 1 Y is the outcome of non-trained 0
e focus on the average treatment effect on the treated, defined by en
s, w workers. In what follow
) 1 ( ) 1 ( 1 = − 0 = =
Δ E Y T E Y T . By definition, the outcome of non-treatment for treated workers is never observed from the data.
To estimate the counterfactual E(Y0T =1), the key assumption when considering matching estimators is that both the treated and untreated groups have to be comparable conditionally on observed characteristics X . Once the conditional independence assumption is satisfied, then the counterfactual is E(Y0T =1)=E(Y0T =0). Following Rosenbaum and Rubin (1983), we match treated and untreated workers on the basis of their propensity score. We proceed in the following way. First, we calculate for each worker the propensity score from a Probit regression explaining the probability to participate in training. The set of covariates is chosen in order to satisfy the conditional independence assumption. Then, we select the common support of the densities of the two groups. Finally, we estimate the causal effect o
geneity related to the worker effort and motivation
mobility when focusing on job transitions, while respondents concerned with
f the training program using a Kernel matching estimator (Heckman et alii, 1998)13. Let us first consider selection into training. To calculate the propensity score for each worker, we regress the training participation on a set of socio-economic characteristics. The different covariates introduced into the regression are gender, age, marital status (in couple versus alone), education, nationality, part-time job, temporary contract, whether the worker holds a second activity, occupational dummies, dummies for tenure, dummies for firm size, and sectoral and regional dummies. Finally, we choose to include in the Probit regression the wage level observed in March 1998, i.e. before the training spell starts. This covariate is of course expected to be highly (positively) correlated with the training assignment, but it also could pick up part of the unobserved hetero
prior to the participation in the program14.
The results of the propensity score matching analysis are described in Table 2. Let us first focus on the Probit estimates of the training participation equation. We estimate separate regressions for the job-to job and employment-unemployment transitions as our control group is always made of immobile workers. We exclude the cases of employment-unemployment
13
This method uses weighted averages of all individuals in the control group to construct the counterfactual outcome. Weights depend on the distance between each individual from the control group and the participant for which the counterfactual is estimated.
14
We are indebted to Daron Acemoglu for this suggestion. Additional results (not reported) show that very similar results are found when estimating the participation regression without the prior-training wage.
job transitions are excluded when investigating the employment to unemployment transitions. This leaves us with two samples comprising respectively 4940 and 4743 observations.
Insert Table 2 here
According to the French data, there are no gender differences in participation. Training activities are less frequent among older workers (above 50 years old) and among workers of foreign origin. Those who live in couple are less likely to receive training, but this effect is only significant when the focus is on mobility from employment to unemployment. As expected, we find a positive effect of the different educational dummies on the probability of having been trained in 1998. Training is much more likely among high educated workers, although there is no significant difference between under-graduated and graduated workers. Finally, the participation in a training program is more frequent among intermediary occupations and among employees.
Participation in training is not affected by job seniority, having a temporary contract, working full-time or having a secondary activity. The only characteristic of the job that influences the probability of training is the size of the firm. There is a positive correlation between training activities and firm’s size, and participation is much more likely when workers operate in large firms (more than 500 employees). The last finding is the positive effect of the wage level (prior to the training period) in the training equation. It is of course more profitable for firms to invest in their more able and more productive employees.
Panel B of Table 2 includes the results of the propensity score analysis for the two transitions. Let us first focus on the case of job-to-job mobility. Under the exogeneity assumption of participation in training (unmatched estimate), we find a difference of -3.7% for the mobility rate between the treated and the control groups. Once selection into training is taken into account of the basis of observable individual characteristics, we get a lower value for the difference in mobility. The causal effect is now equal to -2.9%, but still statistically significant. Very similar findings hold for the employment-unemployment mobility. While the unmatched difference is equal to -2.8%, we get a value of -1.8% for the average effect of the treatment on the treated which is significant at the 1 percent level.
So, a first conclusion drawn from the French data is that transitions both from one job to another job and from employment to unemployment are less likely among trained workers. While this pattern holds after controlling for selection into training, a shortcoming of the matching estimators is that they only account for observable characteristics to tackle the selectivity issue.
4.2. A bivariate Probit specification
Although the two French databases include detailed individual characteristics, the possibility that participation in training is related to less visible factors like motivation or ability can definitely not be ruled out. Also, as we do not have matched employer-employee data, the role of the firm characteristics will not be adequately controlled for in our regression. Unfortunately, there is no good reliable instrument in our data, so that we are not able to turn to an IV analysis. However, since both the treatment variable and the labor market transition (either from job-to-job or from employment to unemployment) are binary, we are able to take the endogeneity problem into account using a recursive, simultaneous equations model.
Let us describe the corresponding framework. A first equation indicates the probability for an individual to participate in training. Denoting by T the latent variable associated to *
the training decision (it can be either negative or positive), the training equation will be explained by a set of exogenous worker’s characteristics XT in the following way:
T T T X
T*= β +ε (1)
where βT is a vector of parameters to estimate and εT is a random perturbation (normally distributed). Now, let M be a latent variable associated to mobility on the labour market. A *
second equation indicates that mobility depends on a set of exogenous covariates and on the participation into the training program
M X T: M T M M T X M*= β +δ +ε (2)
where βM is the vector of associated parameters, δT measures the impact of the training decision on mobility, and εM is an error term. While the latent variables M and * T are not *
observed, we have some information on their observed counterpart since we know that M =1
when * >0 (and
M M =0 otherwise) and T =1 when *>0 (and
T T =0 otherwise).
Under the assumption that the two residuals εT and εM follow a bivariate normal distribution such that (εT,εM)~ N(0,0,1,1,ρ), with ρ the coefficient of correlation between
T
ε and εM , equations (1) and (2) define a recursive simultaneous model which comprises two Probit equations. This bivariate Probit model can easily be estimated by full information maximum likelihood. As shown in Greene (1998), the simultaneity problem does not matter when the two dependent variables are jointly determined in the bivariate Probit specification.
A central problem when estimating such simultaneous models concerns identification. While it is often argued that exclusion restrictions are needed to identify such models15, Wilde (2000) has shown that this condition was not necessary in the context of a two equations Probit model with one endogenous dummy regressor. Each single equation has just to include at least one varying exogenous variable in the list of covariates. Nevertheless, in that case, it should be noted that the bivariate Probit model is only weakly identified through the non-linear distribution of the two residuals, while strong identification requires inclusion of additional explanatory factors in the training participation equation.
When turning to the data, we proceed in the following way to secure identification. On the one hand, we introduce into the training equation the different covariates reported in Table 2 and add a dummy variable which is equal to one when there is a company training plan. This variable is expected to be positively correlated with participation in training at the individual level, while it should have no influence on the employment transitions. On the other hand, we introduce into the mobility equation both individual and job characteristics (except sectoral dummies)16. We also control for the number of young children living in the household and for the wage level prior to the training program (if any), as individuals receiving high wages may be less tempted to quit their current job.
We report in Table 3 the bivariate Probit estimates respectively for job-to-job mobility and for transition from employment to unemployment. Before turning to the impact of training on mobility, a few comments are in order. First, with respect to the previous estimates of Table 2, we find that the probability to participate in a training program is significantly increased among workers in firms with a training plan. Secondly, there are differences in the determinants of the two types of mobility.
Insert Table 3 here
When considering the case of unemployment, only seniority and the type of contract have a significant influence. Occurrence of unemployment is much higher among workers who have spent less than 10 years in their firm and among those who have a temporary contract. A similar pattern holds for seniority and type of contract when explaining job-to-job mobility. Women and older workers are also less likely to experience such mobility, which is conversely more likely among executives. This is not really surprising as executives may benefit from higher wage opportunities when changing firm.
15
This is indeed the case with a standard IV specification where the dependent variable of the recursive model is continuous instead of binary.
16
We choose to exclude the sectoral dummies as there are very few transitions for some sectors. This exclusion does not affect our empirical results.
Let us now asses the role of training participation. As shown in Table 3, we find a negative coefficient for the endogenous participation dummy both for job-to-job and employment-unemployment transitions. However, the coefficient associated to training is only significant when considering job-to-job transitions, whilst it is not significant at any conventional level for changes in the employment status. With respect to the matching estimators, the difference could be due to the fact that we now control for unobserved heterogeneity when using the bivariate Probit specification. However, it should also be kept in mind that the number of respondents facing mobility from employment to unemployment remains low, which could (at least partly) explain the lack of significance of the training dummy in the mobility equation.
Finally, we assess the magnitude of the causal effect of training on the job-to-job transition using the bivariate estimates. In this setting, the average treatment on the treated Δ is Δ=Pr(M =1T =1)−Pr(M =1T =0). It is then straightforward to calculate these two conditional probabilities, given by Pr(M =1T =1)=Φ2(XMβM +δT,XTβT,ρ)/Φ(XTβT) and
) ( / ) , , ( ) 0 1
Pr(M = T = =Φ2 XMβM −XTβT −ρ Φ −XTβT by definition of the bivariate Probit model. When calculating on the subsample of trained workers, we find a value of -1.1% for the training effect on job-to-job transition and of -2% on mobility to unemployment which are not so different from our previous matching results (respectively -2.9% and -1.8%)
Δ
17
.
5. Additional results on wages
The data also allow us to investigate the wage effect of training. According to the human capital theory, training increases worker’s productivity. Accordingly, if training is mainly specific, wages growth would only depend on the productivity growth and the mobility between jobs would be small. In contrast, if training is mainly general, worker’s outside options increase (as productivity has increased), leading either to a wage increase in the same firm and no mobility or a wage increase in another firm and a switch to another firm. Nevertheless, according to the new literature on training of Acemoglu and Pischke (1999b), wage growth could be small even in case of general training due to the monopsony power of the training firm : the marginal increase in the worker’s productivity is not fully reflected in the best market opportunity due to market imperfections. As suggested, wage growth may be influenced by job mobility. Consequently, we restrict our attention to the
17
When considering the bivariate Probit coefficients, we find that the average treatment on the treated is respectively given by 6.62-7.72=-1.1% in the case of job-to-job transition, while it is 1.8-3.77=-1.97% in the case of employment-unemployment mobility.
subsample of workers not concerned by mobility during the two years following training participation. Given the lack of suitable instruments to control for unobserved heterogeneity, we focus in what follows on matching estimators to assess the wage effect of participation to a training program in 1998.
We begin with a brief description of the pattern of wages of respectively trained and untrained workers. As shown in Table 4, there are large differences in the mean wage between the two groups. On average, respondents who have participated in a training program benefit from earnings which are 31.8% higher in 2000 than those of the untrained workers. Although the wage gap is large, part of the difference is expected to stem from differences in individual characteristics between untrained and trained workers. A disaggregated analysis by gender further indicates that the wage gap due to training is much lower among men than among women, respectively 24.4% instead of 39.8%. This difference may be linked to the selectivity of women into both the labor market and training activities.
Insert Table 4 here
When evaluating the returns to training participation, we again rely on a propensity score analysis and on Kernel matching estimators. We introduce in the selection equation the list of covariates considered in the mobility analysis (gender, age, marital status, education, nationality, part-time job, temporary contract, secondary activity, occupation, tenure, firm size, sector, region). As the training decision is likely to be influenced by unobservable characteristics as well, we also include former training participation (before March 1998) as a proxy for the general attitude of individuals towards training. We estimate two different set of regressions, one with the wage level in 1998 and one without18. A lower matched difference is expected in the former case since the wage level before training should pick up part of the unobserved heterogeneity such as motivation. Results from the matching estimates are in Table 4. Several comments are in order.
First, we find a much lower value for the wage effect once selection into training is controlled for (on the basis of observable characteristics). The average effect of the treatment on the treated is equal to 6.7% when the wage level in 1998 is introduced in the participation equation (Row 1). By comparison, the unmatched difference was more than four times higher (31.8%). Secondly, as expected, we find a much large matched difference when the wage level before the training program is not included in the participation equation (10.7% instead of 6.7%). Since the wage level in 1998 is correlated with unobserved characteristics of the worker before participation in the program (like motivation or ability), then the returns to
18
We do not report the Probit estimates explaining participation into training since our results are very similar to those described in section 2.
training will be overestimated once the unobserved factors are partially controlled for. Thirdly, we evidence higher returns to training among women (7.4%) than among men (5.8%)19. These results suggest that training participation leads to a higher productivity for non-job switchers, suggesting that the training is mainly general. Nevertheless, the small number of workers who have switch a job after training completion does not allow us to have a lot to say about the monopsony power of training firms.
As recent studies in program evaluation have suggested that it matters to learn not only about the average treatment effect but also on the tails of the outcome distribution, we turn to a quantile regression framework (Koenker and Bassett, 1978). Conditional mean regressions (OLS regressions), which indicate the mean effect of the impact of a covariate, fail to describe its distributional impact. However, as suggested in Chernozhukov and Hansen (2005), the effect of training activities on the low tail of the wage distribution may be of more interest for public policy makers than the effect of participation on the mean of the wage distribution. Their estimates from instrumental variable quantile regressions show that in the US, the percentage impact of the training program on earning is quite stable along the distribution.
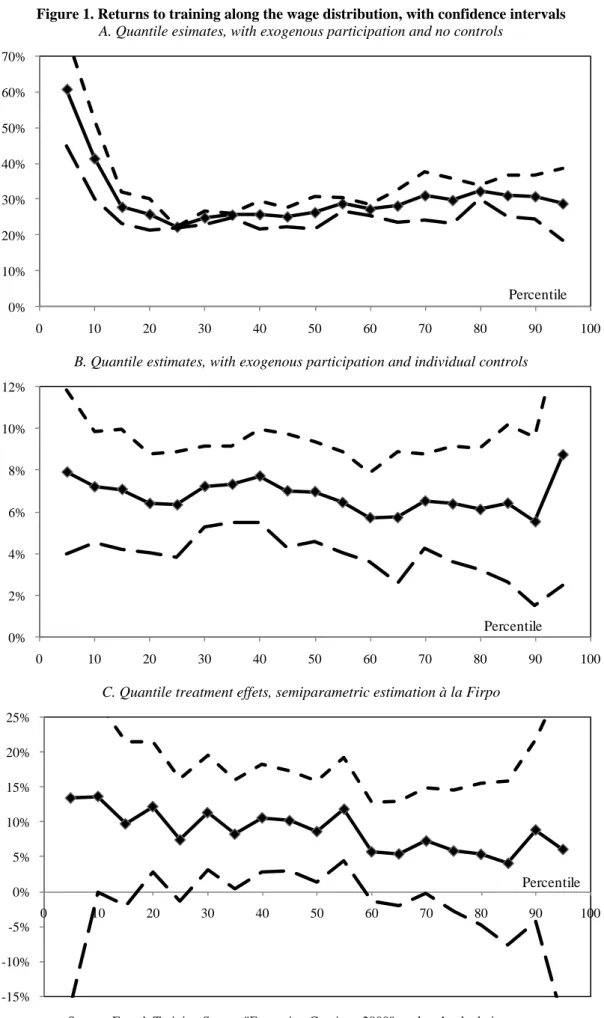
Let us begin with a descriptive analysis of the wage gap between trained and untrained workers along the earnings distribution. As shown in Panel A of Figure 1, we find a large percentage increase in wages in the low earnings quantiles, which declines as one moves to the upper quantiles of the distribution. Above the 20th percentile, the difference in earnings remains rather flat and is comprised between 25 and 30 percent. Then, we add a set of individual characteristics in the quantile regressions. As expected, we now find a much lower earnings difference between non-participants and participants. According to Panel B of Figure 1, the gap varies between 6% and 8% along the earnings distribution and is fairly flat20. Nevertheless, the moderate positive and significant effect of training on earnings quantiles does not account for the endogeneity of training status.
Insert Figure 1 here
Since there is no relevant instrument in the data to control for the selection into the treatment, we again assume that selection to treatment is exclusively based on observables (the unconfoundness assumption) and rely on the efficient semiparametric estimator recently proposed by Firpo (2007). Estimation of quantile treatment effects is implemented using a two-step procedure, with first a non-parametric estimation of the propensity score and then a
19
As shown in Table 4, we get a larger gap on the basis of the matched estimators when the wage level in 1998 is excluded from the regression, the matched returns being respectively equal to 8.8% among men and 13.0% among women.
20
computation of the difference between quantiles for the treated and for the control individuals. The corresponding estimates are in Panel C of Figure 1. Two comments are in order.
On the one hand, with respect to the previous quantile estimates with exogenous participation, we now find slightly higher values for the training benefits, at least in the first part of the distribution. The wage gap between non-participants and participants, which is for instance equal to 14% at the 10th percentile, then declines when moving to the upper quantiles. Above the 60th percentiles, the percentage impact of the training program varies between 5 and 7 percent. On the other hand, it is also clear that the quantile treatment effects parameters are most often imprecisely estimated. The training benefits are not significantly different from zero both in the lower part (till the 20th percentile) and in the upper part (above the 60th percentile) of the earnings distribution.
6. Conclusion
In this paper, we have focused on the consequences of training participation on labor market mobility using French data collected between 1998 and 2000. Considering both job-to-job mobility and transition from employment to unemployment, our estimates show that the participation in a training program in 1998 reduces the probability either to switch job or to become unemployed during the two succeeding years. The magnitude of mobility, which is somewhat low (around 7% from job-to-job and 3% from employment to unemployment), is divided by about two once endogeneity of the training participation is taken into account. Interestingly, our estimates from both matching estimators and bivariate Probit models lead to very similar results, although the negative training impact on the employment-unemployment transition is no longer significant with the second specification.
We also provide additional results on the wage returns to training (participation in 2008). On the basis of a correction of selection on observables, we find a value of 7% for these returns. Quantile matching estimators suggest that the returns to training remain rather flat along the wage distribution. As they stand, the wage effects have to be interpreted as a upper bound since the matching estimates are likely to be biased because of unobserved heterogeneity. The difficulty here is that the data do not provide any convincing instrument. A correction for selectivity into training on unobservable characteristics could clearly lead to smaller wage effects of the participation in training programs.
Finally, several extensions of our empirical analysis could be considered. First, it would be worthwhile to consider the impact of training on a longer period of time. For instance, the marginal protective effect of training may be more important among older than
younger workers. Secondly, the impact of training on labour mobility may be affected by both the type and the total duration of the training program. Finally, the characteristics of the firms and the way employers select their employees who benefit from the training program are also expected to influence job-to-job and employment-unemployment transitions. The use of longitudinal matched employer-employee data could shed light on these issues which are left for future work.
References
Acemoglu D., (1997), “Training and innovation in an imperfect labor market”, Review of
Economic Studies, vol. 64, pp. 445-464.
Acemoglu D., Pischke J., (1998), “Why do firms train? Theory and evidence”, Quaterly
Journal of Economics, vol. 113, pp. 79-119.
Acemoglu D., Pischke J., (1999a), “Beyond Becker: training in imperfect labor markets”,
Economic Journal Features, vol. 109, pp. F112-F142.
Acemoglu D., Pischke J., (1999b), “The structure of wages and investment in general training”, Journal of Political Economy, vol. 107, pp. 539-572.
Bassanini A., Booth A., Brunello G., De Paola M., Leuven E., (2007), “Workplace training in Europe”, in Brunello G., Garibaldi P., Wasmer E., (eds), Education and Training in
Europe: A report for the Fondazione Rodolfo Debenedetti, Oxford, Oxford University
Press.
Blasco S., Crépon B., Kamionka T., (2008), “Evaluation of the impact of training on individual labor market transitions”, mimeo, CREST.
Budría S., Pereira P.T., (2004), “On the returns to training in Portugal”, IZA Document Paper, n° 1429.
Budría S., Pereira P.T., (2007), “The wage effects of taining in Portugal: Differences across skill groups, genders, sectors, and training types”, Applied Economics, vol. 39, pp. 787-807.
Chernozhukov V., Hansen C., (2005), “An IV model of quantile treatment effects”,
Econometrica, vol. 73, pp. 245-261.
Dearden L. and Machin S. and Reed H. and Wilkinson D., (1997), “Labour turnover and work-related training”, Institute for Fiscal Studies.
Firpo S., (2007), “Efficient semiparametric estimation of quantile treatment effects”,
Econometrica, vol. 75, pp. 259-276.
Goux D., Maurin E., (2000), “Returns to firm-provided training : evidence from French worker-firm matched data”, Labour Economics, vol. 7, pp. 1-19.
Green F., Felstead A., Mayhew K., Pack A., (2000), “The impact of training on labour mobility: individual and firm-level evidence from Britain”, British Journal of
Industrial Relations, vol. 38, pp. 261-275.
Greene W.H., (1998), “Gender economics courses in liberal arts colleges: further results”,
Journal of Economic Education, vol. 29, pp. 291-300.
Heckman J., Ichimura H., Todd P., (1998), “Matching as an econometric evaluation estimator”, Review of Economic Studies, vol. 65, pp. 261-294.
Koenker R.W., Bassett G., (1978), “Regression quantiles”, Econometrica, vol. 46, pp. 33-50. Leuven E., (2004), “A review of the wage returns to private sector training”, Joint EC-OECD
Seminar on human capital and labor market performance, held in Brussels on
December 8, 2004.
Leuven E., Oosterbeek H., (2008), “An alternative approach to estimate the wage returns to private-sector training”, Journal of Applied Econometrics, vol. 23, pp. 423-434.
Loewenstein M.A., Spletzer J.R., (1999), “General and specific training: evidence and implications”, Journal of Human Ressources, vol. 34, pp. 710-733.
Lynch L., (1991), “The role of off-the-job training vs. On-the-job training for the mobility of women workers”, American Economic Review, vol. 81, pp. 151-156.
Parent D., (1999), “Wages and mobility: the impact of employer-provided training”, Journal
of Labor Economics, vol. 17, pp. 298-317.
Ok W., Tergeist P., (2003), “Improving workers’ skills: anatycal evidence and the role of the social partners”, mimeo, ECD Social Employment and Migration Working Papers n° 10.
Pigou A.C., (1912), “Wealth and welfare”, London: Macmillan.
Rosenbaum P., Rubin D., (1983), “The central role of the propensity score in observational studies for causal effects”, Biometrika, vol. 70, pp. 41-55.
Wilde J., (2000), “Identification of multiple equation Probit models with endogenous dummy regressors”, Economic Letters, vol. 69, pp. 309-312.
Table 1. Description of the sample Restricted sample, with training in 1998
Extended sample, with training from 1998 to 2000 Variables
No
training Training All No
training Training All
Outcomes
Mean wage in 2000 (log) 6.997 7.321 7.046 6.969 7.261 7.058 Percentile 10th 6.462 6.899 6.531 6.413 6.819 6.574
25th 6.819 7.042 6.819 6.785 7.001 6.835 50th 7.001 7.279 7.042 6.973 7.224 7.041 75th 7.246 7.553 7.329 7.224 7.512 7.329 90th 7.553 7.860 7.607 7.512 7.799 7.629 Mobility From job-to-job 0.077 0.037 0.071 0.077 0.061 0.072
From employment to unempl. 0.037 0.011 0.033 - - -
Explanatory variables Gender Male 0.565 0.593 0.569 0.568 0.585 0.573 Female 0.435 0.407 0.431 0.432 0.415 0.427 In couple No 0.337 0.357 0.340 0.328 0.344 0.333 Yes 0.663 0.643 0.660 0.672 0.656 0.667 Age 18-29 0.144 0.135 0.143 0.134 0.142 0.136 30-39 0.341 0.369 0.345 0.334 0.372 0.346 40-49 0.332 0.367 0.337 0.337 0.351 0.342 ≥ 50 0.183 0.131 0.175 0.195 0.135 0.176 Job seniority ≤ 5 0.369 0.276 0.355 0.354 0.296 0.336 6-10 0.219 0.232 0.222 0.218 0.240 0.225 11-20 0.235 0.268 0.239 0.245 0.254 0.248 ≥ 20 0.177 0.224 0.184 0.183 0.210 0.191 Education No diploma – BEPC 0.386 0.185 0.356 0.410 0.227 0.354 CAP-BEP 0.376 0.327 0.369 0.385 0.341 0.372 Baccalaureate 0.106 0.167 0.115 0.092 0.165 0.114 Undergraduate 0.086 0.193 0.102 0.072 0.166 0.102 Graduate, postgraduate 0.046 0.128 0.058 0.040 0.101 0.058 Nationality French 0.935 0.982 0.942 0.931 0.974 0.944 Others 0.065 0.018 0.058 0.069 0.026 0.056 Contract Permanent 0.950 0.970 0.953 0.967 0.967 0.967 Temporary 0.050 0.030 0.047 0.033 0.033 0.033 Type of job Full time 0.841 0.904 0.851 0.838 0.891 0.855 Part-time 0.159 0.096 0.149 0.161 0.109 0.145 Occupation Executives 0.073 0.188 0.090 0.063 0.164 0.093 Intermediary 0.163 0.327 0.188 0.149 0.280 0.189 Employees 0.280 0.236 0.273 0.274 0.265 0.272 Workers 0.484 0.249 0.449 0.514 0.291 0.446 Firm size 0-19 employees 0.362 0.142 0.328 0.389 0.183 0.326 20-99 employees 0.210 0.172 0.205 0.207 0.203 0.206 100-499 employees 0.193 0.218 0.197 0.186 0.224 0.197 ≥ 500 employees 0.235 0.468 0.270 0.215 0.390 0.271 Number of observations 4345 762 5107 3308 1452 4761
Table 2. Propensity score matching analysis on mobility
A. Selection into training - Probit estimates
Variables Job-to-job mobility Employment – unemployment mobility Constant -4.918*** (8.76) -5.238*** (8.88) Female -0.058 (0.94) -0.042 (0.67) Age 30-39 -0.051 (0.60) -0.069 (0.79) (ref: 18-29) 40-49 -0.093 (1.00) -0.111 (1.18) ≥ 50 -0.367*** (3.34) -0.409*** (3.66) In couple -0.084 (1.59) -0.109** (2.01) No French citizenship -0.329** (2.27) -0.332** (2.21) Education CAP-BEP 0.193*** (3.05) 0.206*** (3.22) (ref: no diploma) Baccalaureate 0.329*** (3.82) 0.358*** (4.13) Undergraduate 0.424*** (4.59) 0.437*** (4.65) Graduate, postgraduate 0.485*** (4.04) 0.429*** (3.46) Occupation Executives 0.195* (1.73) 0.204* (1.76) (ref: Workers) Intermediary 0.357*** (4.72) 0.334*** (4.35) Employees 0.194** (2.49) 0.194** (2.46) Job seniority 6-10 0.121 (1.72) 0.098 (1.35) (ref: ≤ 5) 11-20 0.064 (0.87) 0.055 (0.73) ≥ 20 0.144 (1.66) 0.119 (1.35) Permanent contract 0.075 (0.51) -0.017 (0.11) Part-time job -0.102 (1.11) -0.094 (1.01) Firm size 20-99 employees 0.319*** (4.24) 0.323*** (4.16) (Ref: 0-19) 100-499 employees 0.526*** (6.98) 0.533*** (6.91) ≥ 500 employees 0.735*** (10.62) 0.758*** (10.69) Secondary activity -0.209 (1.27) -0.198 (1.19) Log wage in 1998 0.499*** (6.02) 0.539*** (6.27) Number of observations 4940 4743 Log likelihood -1793.6 -1731.6
B. The effect of training on mobility
Mobility Treated Controls Difference
Job-to-job mobility
Unmatched effect 0.037 0.080 -0.043*** (4.18) Causal effect 0.037 0.066 -0.029** (3.10) Employment – unemployment mobility
Unmatched effect 0.011 0.039 -0.028*** (3.89) Causal effect 0.011 0.029 -0.018*** (3.10) Source: French Training Survey "Formation Continue 2000", authors’ calculations.
Note: Estimates of the training selection are from Probit models. The training equations also include a set of sectoral dummies and regional dummies. Absolute value of t statistics are in parentheses, significance levels being respectively 1% (***), 5% (**) and 10% (*).
Table 3. Bivariate Probit estimates of the effect of training on mobility
Job-to-job transition Employment – unemployment transition Variables
Training Mobility Training Mobility Constant -4.453*** (7.77) -0.042 (0.06) -5.029*** (8.52) -0.754 (0.91) Female -0.071 (1.16) -0.291*** (3.58) -0.046 (0.72) -0.036 (0.34) Age 30-39 -0.030 (0.36) 0.000 (0.00) -0.043 (0.49) 0.061 (0.51) (ref: 18-29) 40-49 -0.058 (0.63) -0.199** (2.16) -0.080 (0.84) 0.111 (0.83) ≥ 50 -0.330*** (2.99) -0.499*** (4.13) -0.384*** (3.40) -0.122 (0.73) In couple -0.097* (1.84) 0.011 (0.17) -0.111** (2.05) -0.056 (0.58) Number of children less than 6 0.069 (1.41) -0.094 (1.08) No French citizenship -0.282** (1.96) -0.114 (0.97) -0.303** (1.99) 0.030 (0.19) Education CAP-BEP 0.172*** (2.71) 0.008 (0.11) 0.194*** (2.98) -0.023 (0.22) (ref: no diploma) Baccalaureate 0.317*** (3.68) 0.033 (0.29) 0.345*** (3.94) 0.185 (1.27) Undergraduate 0.396*** (4.27) 0.097 (0.78) 0.414*** (4.37) -0.135 (0.74) Graduate, postgraduate 0.463*** (3.86) 0.236 (1.51) 0.409*** (3.28) -0.012 (0.05) Occupation Executives 0.210* (1.85) 0.369*** (2.62) 0.181 (1.56) -0.041 (0.17) (ref: Workers) Intermediary 0.344*** (4.53) 0.152 (1.30) 0.314*** (4.05) 0.109 (0.75) Employees 0.218*** (2.77) 0.141 (0.15) 0.193** (2.42) -0.029 (0.24) Job seniority 6-10 0.087 (1.22) -0.438*** (4.56) 0.072 (0.98) -0.381*** (3.46) (ref: ≤ 5) 11-20 0.018 (0.24) -0.722*** (5.55) 0.013 (0.17) -1.016*** (5.54) ≥ 20 0.072 (0.83) -0.699*** (4.39) 0.061 (0.68) -0.999*** (4.55) Temporary contract 0.053 (0.37) 0.646*** (5.58) 0.010 (0.07) 1.497*** (12.73) Part-time job -0.083 (0.90) -0.069 (0.66) -0.079 (0.84) -0.099 (0.68) Firm size 20-99 employees 0.287*** (3.80) 0.096 (1.22) 0.293*** (3.72) -0.081 (0.69) (Ref: 0-19) 100-499 employees 0.409*** (5.37) -0.057 (0.47) 0.432*** (5.45) -0.074 (0.55) ≥ 500 employees 0.592*** (8.33) -0.019 (0.13) 0.623*** (8.42) -0.198 (1.24) Secondary activity -0.146 (0.91) -0.039 (0.26) -0.178 (1.06) -0.218 (0.91) Log wage in 1998 0.412*** (4.89) -0.076 (0.75) 0.487*** (5.57) -0.051 (0.39) Existence of a company training plan 0.386*** (6.66) 0.389*** (6.97)
Endogenous training participation -1.384*** (4.42) -0.617 (1.22)
Number of observations 4940 4743
Coefficient of correlation (t-test) 0.686 0.115
Log likelihood -2842.0 -2223.0
Source: French Training Survey "Formation Continue 2000", authors’ calculations.
Note: Bivariate Probit estimate. Both equations also include a set of regional dummies and a set of sectoral dummies are introduced into the training participation equation. Absolute value of t statistics are in parentheses, significance levels being respectively 1% (***), 5% (**) and 10% (*).
Table 4. Matching estimates of training participation (in 1998) on wages
Men Women All Outcome: Monthly wage in 2000 (log)
Unmatched Matched Unmatched Matched Unmatched Matched
(1) With wage in 1998 as control
Treated 7.416 7.411 7.193 7.192 7.323 7.323 Control 7.172 7.353 6.795 7.118 7.005 7.256 Difference 0.244*** 0.058*** 0.398*** 0.074** 0.318*** 0.067***
Abs. t-value (12.26) (2.62) (11.37) (2.38) (15.81) (3.46) (2) Without wage in 1998 as control
Treated 7.416 7.415 7.193 7.192 7.323 7.323 Control 7.172 7.326 6.795 7.069 7.005 7.216 Difference 0.244*** 0.089*** 0.398*** 0.123*** 0.318*** 0.107***
Abs. t-value (12.26) (4.04) (11.37) (3.97) (15.81) (5.58) Source: French Training Survey "Formation Continue 2000", authors’ calculations.
Note: Kernel matching estimates, significance levels being respectively 1% (***), 5% (**) and 10% (*). The list of covariates included in the training participation equation is described in Panel A of Table 2.
Figure 1. Returns to training along the wage distribution, with confidence intervals A. Quantile esimates, with exogenous participation and no controls
0% 10% 20% 30% 40% 50% 60% 70% 0 10 20 30 40 50 60 70 80 90 100 Percentile
B. Quantile estimates, with exogenous participation and individual controls
0% 2% 4% 6% 8% 10% 12% 0 10 20 30 40 50 60 70 80 90 100 Percentile
C. Quantile treatment effets, semiparametric estimation à la Firpo
-15% -10% -5% 0% 5% 10% 15% 20% 25% 0 10 20 30 40 50 60 70 80 90 100 Percentile
10-1. Are young French jobseekers of ethnic immigrant origin discriminated against? A controlled experiment in the Paris area
Emmanuel Duguet, Noam Leandri, Yannick L’Horty, Pascale Petit
10-2. Couple’s Work Hours, Satisfaction and reconciling Work and family Life
Nathalie Georges, Dominique Méda, Danièle Trancart
10-3. Housing ownership, social housing and unemployment: an econometric analysis of the Paris area
Emmanuel Duguet, Yannick L’Horty, Florent Sari
10-4. Do Public Subsidies Have an Impact on New Firm Survival? An Empirical Study with French Data
Lionel Désiage, Richard Duhautois, Dominique Redor
10-5. The effect of social security payroll tax reductions on employment and wages: an evaluation of the 2003 French reform
Matthieu Bunel, Fabrice Gilles, Yannick L’Horty
10-6. What are Entrepreneurs’ Objectives When Starting a New Business?
Lionel Désiage
10-7. Health and Early Retirement: Evidence from French Data for individuals
Thomas Barnay, Karine Briard
10-8. Ageing, chronic conditions and the evolution of future drugs expenditures
Thomas Barnay, Sophie Thiébaut, Bruno Ventelou
10-9. Entrepreneurial motives and performance: Why might better educated entrepreneurs be less successful?
Arnab Bhattacharjee, Jean Bonnet, Nicolas Le Pape, Régis Renault
10-10. Returns to firm-provided training in France: Evidence on mobility and wages
Arnaud Chéron, Bénédicte Rouland, François-Charles Wolff
10-11. Taxation of early retirement windows and delaying retirement: the French experience
Jean Bonnet, Nicolas Le Pape
10-13. Hiring Practices, Employment Protection and Temporary Jobs
Anne Bucher
10-14. Young-in Old-out: a new evaluation
Michela Bia, Pierre-Jean Messe, Roberto Leombruni
10-15. On the impact of the TFP growth on the employment rate: does training on-the-job matter?
Eva Moreno-Galbis
10-16. The dynamics of youth labor market integration
Anne Bucher
10-17. Fostering the potential endogenous development of European regions: a spatial dynamic panel data analysis of the Cohesion Policy on regional convergence over the period 1980-2005
Salima Bouayad-Agha, Nadine Turpin, Lionel Védrine
10-18. Cost-saving or Cost-enhancing Mergers: the Impact of the Distribution of Roles in Oligopoly
Nicolas Le Pape, Kai Zhao
10-19. Bankruptcy Risk, Product Market Competition and Horizontal Mergers
Bernard Franck, Nicolas Le Pape
10-20. Endogenous Job Destructions and the Distribution of Wages
Arnaud Chéron, Bénédicte Rouland
10-21. Employment Protection Legislation and Adverse Selection at the Labor Market Entry
The CNRS Institute for Labor Studies and Public Policies (the TEPP Institute, FR n°3126 CNRS) gathers together research centres specializing in economics and sociology:
• the Centre d'Etudes de l'Emploi (Centre for Employment Studies), CEE, Public Administrative Organization, under the leadership of the Ministers of Work and Research
• l'Equipe de Recherche sur les Marchés, l'Emploi et la Simulation (Research Team on Markets, Employment and Simulation), ERMES, University of Paris II Panthéon-Assas
• the Centre d'Etudes des Politiques Economiques de l'université d'Evry (Research Centre focused on the analysis of economic policy and its foundations and implications), EPEE, University of Evry Val d’Essonne
• the Centre Pierre Naville (Research on Work and Urban Policies), CPN, University of Evry Val d’Essonne
• l'Equipe de Recherche sur l'Utilisation des Données Temporelles en Economie
(Research Team on Use of Time Data in Economics), ERUDITE, University of Paris-Est Créteil and University of Paris-Paris-Est Marne-la-Vallée
• the Groupe d'Analyse des Itinéraires et des Niveaux Salariaux (The Group on Analysis of Wage Levels and Trajectories), GAINS, University of the Maine
The TEPP Institute brings together 115 researchers and research professors, 140 PhD students and 40 associate researchers who study changes in work and employment in relation to the choices made by firms and analyse public policies using new evaluation methods.