HAL Id: hal-01912125
https://hal.archives-ouvertes.fr/hal-01912125
Submitted on 5 Nov 2018
HAL is a multi-disciplinary open access
archive for the deposit and dissemination of
sci-entific research documents, whether they are
pub-lished or not. The documents may come from
teaching and research institutions in France or
abroad, or from public or private research centers.
L’archive ouverte pluridisciplinaire HAL, est
destinée au dépôt et à la diffusion de documents
scientifiques de niveau recherche, publiés ou non,
émanant des établissements d’enseignement et de
recherche français ou étrangers, des laboratoires
publics ou privés.
produced by additive manufacturing
O. Quénard, Olivier Dorival, Ph. Guy, A. Votié, K. Brethome
To cite this version:
O. Quénard, Olivier Dorival, Ph. Guy, A. Votié, K. Brethome. Measurement of fracture toughness of
metallic materials produced by additive manufacturing. CEAS Space Journal, 2018, 10 (3), pp.343
-353. �10.1007/s12567-018-0202-z�. �hal-01912125�
MEASUREMENT OF FRACTURE TOUGHNESS OF METALLIC MATERIALS
PRODUCED BY ADDITIVE MANUFACTURING
O. Quénard Doctor in Materials Science
Icam, 75 av. de Grande Bretagne 31076 Toulouse, France olivier.quenard@icam.fr
O. Dorival
Doctor in Mechanical Engineering
Icam, 75 av. de Grande Bretagne 31076 Toulouse, France
Université de Toulouse, Institut Clément Ader UMR CNRS 5312, INSA/UPS/ISAE/Mines Albi, 3 rue Caroline Aigle F-31400 Toulouse, France
olivier.dorival@icam.fr
Ph. Guy Engineer in Mechanics
Icam, 75 av. de Grande Bretagne 31076 Toulouse, France philippe.guy@icam.fr
A. Votié Engineer
FusiA, 8 rue Claude Gonin 31400 Toulouse, France a.votie@fusia.fr
K. Brethome Engineer
kevin.brethome@cnes.fr
ABSTRACT
This study focuses on the microstructure and mechanical properties of metallic materials produced by additive layer manufacturing (ALM), especially the Laser Beam Melting process. The influence of the specimen orientation during the ALM process and that of two post-build thermal treatments were investigated. The identified metal powder is Ti-6Al-4V (titanium base). Metallographic analysis show their effects on the microstructure of the metals. Mechanical experiments involving tensile tests as well as toughness tests were performed according to ASTM (American Society for Testing and Materials)
norms. The results show that the main influence is that of the thermal treatments; however the manufacturing stacking direction may lead to some anisotropy in the mechanical properties.
KEYWORDS: Additive Layer Manufacturing, Laser Beam Melting, Ti-6Al-4V, fracture toughness, mechanical properties
NOMENCLATURE
KIC – Mode I fracture toughness E - Young Modulus
YS - Yield Stress
UTS - Ultimate Tensile Stress A - Plastic Elongation
ALM - Additive Layer Manufacturing AM - Additive Manufacturing
ASTM - American Society for Testing and Materials
EBM - Electron Beam Melting HIP - Hot Isostatic Pressing LBM - Laser Beam Melting
SEM - Scanning Electron Microscope SLM - Selective Laser Melting
1. INTRODUCTION
For a few decades, additive manufacturing (AM) appeared as on the way of revolutionizing both the design possibilities and the manufacturing standards. It is now used as a regular technique in space, aircraft and dental industry.Design limits were incredibly stretched thank to unprecedented freedom and part complexity. Moreover AM totally fits the use of CAD tools, thus matching topology (and
weight) optimization approach well. Global manufacturing time and cost were deeply changed due to the decrease in the number of processing operations and number of parts. Additionally, AM leads to an optimal use of raw material.
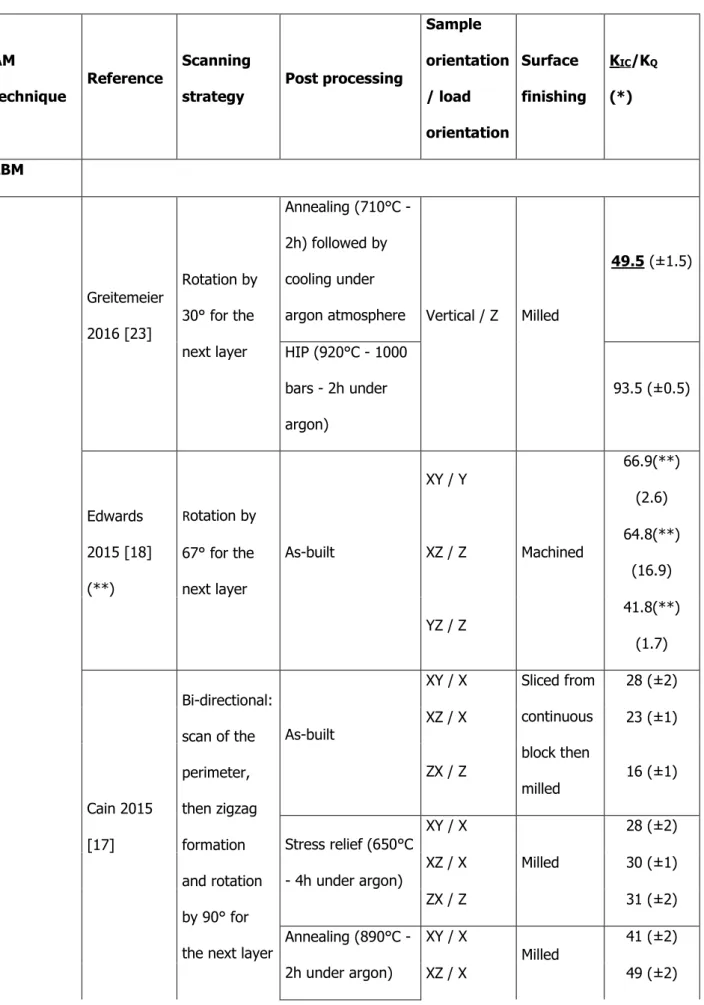
This paper focuses on the Laser Beam Melting AM technique dedicated to Ti-6Al-4V. AM also means a different manufacturing process resulting in a different microstructure due to rapid solidification rate. Consequently the mechanical properties have to be precisely determined with respect to lots of parameters available (powder properties, machine properties, batch design, post-processing, loading orientation, etc.). Much work has been done to investigate the process-microstructure-tensile property relations for LBM and shed light on the influence of the thermal treatment [1-3] or the building orientation [4-6]. Similar studies were done for EBM [7-10]. Carroll et al. [11] gave a summary of the tensile properties available in literature for Powder Bead Fusion, Direct Energy Deposition, and Electron Beam Melting techniques. Several papers dealt with the fatigue properties [12-23]. Li et al. [24] compared fatigue properties published in open literature for LBM and EBM. However to the author knowledge only few papers focused on the fracture toughness of AM Ti-6Al-4V [12, 17-19, 23, 25], although this is a key point in the damage tolerance approach. Table 1gives an overview of the data available in open literature for Ti-6Al-4V toughness obtained with Laser Beam Melting (LBM) and Electron Beam Melting (EBM) techniques. There is huge scatter between the various results for a given technique; however the dependency on the heat treatment and on the layering direction was reported by most of the authors.
The present contribution focuses on the microstructure-tensile-toughness relations of Ti-6Al-4V with respect to sample orientation and heat treatment used. LBM technique was used to manufacture several specimens, including metallography cube, tensile and fracture toughness specimen. The various specimens were produced in the same batch to ensure unique manufacturing conditions. Each batch received, or not, a particular heat treatment. In the end, samples had to experience several stages: ALM process, thermal treatments, machining, fatigue pre-cracking, final mechanical tests. The statistical analysis required a fine tracking of each specimen to be sure the conclusions could be drawn concerning the influence of the parameters of interest.
The paper is organized as follows: after introducing the samples preparation and the tests set-up, results of metallographic analysis, tensile tests, and toughness tests are presented, followed by a discussion.
2. SAMPLES PREPARATION AND TESTING METHODS
2.1 Materials, manufacturing parameters and thermal treatment
Two batches of Ti-6Al-4V specimens were manufactured. Each batch was manufactured during a single job to ensure that the same manufacturing parameters were used for all the samples. For the same reasons the manufacturing parameters were also kept the same for the two batches, and the jobs were done in a row to avoid too much recycling of the powder between the two batches. Batch #1 and Batch #2 were manufactured from Ti-6Al-4V powder from Advanced Powders and Coatings, with 15-45 µm particle size. The powder had been recycled 14 times for batch #1 and 15 times for batch #2. The batches were manufactured in a EOS M280 machine using a 1060-1100 µm wavelength laser. Layers were 60 µm thick. Both batches followed a stress relieving treatment on the base platform (670°C / 5h) to release residual stresses. The as-obtained Batch #2 was submitted to an additional Hot Isostatic Pressing (HIP) process (920°C / 2h / 1020 bars).
Both batches were then ready to be machined to obtain the expected shape and surface quality (Ra = 0.8), allowing mechanical testing.
Table 1: Results of LBM and EBM Ti-6Al-4V toughness reported in literature
AM
technique Reference
Scanning
strategy Post processing
Sample orientation / load orientation Surface finishing KIC/KQ (*) LBM Greitemeier 2016 [23] Rotation by 30° for the next layer Annealing (710°C - 2h) followed by cooling under
argon atmosphere Vertical / Z Milled
49.5 (±1.5) HIP (920°C - 1000 bars - 2h under argon) 93.5 (±0.5) Edwards 2015 [18] (**) Rotation by 67° for the next layer As-built XY / Y Machined 66.9(**) (2.6) XZ / Z 64.8(**) (16.9) YZ / Z 41.8(**) (1.7) Cain 2015 [17] Bi-directional: scan of the perimeter, then zigzag formation and rotation by 90° for the next layer
As-built XY / X Sliced from continuous block then milled 28 (±2) XZ / X 23 (±1) ZX / Z 16 (±1) Stress relief (650°C - 4h under argon) XY / X Milled 28 (±2) XZ / X 30 (±1) ZX / Z 31 (±2) Annealing (890°C - 2h under argon) XY / X Milled 41 (±2) XZ / X 49 (±2)
ZX / Z 49 (±1) Van Hooreweder 2012 [12] Bi-directional: scan of the perimeter, then zigzag formation and rotation by 90° for the next layer
As-built XY Machined by EDM 52.4 (±3.48) EBM Greitemeier 2016 [23] Alternates between 0° and 90° Annealing (710°C - 2h under vacuum) followed by cooling under argon atmosphere Vertical / Z Milled 106.5 (±3.5) Vertical / Z Milled 119 Edwards 2013 [25] Rotates 90° after every layer As-built Horizontal Machined 110 (8.9) Vertical / Z 102 (7.4) Seifi 2015 [19] (***) ? As-built XY / X ? 68 XY / X 80 XZ / X 76 XY / Y 67 XZ / Z 65
(*) Toughness values that succeed to meet the ASTM E399 validity requirement are denoted by bold underline font.
(**) Edwards et al. [18] used plain stress specimens instead of plain strain ones; this is likely to have given higher toughness values.
2.2 Tensile and toughness specimens and specimen orientations
The aim of the project required to get all the samples of a given batch in one job. For the sake of a statistical analysis and due to the dimensions of the manufacturing zone, dimensions of the samples had to be sufficiently small. For tensile tests, standard round specimens were designed using the following dimensions specified by ASTM E8 norm [26]: diameter for the section: 6 mm, length of the reduced section: 27 mm, total length: 60 mm. Seven samples were manufactured for each orientation/material/thermal treatment. After the ALM process and the thermal treatments, specimens had to be machined (mainly by turning process) to achieve good dimensional quality and to avoid any dependency on the quality of the surface shape.
For toughness tests, compact (CT) specimens were designed according to ASTM E399 norm with 32 mm specimen width (W32-B16). This allowed to manufacture five samples for each combination of material/orientation/thermal treatment. After the ALM process and the thermal treatments, specimens were machined to get the corresponding dimensions and to create the notch. A fatigue crack was created and propagated according to ASTM E399 norm recommendations. Unfortunately, manufacturing difficulties appeared during Ti-6Al-4V process and lead to several cracks in the samples during or after the manufacturing stage. Consequently such samples were missing for the toughness tests, as will be detailed later. For each group of samples, the number of tested specimens will be given in the corresponding tables.
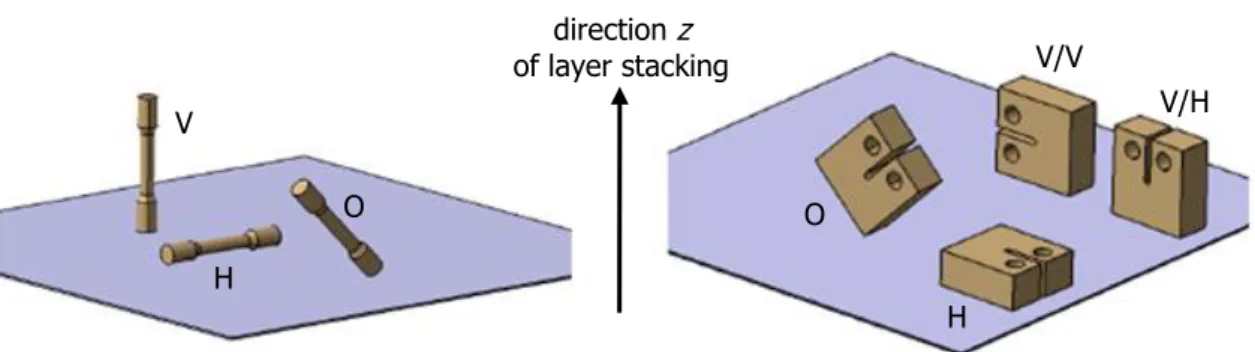
The ALM process consists in melting the part layer by layer, favouring the anisotropy of direction z of the “stacking”. Consequently, three particular orientations of the samples were identified for the tensile specimens, as shown in Figure 1. Note that for tensile specimens, this direction corresponds to the loading axis: vertical (denoted by “V”), horizontal (“H”), slanted at 45° (“O”). Note that in-plane directions x and y were not distinguished since the laser advance direction is turning of 30° when changing for the next layer. For the toughness specimens however, one needs to report both the building plane and the loading axis due to multiple crack orientations. Consequently four different orientations were identified: horizontal (resp. oblique) specimens gave only horizontal (resp. oblique) loading direction denoted by “H” (resp. “O”), whereas vertical specimens could lead to both a vertical
notch and horizontal loading direction (denoted by “V/H”), and a horizontal notch and vertical direction (“V/V”).
Figure 1: Orientations of the samples for tensile and toughness tests
2.3 Metallographic analysis
Preparation of the samples consisted in polishing, under water as lubricant, using a PRESI device (reference: MECAPOL P 220 U). Sequential grinding with silicon carbide (SiC) abrasive paper was performed for the preliminary steps, using water as lubricant. Four grades were used (P320, P800, P1200 and P4000), the corresponding abrasive grains median diameter of which are 46.2 µm, 21.8 µm, 15.3 µm and 2.5 µm respectively.
A specific Silica suspension (particle size: 0.04 µm, PRESI reference: SPM) was used for the finishing. No additional lubricant was necessary in this case. The best results were obtained by controlling the parameters (rotation speed v, load F and duration t) as follows:
for P320: v=300 rpm, F=25 N, t=1 min; for P800: v=300 rpm, F=25 N, t=0.5 min; for P1200: v=300 rpm, F=25 N, t=0.5 min; for P4000: v=300 rpm, F=25 N, t=0.5 min;
for silica suspension, v=150 rpm, F=15 N, t=2 to 4 min.
To reveal the microstructure of the specimen, Kroll’’s reagent (6 mL of HNO3, 3 mL of HF and 91 mL of H2O) was used: 2 min 30 sec at room temperature.
Optical observations were performed with a ZEISS Stemi 2000 binocular (for magnifications ranging between x0.65 to x5) and a ZEISS Axiotech microscope (for magnifications ranging between x5 to
V H O V/V V/H O H direction z of layer stacking
x100). In both cases, a PRESIVIEW software allowed acquiring images. For larger magnification (up to x10 000), a HITACHI TM1000 scanning electron microscope (SEM) was available.
One must note that observations were performed along two orientations:
perpendicularly to the plane of manufacturing. The corresponding observation (horizontal cross section) can then reveal the microstructure of a layer;
perpendicularly to the layers of the material. The corresponding observation (vertical cross section) reveals the homogeneity along the height of the sample, from the first to the last fused layer.
For practical reasons, we will call these two orientations as horizontal and vertical respectively in the following.
2.4 Tensile and toughness tests set-up
Tensile tests were performed on a Instron electromechanical testing machine of type UTM-EM. Machine driving was performed by Bluehill 2.21 software. A 2525-801 type 100 kN Instron load cell was used to record the tensile force. A 12.5mm 2620-601 Instron clip-on extensometer was used to measure the axial strain of the specimen. Tests were performed according to recommendation of norms ASTM E8 [26] and NF EN 10002-1 [27]. Load rate of 2 MPa/s was used till reaching 70 MPa. Then strain rate of 0.00025 s-1 was prescribed. At about 2% strain, the clip-on extensometer was removed manually, and strains were measured directly by the displacement of the load frame.
Toughness tests were performed on the same Instron testing machine using Bluehill software 2.21. Apparatus involved the same 100 kN load cell and a 2670-130 Crack Opening Displacement Gauge from Instron. Tests were performed following the ASTM E399 recommendation [28]. Load rate of 0.33 kN/s was used up to global failure of the specimen.
3. RESULTS FOR TI-6AL-4V
3.1 Results of metallographic analysis for Ti-6Al-4V alloy
Observations at low magnification revealed a good microstructural homogeneity of the sample, whatever the orientation. This result could prove that the cooling rate was similar during the manufacturing, whatever the number of layers. The mass of obtained sample has no (or not optically detectable) influence on the resulting microstructure.
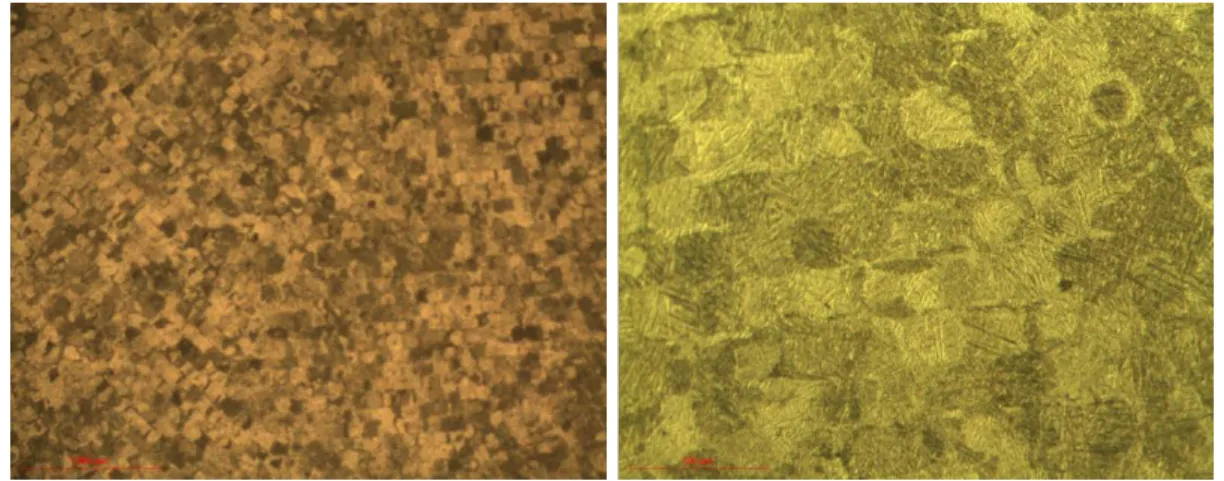
Horizontal: At low magnification, each layer is composed of lines parallel one to each other, each
of them showing a succession of more or less regular squares (see Figure 2). This typical microstructure reflects the successive scanning orientations of the laser beam during the manufacturing. Indeed, for each layer, the laser beam produced a melted bead and, after recrystallization, a line of solid material (the width of which is ranging between 100 and 120 µm) aligned to the direction of the laser beam displacement. The direction of the beam changing from layer to layer, and the induced fusion affecting not only the concerned layer but also the 2-3 lower layers, the recrystallization produced square grains detectable along each line. Observing several orientations of the lines indicates that the polishing affected several successive layers.
Figure 2: Microstructure observed for the Ti-6Al-4V sample at low magnifications
Higher magnification allows observing the martensitic structure (see Figure 3) of each square of the Ti-6Al-4V sample. This microstructure indicates that the cooling rate during the manufacturing process was fast enough to lead to the ’ metastable phase.
Figure 3: Martensitic microstructure of the Ti-6Al-4V sample
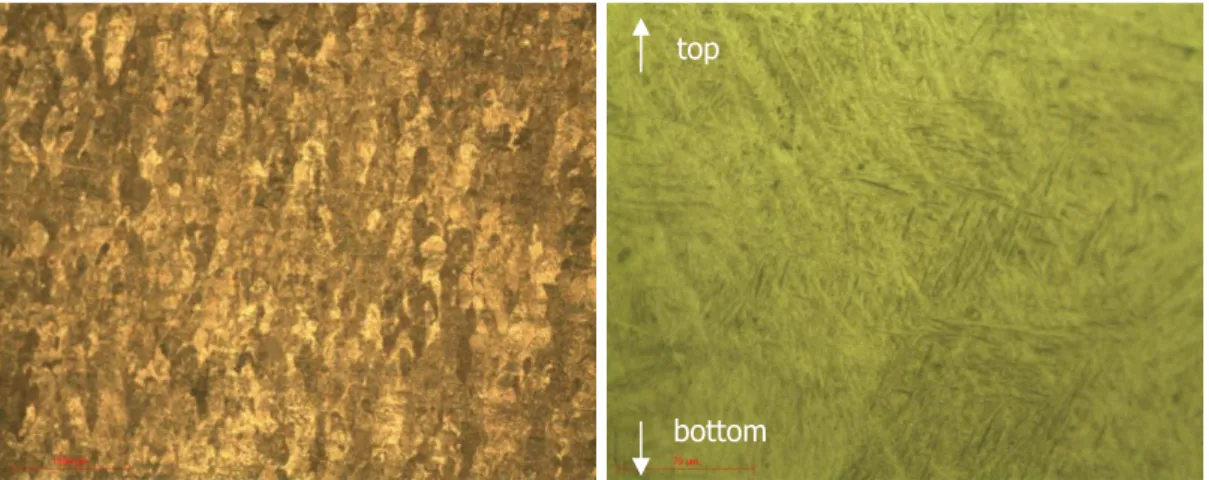
Vertical: Observations of the Ti-6Al-4V sample along its height revealed that, if the microstructure
is composed of layers, the obtained grains after recrystallization have a columnar structure (see Figure 4), the orientation of which is perpendicular to the layers. This microstructure is only possible by fusion of the lower layers, leading to a melted bead with a “keyhole” section when scanning the laser beam [29, 30]. Figure 4 confirmed that the grains are made of ’ martensitic phase.
Figure 4: Microstructure along the height of the Ti-6Al-4V sample at low (left) and high (right) magnification
As a result, it appears that the microstructure of the Ti-6Al-4V samples obtained by LBM is quite homogeneous, even if it does not seem to be isotropic, nor in the layer plane, nor in the height plane.
bottom top
Batch #2: Ti-6Al-4V after stress-relief and HIP
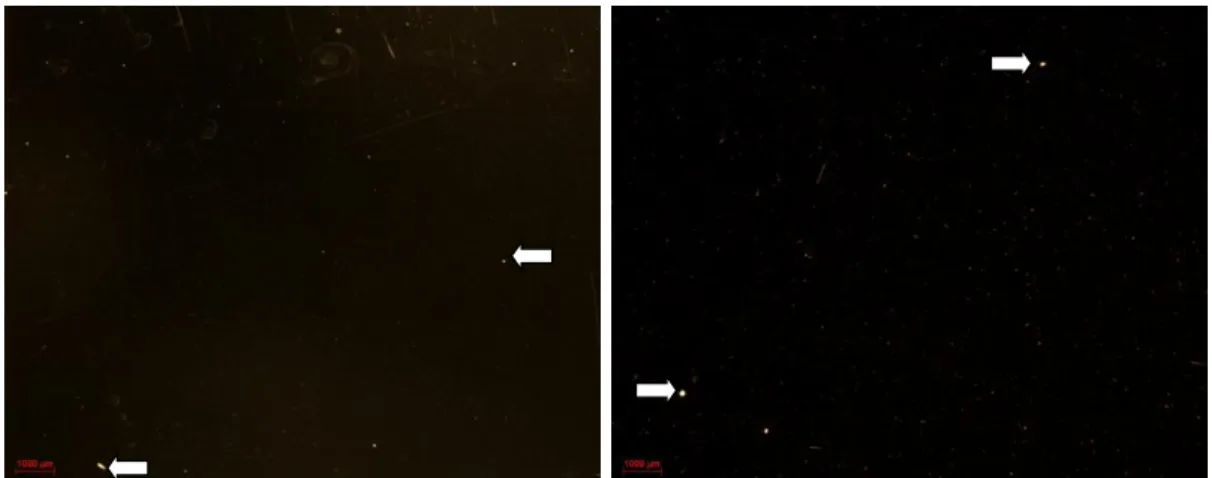
The HIP treatment was expected to eliminate, or at least reduce, the porosity rate in the obtained samples. Among all the potential techniques, we estimated the porosity rate by observing the polished surface of the sample and detect the porosity by difference of colour. The surface of the sample appears dark while porosity appears as white dots (see Figure 5). As a first result, we can say that the HIP finally did not reduce the porosity rate, maybe due to the very low proportion of porosity (lower than 0.2%) in the initial material.
Figure 5. Porosity (white dots) detected in the Ti-6Al-4V sample before (left) and after (right) the HIP treatment
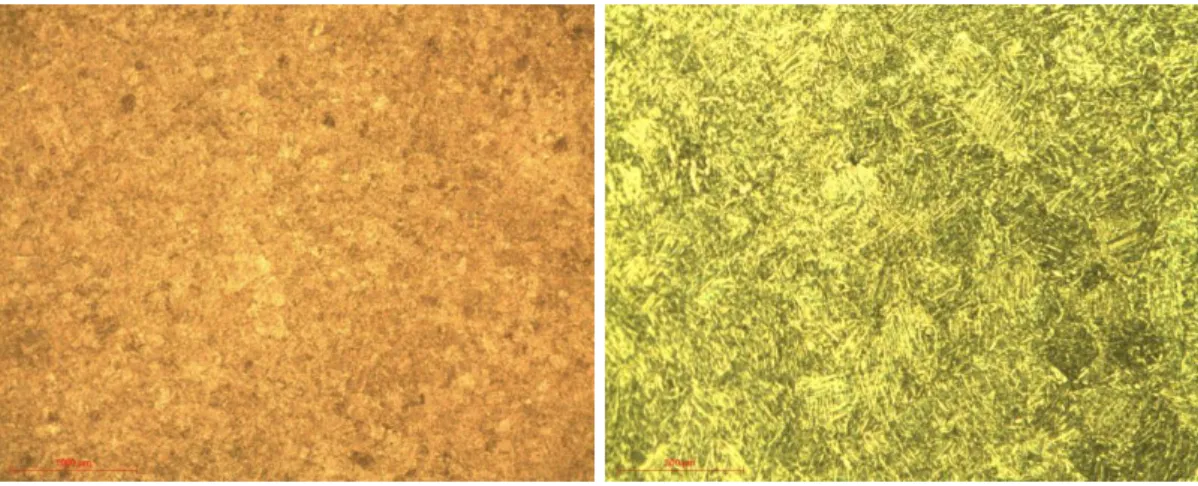
Horizontal: The HIP treatment clearly blurred the anisotropic microstructure of the Ti-6Al-4V
sample (see Figure 6), even if some residual anisotropy can be detected. The lines and squares largely vanished.
Figure 6. Microstructure observed for the Ti-6Al-4V sample after HIP at low magnifications
At higher magnification (see Figure 7), observations showed that the martensitic structure disappeared; the sample is now constituted by a / structure. The proportion of obtained phase is low due to a thermal treatment either at too low temperature or with a too short duration.
Figure 7. Microstructure observed for the Ti-6Al-4V sample after HIP at high magnification
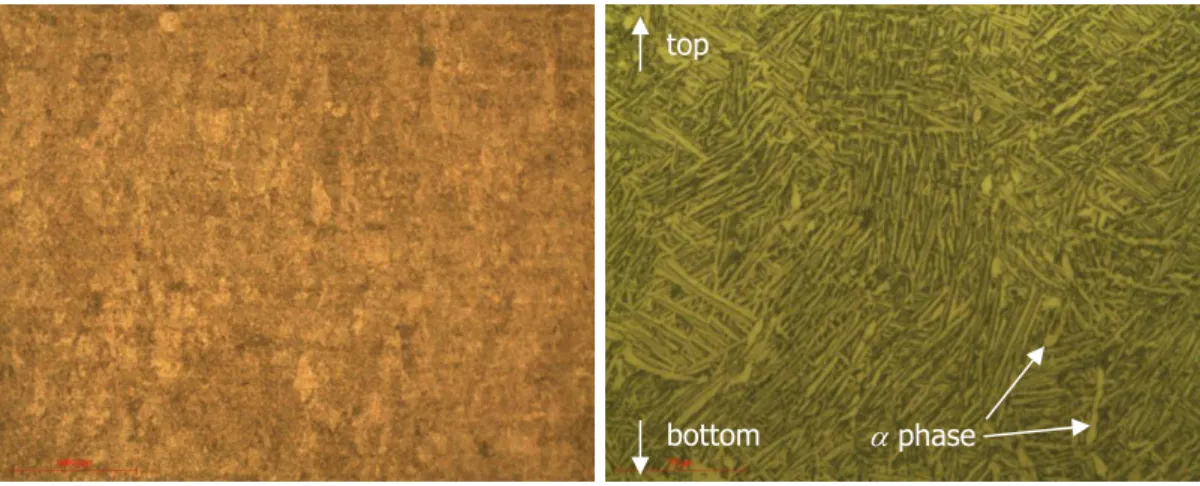
Vertical: One can note at low magnification (Figure 8, left) that the anisotropy is not fully blurred,
as layers are still slightly visible, as well as some residual columnar grains. We could then estimate that the anisotropy is more strongly present in the vertical plane than in the horizontal one. Higher magnification (Figure 8, right) allows to conclude that the phase appears along the grain boundaries between the columnar grains, as expected.
phase
Figure 8. Microstructure along the height of the Ti-6Al-4V sample after HIP at low (left) and high (right) magnification
3.2 Results of tensile tests
Two typical stress-strain curves obtained for samples of batches #1 and #2 are shown in Figure 9. Detailed results including Young’s modulus (E), tensile yield stress (YS), ultimate tensile stress (UTS) and elongation (A%) for batches #1 and #2 are reported in Table 2 and Table 3 respectively. Unlike toughness specimen, tensile specimens did not experience cracking during the ALM process thank to more slender shape, and all specimens manufactured could be tested.
Figure 9 - Typical stress-strain results for titanium specimen
0 200 400 600 800 1000 1200 1400 0% 2% 4% 6% 8% 10% 12% 14% 16% 18% Stres s [MPa ] Strain [mm/mm] Set 1 Set 2 phase bottom top
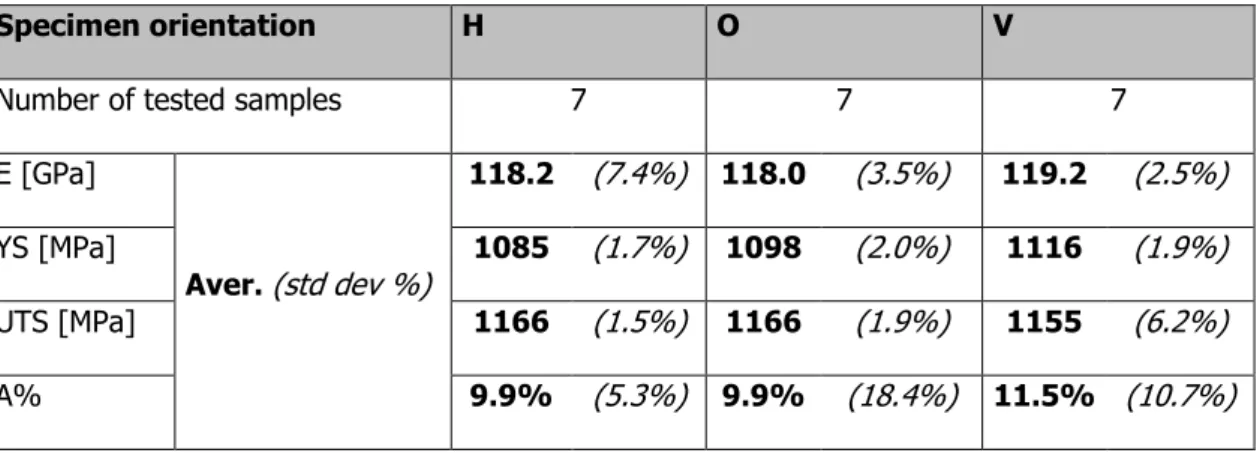
Except for elongation, results for batch #1 were rather repeatable. For Young’s modulus, yield stress and ultimate stress, the slight differences between the various orientations are hardly significant and the material can be considered as quasi-isotropic for those properties. However a moderate 16% increase in the elongation tends to appear for the vertical direction (building direction), although low repeatability maintains doubt about this.
Samples of batch #2 were found to provide very repeatable results including the elongation. Again the material looks almost isotropic including the elongation. This tends to confirm that the HIP treatment removed the slight z-anisotropy noted in the elongation in batch #1.
Comparisons between batch #1 and batch #2 lead to the most interesting conclusions. Young’s modulus seemed to have slightly decreased (by 4.6%) after the HIP treatment, but the difference is not high enough to be sure that it is relevant. Important drops were noticed concerning the yield stress (-19.2%) and the ultimate stress (-14.7%). On the opposite elongation increased by 59%. As a conclusion, the HIP treatment did not lead to any improvement in the tensile characteristics, except the large 59% increase in the inelastic deformation of the material.
Table 2: Results of tensile tests for batch #1
Specimen orientation H O V
Number of tested samples 7 7 7
E [GPa] Aver. (std dev %) 118.2 (7.4%) 118.0 (3.5%) 119.2 (2.5%) YS [MPa] 1085 (1.7%) 1098 (2.0%) 1116 (1.9%) UTS [MPa] 1166 (1.5%) 1166 (1.9%) 1155 (6.2%) A% 9.9% (5.3%) 9.9% (18.4%) 11.5% (10.7%)
Table 3 - Results of tensile tests for batch #2
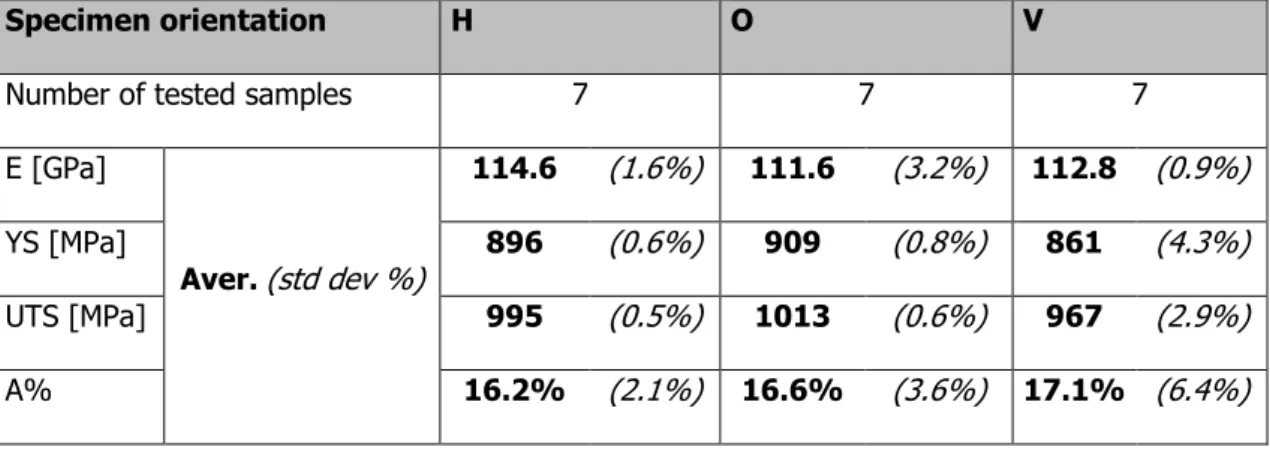
Specimen orientation H O V
Number of tested samples 7 7 7
E [GPa] Aver.(std dev %) 114.6 (1.6%) 111.6 (3.2%) 112.8 (0.9%) YS [MPa] 896 (0.6%) 909 (0.8%) 861 (4.3%) UTS [MPa] 995 (0.5%) 1013 (0.6%) 967 (2.9%) A% 16.2% (2.1%) 16.6% (3.6%) 17.1% (6.4%)
3.3 Fracture surface analysis of tensile tests
Batch #1
The overall view of the tensile fracture surface of the vertical as built samples is presented in Figure 10a. It appears that failure mechanism was mostly ductile as a transgranular fracture surface with a network of dimples can be largely observed (see Figure 10b).
Some defects can also be observed, such as porosity (resulting from microvoid coalescence during the manufacturing process), mostly located in the center part of the section of the sample (see Figure 10b), even if this porosity does not seem to have a strong influence on the mechanical properties, at least for tensile tests. One could assume that the porosity could be the main cause of the fracture [13]. z a) b) c) d) 1 2 3
Figure 10. Fracture tensile surface of the vertical stress-relieved sample. (a): overall view of the fracture surface. (b): defects detected in location 1 in (a). (c): microcracks
detected in location 2 in (a). (d): brittle fracture surface in location 3 in (a).
Nevertheless, another defect seems to have much more influence on the mechanical behaviour of the sample: the micro-cracks. They were mostly detected in the external part of the section of the sample (see Figure 10c), even if few of them can be observed in the centre of the section. These micro-cracks were attributed in our case to the residual stress in the sample after the laser manufacturing, which was not erased after the stress relieving treatment. The large number of such micro-cracks at the fracture surface should underline their strong influence on the mechanical performance of the stress-relieved Ti-6Al-4V sample. This conclusion was confirmed by the brittle surfaces detected around most of these micro-cracks, leading to cleavage facets and a layered profile (see Figure 10c-d). These brittle surfaces were attributed to cleavage within layers of the material, joining two ductile surfaces, which were the interface between two successive layers. Nevertheless, in such a mixed ductile-brittle behaviour, the ductility was largely dominating.
Similar results were obtained by observing samples in other directions (horizontal and sidelong), confirming the quasi-isotropy of the obtained LBM samples.
Batch #2
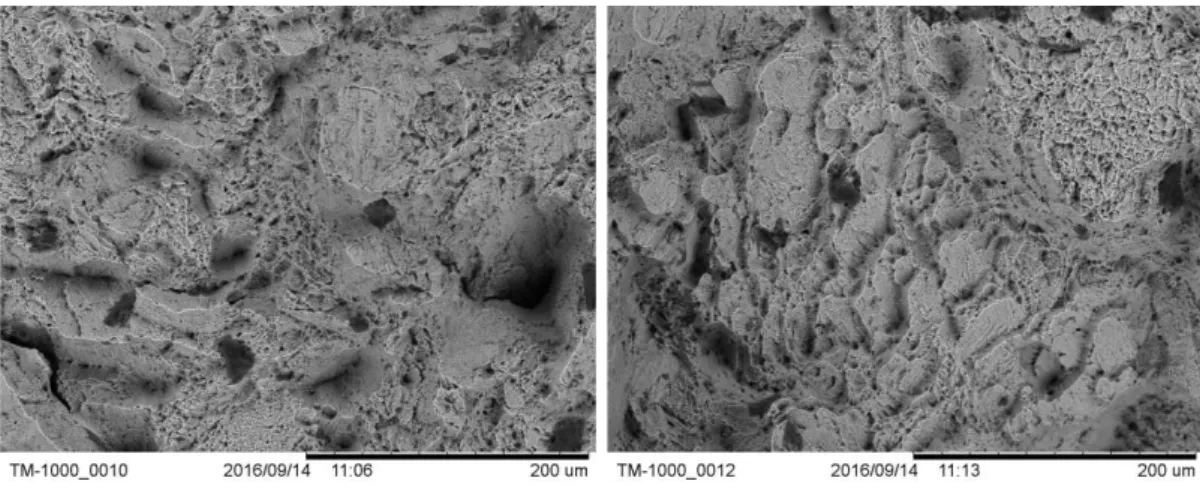
As a first result, one must note that at the lowest magnification (x40), the whole fracture surface of the vertical sample after HIP could be observed (see Figure 11a), what was not possible for the
stress-relieved sample. This remark means that the HIP treatment lead to a higher ductility, and so to a larger necking, confirming the larger elongation measured for such samples during the tensile tests.
Then, it appeared that there was no porosity detected on the fracture surface, proving that if there was residual porosity in the whole sample (as noted in Figure 5), it had no influence on the mechanical performances of the HIPed sample. The thermal treatment seems to be very efficient to increase the plastic deformation of LBM manufactured Ti-6Al-4V.
Increasing magnification during the observation allowed revealing a pure ductile behaviour of the sample, characterized by the dimples network (see Figure 11b). Such a behaviour could be confirmed by both a larger necking of the sample and a “cup and cone” aspect (typical of ductile material).
Figure 11. Fracture tensile surface of the vertical sample after HIP treatment. (a): overall view of the fracture surface. (b): observed ductile behaviour. (c): microcrack
detected in location 1 in (a). (d): magnification in location 2 in (a).
c) d)
1
2
Some few micro-cracks were still remaining (see Figure 11c), but they did not give rise to cleavage facets attributed to brittle behaviour. The final overloaded surface (see Figure 11d) also presented a ductile aspect, but the size of the dimples is much smaller. This result can be explained as the duration of final fracture was too short to allow large plastic deformation of the corresponding area, and then to lead to larger dimples.
Similar results were obtained for other directions (horizontal and sidelong).
3.4 Results of toughness tests
Results of toughness tests for Ti-6Al-4V batches #1 and #2 are reported in Table 4 and Table 5 respectively. This includes the number of tested samples, the number of pre-cracking fatigue cycles and the results of plane strain fracture toughness KIC.
Unlike tensile samples, let us first remark that several CT samples experienced cracking during or immediately after the ALM process. This was due to residual stresses in such compact parts, although samples were “only” 19 mm thick (aiming at 16 mm after machining).
Batch #1 showed very repeatable values. The number of fatigue cycles was similar, except for the
“V/V” orientation that was 20% lower. Fracture toughness was almost equal for “H”, “O” orientation. On the contrary, the “V/H” and “V/V” samples were found to show a 17% increase and a -4% decrease, respectively.
Results of batch #2 tests were also found to be very repeatable. Fatigue cycling was similar for all orientations, and was 19% lower than that of batch #1. Fracture toughness was equal for “H” and “O” orientations. Although “V/H” and “V/V” very low differences (+5% and -7.5% respectively) could be attributed to scatter, it is interesting to note that they have the same tendency than in batch #1, that is: slightly higher toughness for “V/H” samples, and lower but similar values for “V/V”, “H” and “O” samples.
The most important point is the 57% average increase (+48% to +63% according to the orientations) in the average fracture toughness of batches #1 and #2. Unlike the tensile characteristics, the HIP treatment greatly improved the fracture strength of the samples.
Table 4: Results of toughness tests for batch #1 Specimen orientation H O V/H V/V
Nb of samples (*) (valid) (***)
4
(4)4
(4)4
(4)3
(3)Ncycles Aver.
46275
48765
48639
40732
KIC/KQ(**) [MPa.√m] Aver. (Std dev %)
40.3
(3.4%)38.9
(6.3%)45.6
(4.3%)38.1
(1.6%) (*) Due to manufacturing hazards, several samples of each orientation in batch #1 were cracked and could not be tested.(**) The results for KIC for batch #1 were all valid according to ASTM E399. (***) According to the Pmax/PQ condition in ASTM E399.
Table 5 - Results of toughness tests for batch #2
Specimen orientation H O V/H V/V
Nb of samples (*) (valid) (***)
5
(4)2
(2)4
(3)2
(2)Ncycles Aver.
38471
39998
38549
38050
KIC/KQ(**) [MPa.√m] Aver. (Std dev %)
64.9
(1.6%)63.6
(0.5%)67.3
(5.3%)59.4
(0.2%) (*) Due to manufacturing hazards, several samples of each orientation in batch #2 were cracked and could not be tested.(**) The results for KIC for batch #2 were not all considered as valid according to norm ASTM E399, due to the Pmax/PQ condition. Specimens that failed to meet the condition were very close to reach it though.
(***) According to the Pmax/PQ condition.
4. DISCUSSION
One must first note that if the LBM process lead to metallographic anisotropy of the material, such anisotropy was not significantly observed in the measured tensile properties. Nevertheless, the layered microstructure has a notable influence on the toughness values, as the “V/H” samples
exhibited higher characteristics than the other three sample orientations (“O”, “H”, “V/V”). These later presented similar toughness values. This could be easily explained by the fact that the interface between layers acted as grain boundaries, limiting the crack propagation and so leading to a higher toughness. This explanation could also explain why the “H” and “V/V” samples showed similar toughness (no additional layer interface to overcome). The “O” values were surprisingly similar to the “H” and “V/V” ones, although it could be expected to exhibit an intermediate behaviour between the “H” and “V/H” ones.
The HIP treatment applied almost restored the complete isotropy to the samples from both a metallographic and tensile properties points of view. The anisotropic behaviour was still remaining in the toughness test for the “V/H” orientation. As presented in other works, the HIP treatment (the role of which is to reduce or erase any porosity) mostly allowed larger plastic deformation (+59%) by strongly reducing the residual stresses induced by the LBM manufacturing. This higher plasticity was twined to a notable decrease in the yield and ultimate stresses. Unlike in [4, 31], observations did not reveal any notable decrease in the porosity rate, but this may be attributed to a very low initial rate: 0.2%. Nevertheless, the potential residual porosity was not detected on the fracture surface. This indicates that the plasticity was sufficient to strongly reduce the influence of the porosity, which was not anymore a crack initiation location. This could explain the resulting 57% increase in the toughness of the HIPed samples. The HIP heat treatment is then recommended for LBM manufactured Ti-6Al-4V samples submitted to fatigue solicitations.
5. CONCLUSIONS
The obtained results seem to be promising for the Ti-6Al-4V material even if some other characterization are still missing. Further studied are under investigation concerning the toughness fracture surface and the influence of potential defects within the raw material.
Similar investigations are also in progress for AlSi7Mg0.6 material. The influence of building orientation and heat treatments after LBM manufacturing, as well as internal defects, will be soon presented in another paper.
ACKNOWLEDGEMENTS
The authors wish to acknowledge Centre National des Etudes Spatiales (CNES) for support through grant N°160025/00 and implication during the recurrent informal meetings.
We also thank FusiA company for providing the heat treated manufactured samples, and Thales Alenia Space for the technical discussions.
Our acknowledgement also to Exova company for preparing the toughness samples.
REFERENCES
1. L. Thijs, F. Verhaeghe, T. Craeghs, J. Van Humbeeck, J.-P. Kruth; 2010; “A study of the microstructural evolution during selective laser melting of Ti–6Al–4V”; Acta Mater; 58; pp. 3303 – 3312
2. L. Facchini, E. Magalini, P. Robotti, A. Molinari, S. Höges, K. Wissenbac; 2010; “Ductility of a Ti‐6Al‐4V alloy produced by selective laser melting of prealloyed powders”; Rapid Prototyping Journal; 16(6); pp. 450 - 459
3. B. Vrancken, L. Thijs, J.-P. Kruth, J. Van Humbeeck; 2012; “Heat treatment of Ti6Al4V produced by Selective Laser Melting: microstructure and mechanical properties”, Journal of Alloys and Compounds; 541; pp. 177 - 185
4. C. Qiu, N.J.E. Adkins, M.M. Attallah; 2013; “Microstructure and tensile properties of selectively laser-melted and of HIPed laser-melted Ti–6Al–4V”; Materials Science and Engineering: A; 578; pp. 230 - 239
5. M. Simonelli, Y.Y. Tse, C. Tuck; 2014; “Effect of the build orientation on the mechanical properties and fracture modes of SLM Ti–6Al–4V”; Materials Science and Engineering: A; 616; pp. 1 - 11
6. S. Palanivel, A.K. Dutt, E.J. Faierson, R.S. Mishra; 2016; “Spatially dependent properties in a laser additive manufactured Ti–6Al–4V component”; Materials Science and Engineering: A; 654; pp. 39 - 52,.
7. N. Hrabe, T. Quinn; 2013; “Effects of processing on microstructure and mechanical properties of a titanium alloy (Ti–6Al–4V) fabricated using electron beam melting (EBM), Part 2: Energy input, orientation, and location”; Materials Science and Engineering: A; 573; pp. 271 - 277
8. H. Suo, Z. Chen, J. Liu, S. Gong, J. Xiao; 20144; “Microstructure and Mechanical Properties of Ti-6Al-4V by Electron Beam Rapid Manufacturing”; Rare Metal Materials and Engineering; 43(4); pp. 780 - 785
9. X. Tan, Y. Kok, Y. J. Tan, M. Descoins, D. Mangelinck, S. B. Tor, K. F. Leong, C. K. Chua; 2015; “Graded microstructure and mechanical properties of additive manufactured Ti–6Al–4V via electron beam melting”, Acta Materialia; 97; pp. 1 - 16
10. C. Formanoir, S. Michotte, O. Rigo, L. Germain, S. Godet; 2016; “Electron beam melted Ti– 6Al–4V: Microstructure, texture and mechanical behavior of the as-built and heat-treated material”,
Materials Science and Engineering: A; 652; pp. 105 - 119
11. B. E. Carroll, T. A. Palmer, A. M. Beese; 2015; “Anisotropic tensile behavior of Ti–6Al–4V components fabricated with directed energy deposition additive manufacturing”; Acta Materialia;
87; pp. 309 - 320
12. B. Van Hooreweder, D. Moens, R. Boonen, J.-P. Kruth, P. Sas, Paul; 2013; “Analysis of Fracture Toughness and Crack Propagation of Ti6Al4V Produced by Selective Laser Melting”; Advanced Engineering Materials; 14(1-2); pp. 92 - 97
13. H. K. Rafi, T. L. Starr, B. E. Stucker; 2013; “A comparison of the tensile, fatigue, and fracture behavior of Ti–6Al–4V and 15-5 PH stainless steel parts made by selective laser melting”; Int J Adv Manuf Technol; 69; pp. 1299 – 1309
14. S. Leuders, M. Thöne, A. Riemer, T. Niendorf, T. Tröster, H.A. Richard, H.J. Maier; 2013; “On the mechanical behaviour of titanium alloy TiAl6V4 manufactured by selective laser melting: Fatigue resistance and crack growth performance”; International Journal of Fatigue; 48; pp. 300 - 307
15. S. Leuders, M. Vollmer, F. Brenne, T. Tröster, T. Niendorf; 2015; “Fatigue strength prediction for titanium alloy TiAl6V4 manufactured by Selective Laser Melting”; Metallurgica and materials transactions A; 46(9); pp. 3816 - 3823
16. H. Gong, K. Rafi, H. Gu, G.D.J. Ram, T. Starr, B. Stucker; 2015; “Influence of defects on mechanical properties of Ti–6Al–4V components produced by selective laser melting and electron beam melting”; Materials & Design; 86; pp. 545 - 554
17. V. Cain, L. Thijs, J. Van Humbeeck, B. Van Hooreweder, R. Knutsen; 2015; “Crack propagation and fracture toughness of Ti6Al4V alloy produced by selective laser melting”; Additive Manufacturing; 5; pp. 68 - 76
18. P. Edwards, M. Ramulu; 2015; “Effect of build direction on the fracture toughness and fatigue crack growth in selective laser melted Ti-6Al-4 V”; Fatigue & Fracture of Engineering Materials & Structures; 38(10); pp. 1228 - 1236
19. M. Seifi, M. Dahar, R. Aman, O. Harrysson, J. Beuth, J. J. Lewandowski; 20156; “Evaluation of Orientation Dependence of Fracture Toughness and Fatigue Crack Propagation Behavior of As-Deposited ARCAM EBM Ti-6Al-4V”; JOM; 67(3); pp. 597 - 607
20. X. Zhao, S. Li, M. Zhang, Y. Liu, T. B. Sercombe, S. Wang, Y. Hao, R. Yang, L. E. Murr; 2016; “Comparison of the microstructures and mechanical properties of Ti–6Al–4V fabricated by selective laser melting and electron beam melting”; Materials & Design; 95; pp. 21 - 31
21. T. M. Mower, M. J. Long; 2016; “Mechanical behavior of additive manufactured, powder-bed laser-fused materials”; Materials Science and Engineering: A; 651; pp. 198 – 213
22. G. Kasperovich, J. Haubrich, J. Gussone, G. Requena; 2016; “Correlation between porosity and processing parameters in TiAl6V4 produced by selective laser melting”; Materials & Design;
105; pp. 160 - 170
23. D. Greitemeier, F. Palm, F. Syassen, T. Melz; 2017; “Fatigue performance of additive manufactured TiAl6V4 using electron and laser beam melting”; International Journal of Fatigue;
94(2); pp. 211 - 217
24. P. Li, D. H. Warner, A. Fatemi, N. Phan; 2016; “Critical assessment of the fatigue performance of additively manufactured Ti–6Al–4V and perspective for future research”; International Journal of Fatigue; 85; pp. 130 - 143
25. P. Edwards, A. O’Conner, M. Ramulu; 2013; “Electron beam additive manufacturing of titanium components: properties and performance”; J. Manuf. Sci. Eng; 135(6); 061016
26. ASTM E8 / E8M-15a; 2015; “Standard Test Methods for Tension Testing of Metallic Materials”;
ASTM International; West Conshohocken, PA; www.astm.org
27. NF EN 10002-1 ; “Matériaux métalliques - Essai de traction - Partie 1 : méthode d'essai (à la température ambiante) ” ; www.afnor.org
28. ASTM E399-12e3; 2012; “Standard Test Method for Linear-Elastic Plane-Strain Fracture Toughness KIc of Metallic Materials”; ASTM International; West Conshohocken, PA; www.astm.org 29. G. Paradis; 2005; “Monographies techniques du DFTN : soudage par laser”; CEA Valduc 30. Y. Robert; 2007 ; “Simulation numérique du soudage du TA6V par laser YAG impulsionnel : caractérisation expérimentale et modélisation des aspects thermomécaniques associés à ce procédé”; Sciences de l'ingénieur [physics]; Ecole Nationale Supérieure des Mines de Paris
31. G. Kasperovich, J. Hausmann; 2015; “Improvement of fatigue resistance and ductility of TiAl6V4 processed by selective laser melting”; Journal of Materials Processing Technology; 220; pp. 202 - 214