The Affordability of China's Residential Real Estate Market and Opportunities for Property Developers
By
TERENCE T. LAM
B.S. Biomedical Engineering Johns Hopkins University, 2005
SUBMITTED TO THE MIT SLOAN SCHOOL OF MANAGEMENT IN PARTIAL FULFILLMENT OF THE REQUIREMENTS FOR THE DEGREE OF
MASTER OF SCIENCE IN MANAGEMENT STUDIES MASSACHUSETTS INSTITUTE
ATTHE OF TECHNOLOGY
MASSACHUSETTS INSTITUTE OF TECHNOLOGY
JUN 15 2011
JUNE 2011LIBRARIES
@ 2011 Terence T. Lam. All rights reserved.
ARCHIVES The author hereby grants to MIT permission to reproduce
and distribute publicly paper and electronic copies of this thesis document in whole or in part
in any medium now known or hereafter created.
Signature of Author:
MIT Sloan School of Management May 6, 2011
Certified by:
Randolph B. Cohen Associate Professor of Finance Thesis Advisor
Accepted by:
Michael A. Cusumano SMR Distinguished Professor of Management Program Director, M.S. in Management Studies Program MIT Sloan School of Management
(This page intentionally left blank.)
The Affordability of China's Residential Real Estate Market and
Opportunities for Property Developers
By TERENCE T. LAM
Submitted to MIT Sloan School of Management on May 6, 2011 in Partial Fulfillment of the requirements for the Degree of Master of Science in
Management Studies.
ABSTRACT
China has the largest housing market in the world and the property market continues to advance at an astonishing pace. In 2009, 22.2% of China's RMB 19.3 trillion fixed asset investment and 17.9% of foreign direct investment were invested into the real estate sector. At the same time, the highly dynamic market structure and huge regional disparities in China created mixed interpretation and confusion. Nationwide statistics blending urban and suburban prices and the indifferent treatment towards subsidized housing and private housing overshadowed the actual development on the local level. With unprecedented investment pouring into the Chinese real estate market and sky rocketing property prices in most major cities, the legendary short-seller James Chanos described the Chinese real estate sector as "Dubai times 1,000 - or worse". Yet, another American financial guru Jim Rogers openly debunked the statement from James Chanos and remained his bullish views on China.
This thesis is divided into two sections. First it reviews the historical development from the Chinese property market. The paper explores the current situation of the market and focuses on the affordability comparison between the national level and the local levels. On a national level, housing prices grow at a pace similar to China's GDP growth supported by an even faster growth in income levels. Affordability ratios are in line with international standards and below the levels experienced by Japan and US during their bubble era. At the local level, different cities experienced drastic differences in price growth and supply surpluses. In some cities, even the suburban areas are beyond the affordability of an average household.
In the second section, this paper explores the development of affordable housing, the new frontier of Chinese real estate market. The emergence of the affordable housing market together with new housing policies has different implications and opportunities to the incumbent property developers as well as potential low-end disruptors in China. This paper concludes with recommendations on some of the available investment options for a bearish investor in the Chinese real estate market.
Thesis Supervisor: Randolph B. Cohen Title: Associate Professor of Finance
~II
(This page intentionally left blank.)
Acknowledgement
I would first like to thank my thesis advisor Dr Randolph Cohen from the MIT Sloan
School of Management for his guidance throughout the process that has made this thesis possible.
I have benefit greatly from the idea generation process and his lecture on Investment. His advice
has been truly invaluable for my future career development and analytical think process.
Special thanks to Dr Huang YaSheng for his time and advice in many after classroom discussion and his insights to the Chinese economy and the real estate sector.
I also want to thank all my friends and I am forever grateful with the friendship we have
built throughout these years.
Finally, I would to express my most sincere gratitude to my family, in particular my parents, my sister, and my fiancee for their unconditional love. I cannot possibly achieve what I
have without your support.
Table of Contents
Acknow ledgem ent ... 5
. Introduction...7
A. Historical Developm ent ... 7
B. Sim ilarities with the Chinese A-Shares M arket ... 10
C. Government Policies ... 11
D. Foreign Investm ent ... 13
. Current Situation ... 15
A. Com parison with Japan and US ... 16
B. W hat is a bubble ... 18
C. National Level ... 19
D. Local Level ... 25
ill. A New Frontier - Affordable Housing ... 38
A. Affordable Housing Categories ... 39
B. Construction Starts ... 41
C. Financing ... 44
D. Challenges ... 47
E. Related Policies ... 48
F. Potential Im pact... 49
IV. Opportunities to Property Developers... 53
A. Incum bent Players - China Vanke... 54
B. Potential Disruptor - BBM G Corp ... 58
V. Recom m endation...62
VI. Conclusion ... 65
VI. Bibliography ... 67
I.
Introduction
A. Historical Development
The formation of China's real estate market was started from the land reform policy in 1949 and a redistribution of land ownership in China. Traditionally lands were owned by the State, and the government had the ultimate right to determine its usage and any further redistribution. Private developers and households can only occupy the land through a very long lease. Before the economic reform in 1978, welfare housing was the predominate housing system in China. The government and state owned enterprises (SOEs) were required to provide basic social welfare to the employees and their families, including housing,
medical care and education.
However such social welfare system added immense financial burden on the government and the SOEs. In addition, it created additional layers of inefficiencies and inflexibilities in the system and there were simply no other alternatives. In 1978, the Chinese government executed a nation-wide economic reform, which included a highly important reform on land ownership. Ordinary people were allowed to own their property. In 1980, the establishment of Beijing Property Development Company marked the official beginning of the property market in China. By 1987, land use rights for property development were sold via a public auction in Shenzhen, the first property auction to the public in China. In
1991, Shanghai was the first city to create a central provident fund system in China.
Between 1992 and 1993, other cities began to reform their housing system and the State Council initiated the "Anju Project" to construct more affordable housing to the public.
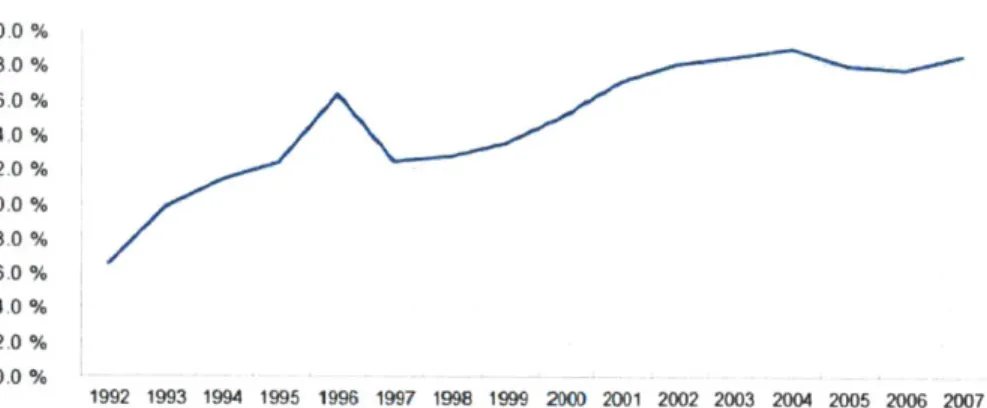
Figure 1.1 showed the strong increase in real estate investment in proportion to the total fixed investment. 200 % 18.0 % 16.0 % 14.0 % 12.0 % 10.0 % 8.0 % 6.0 % 4,0% 2.0 % 0.0 % 1992 1993 1994 1995 1996 1997 1998 1999 2000 2001 2002 2003 2004 2005 2006 2007
Figure 1.1 Proportion of Real Estate Investment to Total Fixed Investment (1992-2007) Source: National Bureau of Statistics, PRC
25.0% 20.0% -- -15.0% ---10.0% 5.0% - --- --- ---5 0 -- - - - -- - - - -- - ----0.0% , , - , , , " 'I 1992 1993 1994 1995 1996 1997 1998 1999 2000 2001 2002 2003 2004 2005 2006 2007 2008 -5.0%
---Figure 1.2 Inflation rate in China (1992-2008) Source: International Monetary Fund
Over investment in the Chinese real estate market together with other externalities led to high inflation in the 1990s (Figure 1.2). Funds flowing into the real estate market became a heavily watched sector for monitoring China's inflation. In 1997, negative growth in real estate investment and poor economic performance in surrounding Asian economies during the Asian financial crisis eventually tamed the high inflation era in China.
Before 1999, most Chinese residents still relied on the free welfare housing system provided by the government or SOEs. In March 1998, Premier Zhu Rongji announced a series of housing reforms, including the end to traditional welfare housing system and encouraged workers to either rent at the market price or to purchase their own properties with a one-time government subsidy. All vacant residential units after January 1, 1999 will no longer be allocated, but to be purchased. To complement with housing reform, Chinese banks began to offer home mortgages to purchasers. These reforms promoted the growth of private housing market and put an end to the historical welfare housing system in China. Capital investment and construction in the Chinese property sector recorded tremendous growth. At the turn of the millennium, investment in Chinese property development reached RMB 401 billion and 410 million square meters of residential housing projects were constructed, an increase of 10% and 19.6% respectively from the level recorded in 1998. In 2001, the Department of Housing and Real Estate of the Ministry of Construction reported that over 80 percent of the original allocated public housing had been sold and confirmed the
official start of private housing ownership in China.
During the same period, urbanization became a major movement in China. Rising income together with urbanization movement created strong demand for urban housing, particularly along the coastal cities. Between 1997 and 2002, the urbanization rate in China grown from 31.9% to 39.1% and the urban population jumped from 394.5 million to 502.1 million. Improving disposal income also created greater demand for capital investment outlets. Historically, the two major investment channels in China were the equity market and the real estate market. The high volatility and stock market crash in 2001 made real estate a more attractive alternative for investment. The improvements in capital availability via bank
mortgages and low interest rate encouraged more capital towards the Chinese property market. In addition to traditional cultural biases toward home ownership, China witnessed strong and stable growth in real estate investment and its proportion in the total fixed investment starting from 2001 surpassed its historical heights in 1996.
Investment into real estate development recorded RMB 2.53 trillion in 2007, an increase of 30.2% from 2006, and residential property attributed 71% of the total investment. During the same period, the growth in residential projects supply was uneven and only completed 478 million square meter of residential sites, a mere 5% increase over 2006. The available area for sale in fact has fallen to 67.6 million square meter, a decrease of 16.6%. With strong increase in demand but limited supply, property prices in 70 major cities increased by 7.6%.
B. Similarities with the Chinese A-Shares Market
China has completed a total of 7.3 billion square meter of floor space over the past 5 years. While the sheer scale is truly enormous, it is important to note that only 45% of that is commodity building and 55% of that is non-commodity building. Only commodity building are tradable and the remaining 55% are not tradable. They are either state owned, non transferable or simply having no price. Therefore, the supply of properties in China is highly controlled by the State, a common phenomenon shared by the Chinese A-share market. In
2006, the non-tradable shares contributed 60% of the total market capitalization. The
Chinese A-share market was deflated as many of these previously non-tradable shares were converted into tradable shares. The Chinese stock market began to stabilize only when a quota was placed on the sale of the newly converted shares. The same effect can potentially happen to the Chinese property market if there is a dramatic increase in real estate supply.
As the non-tradable properties are largely governed by the Chinese government, the State can have a substantial impact to the property price by tuning the supply the market.
C. Government Policies
Learning from its overheating experience in the 1990s, the government responded proactively in 2003 to the strong surge in the real estate prices. A number of tax and regulation policies were implemented to strengthen the government's control on property prices. In 2006, the Chinese government announced six policies aimed to balance the supply and demand structure of the housing sector and encouraged the development of small and medium size properties for the mass market. However, these efforts were unable to stabilize the housing prices and the Chinese property continued its upward trend. As a result, more tightening policies were released in 2007 by raising the lending rates six times to increase the borrowing cost of mortgages to 10% over the benchmark interest rate. In addition, in order to target the speculators of the real estate market, the initial down payment requirement for second home mortgage application increased to 40% and real estate projects required an initial capital of 35% for loan application. In 2008, the Chinese government further increases the supply of the property market by regulating the accumulation of land reserves among the real estate developers. This policy encouraged quicker development of land usage. Idled land that has been underutilized or abandoned for over two years after purchase will be confiscated by the government without compensation. The payment schedule for auctioned land is also severely shortened from several years to within one year. 50% of the premium is required to pay upfront (100% in some cases) and the remaining will be paid in the next twelve months after the auction date. The Land and Resources Bureau also investigate the
land hoarding behavior of certain developers and once proven, it will instruct banks to stop lending to these targeted developers.
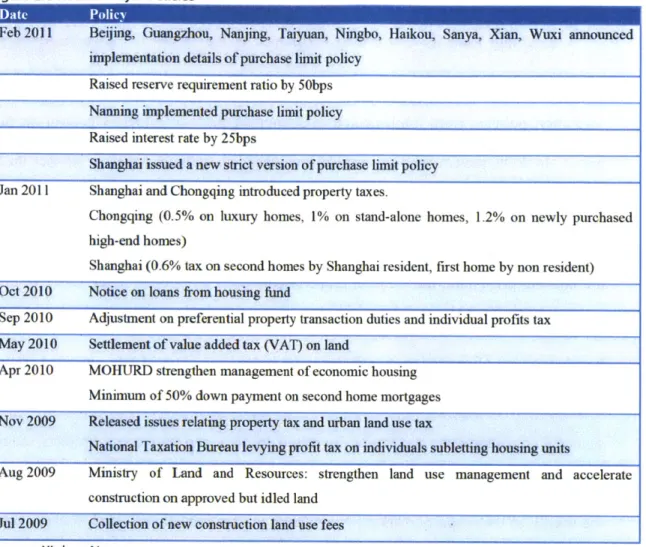
Figure 1.3 Recent Major Policies
Feb 2011 Beijing, Guangzhou, Nanjing, Taiyuan, Ningbo, Haikou, Sanya, Xian, Wuxi announced implementation details of purchase limit policy
Raised reserve requirement ratio by 50bps Nanning implemented purchase limit policy Raised interest rate by 25bps
Shanghai issued a new strict version of purchase limit policy Jan 2011 Shanghai and Chongqing introduced property taxes.
Chongqing (0.5% on luxury homes, 1% on stand-alone homes, 1.2% on newly purchased high-end homes)
Shanghai (0.6% tax on second homes by Shanghai resident, first home by non resident) Oct 2010 Notice on loans from housing fund
Sep 2010 Adjustment on preferential property transaction duties and individual profits tax May 2010 Settlement of value added tax (VAT) on land
Apr 2010 MOHURD strengthen management of economic housing Minimum of 50% down payment on second home mortgages Nov 2009 Released issues relating property tax and urban land use tax
National Taxation Bureau levying profit tax on individuals subletting housing units
Aug 2009 Ministry of Land and Resources: strengthen land use management and accelerate construction on approved but idled land
Jul 2009 Collection of new construction land use fees
Source: Xinhua News
The Central Government announced the following Eight Measures on April 11, 2010 in reaction to the strong growth in housing prices:
e To hold local governments accountable for housing development and housing price
control
* To increase the construction of affordable housing
* To implement stricter tax measures; transfer of housing bought in less than five years will be charged at full transaction amount
* To tighten credit, 60% down payment for second time home buyers and 1.1 times PBOC base rate is to be charged
* To monitor local land supply, 70% of the land supply is to be used for small sized commodity housing and public housing
* To restrict home purchase of non-local residents in municipalities, provincial capital cities and cities where housing prices have increased most rapidly
* Local governments to set targets for controlling the home prices
e To utilize media to educate people of housing consumption
D. Foreign Investment
China released provisions on foreign investment in 1995 and divided into four categories: "encouraged", "limited", "allowed" and "forbidden". Real estate was included in
the Catalogue for Guiding the Industries Using Foreign Investment in 1997 as the "limited"
category. Foreign capital can invest via joint ventures, but not wholly owned, into the following areas: land development, construction and operation of high-grade hotels, commercial office buildings, villas, golf courses, and national tourist areas. In 2006, regulations on foreign capital investment into domestic property sector were further refined and clarified. Together with the Ministry of Commerce, the announcement specified the approval, registration, transfer and acquisition process and the investment value, the enterprise types and the proportion of registered assets. Regulations on foreign exchange
account in China's property sector were also released in 2006. Policies were strengthened in regulating foreign capital from speculating the Chinese real estate market and the funds in local FX account were banned from domestic property investment. As a result, foreign capital investment in domestic real estate market is USD 17.1 billion, attributed merely 4.7% of the total investment in real estate, representing slightly above one-fifth of the total foreign investment capital. Yet, more than 300 joint ventures with foreign investments were created in 2007 to participate in the Chinese local property market.
11.
Current Situation
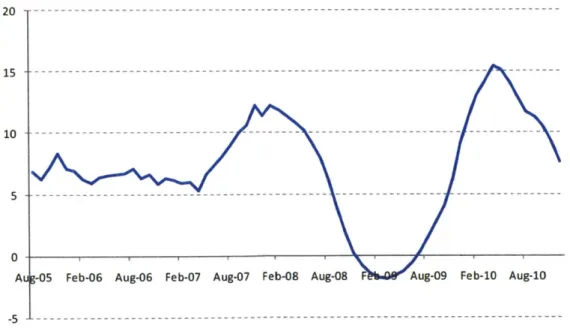
In response to one of the worst global financial crisis in 2008, China implemented an aggressive RMB 4.0 trillion (US$586 billion) stimulus package on November 10, 2008. Between November 2008 and April 2010, a total of RMB 13.7 trillion (USD 2.0 trillion) was injected into the economy. The lack of full convertibility of Reminbi made most of the spillover internalized within China. Liquidity flooded into the only three channels - stock market, real estate market, and bank deposit. Approximately RMB 6 trillion are still within the banking deposit with RMB 4 trillion invested in infrastructure projects. While the remaining 25% of liquidity is unclear, and many believed it entered the real estate market in China. Between 2008 and 2010, the housing price released by the National Development and Reform Commission
confirmed an annual double digit growth across 70 major cities in China (Figure 2.1).
Aug-09 Feb-10 Aug-10
Figure 2.1 Housing Price Growth in 70 Major Cities in China
Source: National Development and Reform Commission, Bloomberg
A. Comparison with Japan and US
Comparison with Japan
Okina et al (2001) defined the Japanese "bubble period" between 1987 and 1990 with the following four clear characteristics:
* Marked increase in asset price
" Expansion in monetary aggregates and credit (low interest rate for an extended period of
time)
e Overheating economy
e Stable CPI inflation in parallel with the expansion of asset prices and a long adjustment
period after the peaking of asset prices
Japan had strong economic fundamentals in the 1980s. The yen was appreciating on the back of large trade surplus and the banking system was deregulated and began to lend aggressively. The tax system and regulations was favorable towards accelerating the rise in land prices. The era was characterized by overconfidence and euphoria that asset prices in Japan will continue to rise forever. There was also an overconcentration of economic functions in Tokyo, the only dominant center in Japan.
Comparison with US
After the dot-com crisis at the turn of the millennium, US maintained a very low
interest rate environment for an extended period of time. We have witnessed a sharp increase in loose lending practice and large amount of subprime and questionable loans made at
beginning of 2006. Subprime loans became very widespread and one in every five mortgages is a subprime mortgage.
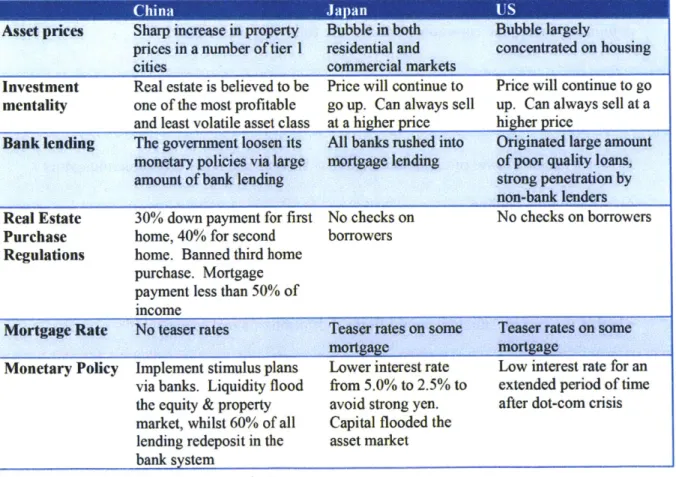
The comparison with the bubble period experienced in Japan and US showed China indeed shared some similarities and differences. While China experienced both a sharp increase in asset price and an expansion in monetary easing, whether the economy is overheated or not is still controversial. There is no poor lending practice that was penetrated into the mass market as witnessed in Japan and US and the leverage level is low. Therefore, China exhibited some unique properties that we cannot claim it fits the characteristics of the bubble period experienced by Japan or US. The table below summarizes the similarities and differences between China and Japan and US across various areas (Figure 2.2).
Figure 2.2 Similarities and Differences between China and Japan & US
Asset prices Sharp increase in property Bubble in both Bubble largely
prices in a number of tier I residential and concentrated on housing
cities commercial markets
Investment Real estate is believed to be Price will continue to Price will continue to go mentality one of the most profitable go up. Can always sell up. Can always sell at a
and least volatile asset class at a higher price higher price
Bank lending The government loosen its All banks rushed into Originated large amount
monetary policies via large mortgage lending of poor quality loans,
amount of bank lending strong penetration by
non-bank lenders
Real Estate 30% down payment for first No checks on No checks on borrowers
Purchase home, 40% for second borrowers
Regulations home. Banned third home
purchase. Mortgage payment less than 50% of income
Mortgage Rate No teaser rates Teaser rates on some Teaser rates on some
mortgage mortgage
Monetary Policy Implement stimulus plans Lower interest rate Low interest rate for an via banks. Liquidity flood from 5.0% to 2.5% to extended period of time the equity & property avoid strong yen. after dot-coi crisis market, whilst 60% of all Capital flooded the
lending redeposit in the asset market bank system
B. What is a bubble
There is no official definition of a real estate bubble. American economist Robert Shiller interpret as "a bubble occurs when exaggerated expectations of future prices increase unusual demand either by people who fear being priced out of a market or by investors hoping to make a lot of money fast. A bubble is a self-fulfilling prophecy for a while, as successive rounds of buyers push prices higher and higher. But the willingness to pay higher and higher prices in fragile: It will end whenever buyers perceive that prices are no longer going up. Hence bubbles carry the seeds of their own destruction. Only time is needed for bubbles to end." The definition according to Stiglitz (1990) is "there exists a bubble if house prices are high today because of market participators expect that house prices are higher tomorrow and if the fundamental value at the same time cannot justify such price." Both definitions shared the common ground of the following elements:
1) Rapid increase in property valuation chased by unusual demand and expectations
2) Elements of speculation behavior
3) Unsustainable level of valuation relative to income and other economic indicators
4) An eventual decline
Due to the reason that the last element of the definition has still not been witnessed, this paper analyzes the arguments and the counter arguments of both sides in determining whether the current situation would fit the definition of a real estate bubble.
C. National Level
The affordability ratio (housing price divided by household income) on a national level in China is 6.9x, which is similar to other international level such as 7. 1x in London and 7.0x in New York. Supply/demand ratios and investment capital flow on a national level suggest mix arguments on speculating whether the Chinese residential property market is a bubble or not. National numbers are too high level and can subject to a number of mix interpretations. The following summarizes the arguments of both sides.
Arguments for it is bubble
1) Unprecedented volumes of investment
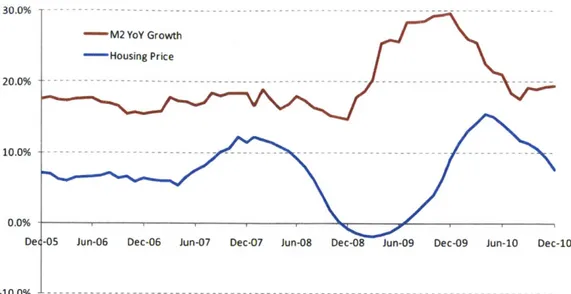
The exponential growth in loan growth and M2 growth created unprecedented volumes of investments into the Chinese real estate market. As of Dec 2010, M2 already reached RMB 72.6 trillion, an increase of 19.7% from last year, and new loan has
reached RMB 9,590 billion and RMB 7,950 billion in 2009 and 2010 respectively. This excess liquidity is one of the major factors contributing to the strong growth in housing prices. While the historical correlation between M2 and real estate prices has been low, it was greatly increased after the Chinese government implemented its monetary policy in stimulating the economy and M2 growth became an important indicator of the real estate price movement. Figure 2.3 shows the recent trend and correlation between property prices and M2 growth. The support for property price growth will be reduced as growth in money supply gradually reverts to historical levels.
30.0%
2 0 .0 % - - - - - - -
-0.0%
De -05 Jun-06 Dec-06 Jun-07 Dec-07 Jun-08 Dec-08 Jun-09 Dec-09 Jun-10 Dec-10
-10.0%
Figure 2.3 Money Supply (M2) and Property Prices
Source: Bloomberg, National Development and Reform Commission
2) Supply outpaced demand
The total amount of housing new starts between 4Q2009 and 3Q 2010 is 1.28 billion square meter. Given pre sale normally start after 3 - 9 months after construction
starts, it translates into approximately 0.8 billion - 1.0 billion square meter of new supply
in 2011. In addition to the 2011 construction starts that could be launched, according to Morgan Stanley estimates, the residential property supply is expected to increase 38% in 2010 and 23% in 2011. This is equivalent to a total of 1.23 billion square meters of residential area by 2011. In fact, nearly every region in China already witnessed over 50% increase in new construction started in 2010 and portion of that will be converted into new supply in 2011.
The excessive supply is further exacerbated by the acceleration in developing idle lands. Between 1999 and 2009, there are 3.45 billion square meter of land sold while only 2.27 billion square meters are developed. The new regulation of confiscating lands
idled for two years with no compensation forced the remaining 1.18 billion square meter to speed up its development.
At the same time, residential property demand is expected to stay flat in 2010 and
2011. Morgan Stanley estimated the demand for residential property will be 920 million
square meter in 2010 and 850-900 million square meter in 2011. This is due to the unfavorable policies homebuyers and potential tax laws in consideration.
Residential supply has outpaced demand to a level similar to what we have seen in 2008 with an expected shortfall of over 25% in 2011 (Figure 2.4). Therefore, with the exception of a few cities, most regions in China will feel the pricing pressure.
(mil sqm) Demand/Supply 1,400.0 --- 140% 1,200.0 --- --- --- 120% 1,000.0 --- --- --- --- --- --- 100% 800.0 --- --- --- -- 80% 600.0 --- - --- - -- -- 60% 400.0 --- --- 40% 200.0 --- - - -- - - - - -- 20% -- 0% 1999 2000 2001 2002 2003 2004 2005 2006 2007 2008 2009 2010E2011E
o Supply IIDemand -Demand/Supply
Figure 2.4 China Property Residential Supply and Demand Source: CEIC, Morgan Stanley Research
Arguments for it is NOT a bubble 1) Strong demand
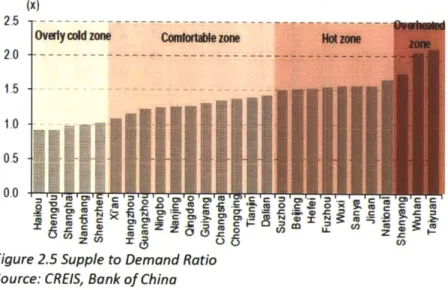
Despite an expected 60% growth in housing supply in 2011, the demand continues to outstrip supply in many tier 2 and tier 3 cities. Between 1990 and 2010, the data from Bloomberg revealed the disposal income of urban household has jumped from RMB 1,510 to RMB 19,109 and recorded an average annual growth rate of 13.6%. The increase in disposal income provides strong demand for the large inventory supply. While the national supply to demand ratio has risen to 1.65x, the data from Bank of China below displayed the supply to demand ratio for cities such as Chengdu and Haikou is below 1, translating a continue supply shortage among these cities (Figure 2.5). Urbanization continued to provide strong housing demand for most urban cities in China. However, the impact of housing oversupply may have a greater impact to Beijing, Tianjin, Wuhan, Taiyuan, Dalian and Suzhou.
(x)
Overty cold mon Conforbtle zone
2.0 ---1.5 1.0 0.5 0.0 CO CD r
Figure 2.5 Supple to Demand Ratio Source: CREIS, Bank of China
2) Affordability is not that unreasonable
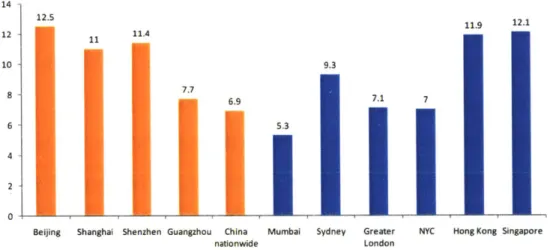
While the affordability ratios in tier I cities are substantially higher than the China nationwide figure, it is still within a reasonable range relative to other international cities. Beijing, Shanghai and Shenzhen are the epicenter of China's growth engine and the affordability ratio is in line with Hong Kong and Singapore. Figure 2.6 displays the affordability comparison across other major cities published by JP Morgan.
14 12.5 11.9 12.1 12 11.4 10 9.3 8 . 6.9 7.1 7 6 5.3 4 2 0
Beijing Shanghai Shenzhen Guangzhou China Mumbai Sydney Greater NYC Hong Kong Singapore
nationwide London
Figure 2.6 Comparison of Housing Price / Household Income Ratio Source: JP Morgan Research
3) Low percentage of loan to value
China maintained strict lending practice in underwriting bank mortgages. Down payment for first home is 30%, second home is 40% and there is currently a ban on third home purchase. Mortgage payment is also limited to 50% of income. As a result, between 2002 and 2009 mortgage issuance only made up to 34% of the total value of residential property sold. Given the recent high price, people need to borrow more and the recent new lending has leveled up to 70% of home value, but the overall national
average is within 50%. Such low level of mortgage loan to value ratio provides sufficient home equity buffer in case of a drop in property prices. As the national average of home equity value is greater than 50%, it also safeguards against downward spiral caused by distressed selling and further foreclosures experienced in US between 2008 and 2009. 4) Level of leverage is within control
The level of leverage in China is still substantially lower than the bubble period experienced by Japan and US. The total debt in the private sector in China has been steady and only rose to 110% of GDP after the stimulus plan package. In comparison, the credit growth in Japan was 9% per year and credit to private sector was close to double the GDP of Japan in 1991. Credit growth in US moved from 3% in 2000 to 7% annually between 2002 and 2007. The total debt reached 205% of GDP in 2007. Within
five years before the bust of the bubble, both US and Japan increased their leverage levels
by 40%. In contrast, the level of leverage is still substantially lower in China. 5) Pre-emptive government policies
Unlike the taxation and regulations in Japan and US during the bubble era that was biased towards real estate price appreciation, the Chinese government is proactive in taking pre-emptive actions in curbing its inflating housing bubble. In addressing the affordability issue for lower income households, China is building 10 million units of affordable housing in 2011, up from its 5.9 million units in 2010, and ramps up the construction starts of affordable housing to 30% of the total construction starts in China. The development of affordable housing is a highly focus subject in the 12th Five Year Plan in October 2010.
D. Local Level
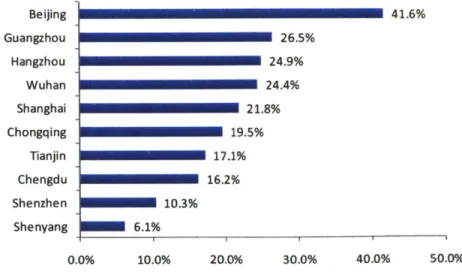
While the average property price over major 70 cities published by National Development and Reform Commission from 2007 to 2010 rose 7.2% annually, it did not fully capture the rapid pace of price increase in the tier 1 cities. KnightFrank published the primary residential price growth for the top 10 cities doubled between 2007 and 2010 (Figure
2.7). In fact, Beijing recorded 41.6% year-on-year price jump within just one year, followed by Guangzhou (26.5%) and Wuhan (24.4%) (Figure 2.8).
220 200 180 160 140 120 100 ''''''''''*
Jan-07 Jul-07 Jan-08 Jul-08 Jan-09 Jul-09 Jan-10 Jul-10
Figure 2.7 Primary residential price trend and YoY growth (ten major cities) Source: KnightFrank, Beijing Holdways
Beijing 41.6% Guangzhou 26.5% Hangzhou 24.9% Wuhan 24.4% Shanghai 21.8% Chongqing 19.5% Tianjin 17.1% Chengdu 16.2% Shenzhen 10.3% Shenyang 6.1% 0.0% 10.0% 20.0% 30.0% 40.0% 50.0%
Figure 2.8 Property price year-on-year growth in 2010 (ten major cities) Source: KnightFrank, Beijing Holdways
1) Beijing
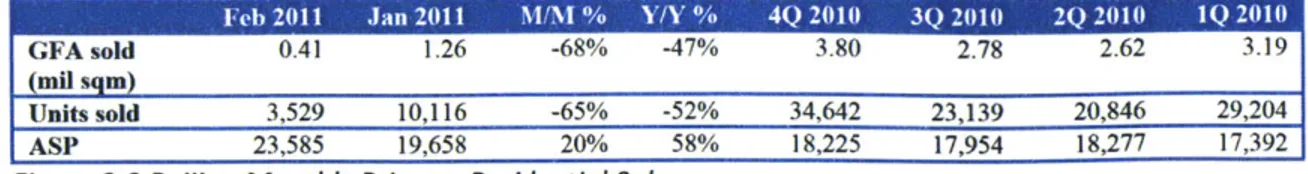
Beijing, China's capital city with 22 million population, is a good case study because it has the strictest housing regulations and also one of the most expensive housing prices among all other cities in China. New residential projects clustered around 5th and 6th Ring Roads, such as Greenland and Greentown, are priced around RMB 15,000 per square meter while luxury apartment in city center are priced over RMB 100,000 per square meter. As of December 2010, while the city-wide average price of Beijing reached RMB 20,694 per square meter, the average price for urban area in Beijing is RMB 29,349 per square meter and the suburban area is RMB 15,236 per square meter. On February 17, 2011, Beijing announced the most stringent HPR policies and requires 5 years of local residency proof in Beijing in order to qualify for home purchase. These real estate cooling measures together with credit tightening policies had a significant impact to the real estate transactions in Beijing. As non-local purchase historically contributed close to 50% of the past transactions, this announcement caused a 68% drop of sales volume in a single month (Figure 2.9). February recorded a 20% price increase mainly due to the low price baseline in January as affordable housing contributed 20% of January's transactions.
-Mth avg vo (mil sem2
3.0 2005 e 1 54 2007 1 28 20092010 v 1 sq 25,000 2006 =1 40 2008 0 73 2 5 Z5 20,000 2,0 15.000 15 1.0 10,000 0.5 5,000
Jan-05 Jul.05 Jan-O6 Jul-06 Jan-07 Ju-07 Jan-08 Jul-08 Jan-09 Jul.09 Jan-10 Jul-10 Jan-i1 - Primary sales vl (L) ---- MIhly Avg vol (L) -- 9- ASP (R)
GFA sold 0.41 1.26 -68% -47% 3.80 2.78 2.62 3.19
(mil sgn I
Units sold 3,529 10,116 -65% -52% 34,642 23,139 20,846 29,204
ASP 23,585 19,658 20% 58% 18,225 17,954 18,277 17,392
Figure 2.9 Beijing Monthly Primary Residential Sales Source: Centaline, JP Morgan
Inventory Analysis
Due to the announcement of policies, Beijing has buildup significant inventory as transaction volume has continued to decrease. As of February 2011, the total GFA available for sale in Beijing reached 12.03 million square meter. Using the February demand of 0.43 million square meter, the currently inventory buildup would take 28.3 months. Using the average demand for the past twelve months, 1.00 million square meter / month, the inventory buildup would take 12.0 months to deplete. This is similar to the level in 2007 before the market crash, and higher than the average 8 to 9 months commonly seen in other years.
Affordability
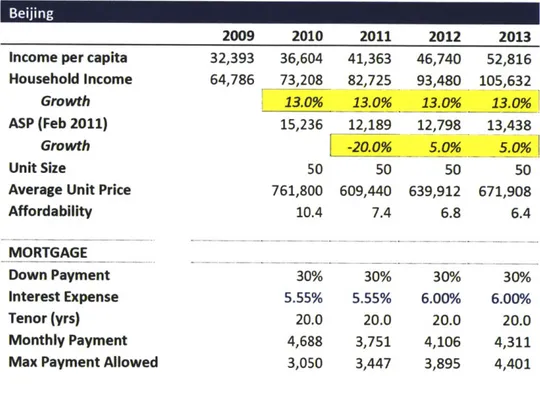
To better understand the affordability of the housing market in Beijing, the calculation in Figure 2.10 assumed an average household with two income earners making RMB 73,208 a year in Beijing. In order to make their first home purchase in a suburban area, they must comply with the new housing regulations of 30% down payment and mortgage payment of not exceeding 50% of their income. For a 50 square meter unit, the mortgage payment, assuming 20 years tenor and 5.55% interest, requires a monthly payment of RMB
4,688, which is 54% higher than their maximum allowed level. As a result, they can only
afford a maximum unit size of 32 square meter in 2010. Assuming their income continues to grow at 13% p.a., the historical 5 year CAGR, an average household can afford an 50 square
meter apartment in 2013 only if the property price drops 20% in 2011 and maintain minimal growth close to inflation for the next two years.
While this is not an official definition of housing bubble, the prices in Beijing show signs of overheating and have grown beyond the reach of a typical household. Inventory build also suggested Beijing is an overheated, over-supply city. The large drop in transaction volume after the release of new housing regulations suggests the number of investors or speculators may outnumber the actual end users in the market.
Figure 2.10 Affordability Scenario
2009 Income per capita
Household Income
Growth
ASP (Feb 2011)
Growth
Unit Size
Average Unit Price Affordability MORTGAGE Down Payment Interest Expense Tenor (yrs) Monthly Payment Max Payment Allowed
Source: CEIC 32,393 64,786 2010 2011 2012 2013 36,604 41,363 46,740 52,816 73,208 82,725 93,480 105,632 13.0% 13.0% 13.0% 13.0% 1 15,236 12,189 12,798 13,438 -20.0% 5.0% .0%! 50 50 50 50 761,800 609,440 639,912 671,908 10.4 7.4 6.8 6.4 30% 30% 30% 30% 5.55% 5.55% 6.00% 6.00o 20.0 20.0 20.0 20.0 4,688 3,751 4,106 4,311 3,050 3,447 3,895 4,401 28 1 P a g e .... -.- ... ....
2) Shanghai
Shanghai has the highest level of average income and also the most expensive average housing prices in China. With a 19 million population, the income per capita reached RMB 32,403 in 2009 with a 12% CAGR from 2005 to 2009. As of December 2010, while the average housing price in Shanghai is RMB 25,080 per square meter, the average prices in urban areas is RMB 39,301 per square meter and the suburban areas is RMB 20,644 per square meter. On January 31, 2011, Shanghai announced the city level "Eight Point Measures" and real estate tax (RET). Along with other anti-speculation measures, Shanghai was the first batch of cities to levy a 0.4% property tax on new purchases and 0.6% if the purchase exceeds twice the residential housing prices of the previous year. Primary sales volume dropped 69% from January to February to the lowest level since 2006. If excluding affordable housing numbers, the sales volume in fact dropped 83% on a monthly basis. ASP also dropped 4% between January and February 2011. The large drop in transaction volume with relatively small dip in prices suggests many developers are in the mode of "hold and see" and delayed existing projects.
GFA pre-sold, mn sq m
4.0 ~ Mth avg vol (mil sgm) 18,000
3.5 - 2005 = 1,5 2008 1 4 - 16,000 3.0 - 2006 = 1,78 2009 2.2 - 14,000 5 2007 = 2 2 2010 =1,3 -12,000 2.5 - 10,000 2.0 800 1.5 6,000 1.0 4,000 0,5 2,000 0.0 0
%mnuysales vol - l~h avg ASP (R)
GFA sold 0.52 1.70 -69% -13% 5.29 4.32 3.05 3.06
(mil sgm)
Units sold 5,501 16,294 -66% -5% 48,804 40,309 31,993 29,056
ASP 14,937 15,525 -4% 22% 13,995 12,746 13,794 12,494
Figure 2.11 Shanghai Monthly Primary Residential Sales Source: Centaline, JP Morgan
Inventory Analysis
Shanghai has buildup some level of inventory as transaction volume dropped in 2011. As of February 2011, the total GFA available for sale in Shanghai reached 6.29 million square meter. Using the February demand of 0.52 million square meter, the currently inventory buildup would take 12.1 months. Using the average demand for the past twelve months, 1.35 million square meter / month, the inventory buildup would take 4.7 months to deplete. While this level is similar to the level witnessed in 2007, the short turnaround cycle suggest the strong demand and under supply situation in Shanghai. The average inventory turnover level between 2006 and 2009, excluding 2007, has always been around 2 to 3 months.
Affordability
Despite the average income level of Shanghai is very similar to Beijing, the average price per square meter is 35% higher, thereby creating a larger discrepancy between average household income and mortgage payments. In 2010, the required monthly payment of a 50 square meter unit doubled the maximum level of an average household. Even if the property price dropped 30% in 2011 and remained flat for another two years, the required monthly mortgage payment is still higher than the maximum allowed level, despite a 12% continuous
gain in income. In the scenario below, an average household can only afford a 30 square meter unit only if the housing price dropped by 30% in 2011.
The affordability in Shanghai is worse than Beijing and belongs to the overheated category. While industry reports suggests many potential buyers stepped to the sidelines waiting to work out how to buy given the current measures, even the suburban areas remained out of reach for an average household. Shanghai displayed an overheated but under-supply city. In comparison with the large stockpile in Bejing, Shanghai implies the housing prices has potential to move further up supported by continuous strong demand in the market.
Figure 2.12 Affordability Scenario
Shanghai
Income per capita Household Income
Growth
ASP (Feb 2011)
Growth
Unit Size
Average Unit Price Affordability MORTGAGE Down Payment Interest Expense Tenor (yrs) Monthly Payment Max Payment Allowed
Source: CEIC 2009 32,403 64,806 2010 36,291 72,583 12.0% 20,644 50 1,032,200 14.2 30% 5.55% 20.0 6,352 3,024 2011 2012 2013 40,646 45,524 50,987 81,293 91,048 101,973 12.0% 12.0% 12.0% 14,451 14,451 14,451 -30.0% 0.0% 0.0% 50 50 50 722,540 722,540 722,540 8.9 7.9 7.1 30% 30% 30% 5.55% 6.00% 6.00% 20.0 20.0 20.0 4,447 4,636 4,636 3,387 3,794 4,249 311 P a g e
3) Hangzhou
Hangzhou is the capital city of Zhejiang province with close to 7 million population. As a tier 2 city, Hangzhou recorded tier 1 city housing prices. By allowing primary homebuyers in Hangzhou with over RMB 1 million annual income to move their residency to the city, Hangzhou recorded leading volume of land sales despite a much smaller population than Beijing, Shanghai and Guangzhou. Investments into residential real estate have been strong and reached RMB 70.5 billion in 2009 with a five year CAGR of 22%. The average price per square meter in Hangzhou in 2010 is RMB 18,082, with urban areas averaged RMB
23,874 per square meter and suburban areas averaged RMB 14,503 per square meter. On March 1, 2011, Hangzhou set a maximum level of mortgage to 70% of the property value for primary home purchase and 40% for second home purchase.
GFA, mn sq m
3.50 Monthly avg by yea (MM sqm)
05=16 07=18 09 =18 3.00 06=14 08=11 1 =12 25000 2.50 20000 2.00 15000 1.50 10000 1.00 0i50 5000 0.00 0 9 t 00 000 -, 0 -, , -,, GFA sold 0.09 0.29 -68% 117% 1.02 1.02 0.53 0.33 (mil sgm) Units sold 757 2,575 -71% -45% 8,896 8,957 10,366 8,877 ASP 25,992 23,119 12% 4% 22,729 23,177 21,542 20,992
Figure 2.13 Hangzhou Monthly Primary Residential Sales Source: Centaline, JP Morgan
Since the launch of the housing cooling measures, Hangzhou recorded a 68% drop in
GFA from January to February 2011. Yet, price recorded a 12% increase on a monthly basis.
Industry reports demonstrated that historically investors and speculators contributed a large portion of the property demand in Hangzhou. These investment demands disappeared after the launch of the anti-speculation measures, which drove down the total number of visitors at various real estate projects 30-50%! For example, 80% of the buyers in the Xiasha new development zone are comprised of non-local resident purchasers.
Inventory Analysis
Hangzhou has buildup one of the highest inventory levels in China as transaction volume plummet in 2011. As of February 2011, the total GFA available for sale in Hangzhou reached 3.05 million square meter. Using the February demand of 0.09 million
square meter, the currently inventory buildup would take 32.4 months. Using the average demand for the past twelve months, 0.26 million square meter / month, the inventory buildup would take 11.7 months to deplete. The large increase in supply is partially driven by a significant increase in number of projects reached presale standards in January.
Affordability
A typical household with two income earners in Hangzhou would make an average
household income of RMB 68,564 in 2010. This translates into a maximum level of mortgage payment of RMB 2,857 per month, over 50% lower than the existing level with a
70% mortgage value, 20 years tenor, and 5.55% mortgage interest rate. At the current level,
an average household can only support a 30 square meter unit. If the housing prices dropped
20% in 2011 and maintained a growth rate similar to inflation in 2012 and 2013, an average
household can began to afford a 50 square meter unit by 2013.
The ratios in fact are quite similar to Beijing and this suggests the real estate market in Hangzhou is overheated and a typical household cannot afford an average suburban apartment. The fact that a substantial amount of homebuyers are investors and speculators made the anti-speculation measures more effective. Therefore, Hangzhou as a tier 2 city belongs to an overheated, over-supply city. The significant decrease in buyer's interest made the Hangzhou property market vulnerable to a correction.
Figure 2.14 Affordability Scenario
Hangzhou
Income per capita Household Income
Growth
ASP (Feb 2011)
Growth
Unit Size
Average Unit Price Affordability MORTGAGE Down Payment Interest Expense Tenor (yrs) Monthly Payment Max Payment Allowed
Source: CEIC 2009 30,338 60,676 2010 2011 2012 2013 34,282 38,739 43,775 49,465 68,564 77,477 87,549 98,931 13.0% 13.0% 13.0% 13.0% 14,503 11,602 12,183 12,792 -20.0% 5.0% 5.0% 50 50 50 50 725,150 580,120 609,126 639,582 10.6 7.5 7.0 6.5 30% 30% 30% 30% 5.55% 5.55% 6.00% 6.00% 20.0 20.0 20.0 20.0 4,463 3,570 3,909 4,104 2,857 3,228 3,648 4,122 34 1 P a g e .. .... ... ..
4) Chongqing
Chongqing is an important economic hub located in the southwest part of China. It is one of the five national central cities and one of the four municipalities with over 33 million population. The average housing price in Chongqing is RMB 6,842 per square meter, while the average for urban areas is RMB 7,046 per square meter and the average for suburban areas is RMB 5,285 per square meter. After the anti-speculation measures, many developers postponed existing projects and led to a 58% decrease in primary property sales and 19% drop in price between January and February 2011. While the actual implementation details have yet to announce, many developers continued to wait and see.
Due to the recent policies, new housing projects set prices slightly below the Real Estate Tax threshold level or offer cash rebates that is equivalent to similar levels. Projects with prices higher than RET displayed much slower sales level. In addition, if the purchase is below 90 square meter, Chongqing require non-local commodity home purchasers to have a college degree in order to be eligible to move their residency to Chongqing.
GFA pre-sold, mn sqm
3.5 -8,000
Mthly avg vol (mil sgm) 2010 mth avi 1-8m s - ,
3.0 - 2006 = 0 9 2007 = 15 2.5 - 2008 = 0,9 2009=1 6,000 2.0 - -5,000 2.0-1.5 -- 8,000 1.0 -- -4,0006,000 1.5-0.5 0.0 000
Jan-06Jun-06 Nov- Apr-07Sep-07Feb-08 JukO8 Dec-08 May- Oct-09 Mar-10Aug-10Jan-11
06 09
u Chongqing kntihly vol -lely Avg -*- ASP (R)
GFA sold 0.69 1.64 -58% -38% 6.54 5.68 5.15 4.31
(mil sgm)
Units sold 7,722 18,260 -58% -36% 71,581 62,601 58,238 49,314
ASP 5,849 7,185 -19% 13% 6,714 6,028 5,677 5,000
Figure 2.15 Chongqing Monthly Primary Residential Sales Source: Centaline, JP Morgan
Inventory Analysis
Chongqing has accumulated a more sustainable inventory levels in China even though transaction volume dropped in 2011. As of February 2011, the total GFA available for sale in Chongqing reached 9.25 million square meter. Using the February demand of
0.69 million square meter, the currently inventory buildup would take 13.4 months. Using
the average demand for the past twelve months, 1.81 million square meter / month, the inventory buildup would take 5.1 months to deplete.
Affordability
Despite housing prices recorded 14% five year CAGR between 2005 and 2009, the affordability ratio of Chongqing remained healthy. Income per capita has also been increasing at a five year CAGR of 13% and the affordability ratio remained 6x to 7x. Under the recent stringent anti-speculation policies, an average household is able to afford a 50 square meter suburban unit if the housing prices remain flat in 2011. The maximum allowed mortgage payment is sufficient to cover a mortgage in 2011 in our scenario testing. As Chongqing aims to become the economic hub of the Southwestern part of China and to increase foreign trade and capital flow, the housing market in Chongqing still has further upside potential. Chongqing can be characterized as a tier 2 city that is not overheated, under-supply city.
Figure 2.16 Affordability Scenario
Chongqing
Income per capita Household Income
Growth
ASP (Feb 2011)
Growth
Unit Size
Average Unit Price Affordability MORTGAGE Down Payment Interest Expense Tenor (yrs) Monthly Payment Max Payment Allowed
Source: CEIC 2009 16,740 33,480 20 18,9 37,8 13. 5,2 10 2011 16 21,375 32 42,751 0% 13.0% 85 5,285 0.0% 50 50 264,250 264,250 2012 24,154 48,308 13.0% 5,549 5.0% 50 277,463 291,336 7.0 6.2 5.7 5.3 30% 5.55% 15.0 1,883 1,576 30% 30% 5.55% 6.00% 15.0 15.0 1,883 2,050 1,781 2,013 2013 27,294 54,588 13.0% 5,827 5.0% 50 30% 6.00% 15.0 2,153 2,275 37 P a g e
M11. A New Frontier - Affordable Housing
Affordable housing is the new frontier of the real estate market development in China and an important effort by the Chinese government to the tame the housing prices through an increase in supply. To balance the housing structure and to stabilize the speculative behavior on property prices, China is planning to invest RMB 1.3 trillion (USD 198 billion) to build subsidized homes for rent or sale to low income residents and committed to build 36 million units of public homes in five years. Affordable housing will make up close to one-fifth of the China's total real estate investment in 2011. To avoid potential cannibalization of land supply consumed by affordable housing and private housing, the Chinese government sold 1.86 billion square meter of residential land in 2010, an effective 142% increase over the 0.765 billion square meter sold in 2009 and 238% increase over the 0.547 billion square meter sold in 2008. In tier 1 cities where new land supply is limited, the government enforces stricter idle land confiscation and encourages more urban renewal projects. As real estate investment now contributed 10% of the GDP, China is determined to curb its rising inflation and property prices via the affordable housing projects. Affordable housing was introduced in 1993 as part of the housing reform policy and started to gain its significance in 2008.
A. Affordable Housing Categories
There are five major types of affordable housing in China targeting various low-income to marginal middle-low-income groups, separated into commodity housing and non commodity housing.
Commodity Housing Category
1) Economic housing
Economic housing is provided by the state-owned real estate companies to meet the housing demand of the marginal middle-income families with minimal 3 years of local residency status. The applicant income limit is RMB 22,700 or below for singles and family net worth of RMB 240,000 or below. Economic housing is distributed via allotment and priorities are given to households being relocated by urban settlement projects. The average living space is less than 10 square meter per capita and the price of economic housing is approximately 50% to 70% below the price of private housing. The ownership is transferable after a fixed number of years and became part of commodity housing.
2) Price-cap housing
Price-cap housing was introduced by the Central government in 2006 for the marginal middle-income families that is ineligible for economic housing. It was first introduced in Guangzhou and Beijing for middle-income households with annual income no higher than RMB 88,000 or a total net worth less than RMB 570,000. The average living space per capita is capped at 15 square meter. Price-cap housing constructions are opened to all developers through a tender process. The unit size is capped at 90 square meters and the unit price is around 50% to 60% of the price of similar private housing. Rather than categorized
as affordable housing, price-cap housing in fact is closer to the mass-end private housing. There is no government subsidizes but land revenue for local government is relatively lower than private housing. This new housing category is increasingly popular because it addresses the goal of stabilizing housing prices while require substantially less subsidies on land prices than economic housing. As a result, local governments have greater incentives to develop price-cap housing. The price-cap housing in Beijing, Tianjin and Jiangsu comprised 60% of the total price-cap housing sites in China. Price-cap housing units are tradable after 5 years of purchase.
Non-Commodity Housing Category
3) Low rent housing
In 1998, low rent housing was introduced by local governments to target the bottom
10% low-income household with local residency status who cannot afford a home purchase.
The income limit for low rent housing application is RMB 6,960 per person or household net worth less than RMB 150,000. The average living space is 7.5 square meter per capita. The local government subsidizes the rents of these low rent housing, which is often built by state-owned real estate enterprise or bought from the private developers. The rent level is approximately RMB 60 to RMB 150 per month in first tier cities and RMB 30 to RMB 60 per month in other cities. All non-commodity housings are not tradable and sublet is forbidden for low rent housing.
4) Public rental housing
Public rental housing was introduced in 2007-2008 due to the increasing housing demand from the large mobile workers population in urban cities. These mobile workers
lacks local residency status, with income that is over the requirements of low rent housing, but cannot afford economic housing. Public rental housing is mostly constructed by local government owned real estate companies and the unit size is capped at 60 square meter. Sublet is forbidden and the rental rates are at a discount to market rate.
5) Shanty town resettlement
Shanty town resettlement was the Chinese Central government effort to address the needs of shanty town occupants in Northern China. As of 2009, there were estimated 15.5 million families residing in squatters or slum areas in China. These resettlement homes are non commodity housing and they are not tradable. The land occupied is deemed as government use.
B. Construction Starts
The percentage of construction starts for these groups among the total construction starts jumped from 7% in 2005 to 18-20% in 2008-2009 and expected to further increase to
30-38% in 2010-2011. JP Morgan estimates the total affordable housing construction starts
reached 426 million meter square in 2010. Figure 3.1 shows the distribution and trend of new construction starts for affordable housing in China.
(mil sqm)
700 - Resettlement
600 - Low rent/ Public rent U Econ House 500 400 300 200 100 0 1999 2000 2001 2002 2003 2004 2005 2006 2007 2008 2009 2010E2011E
Figure 3.1 New Construction Starts for Affordable Housing in China Source: Ministry of Housing and Urban-Rural Development (MOHURD)
National Bureau of Statistics of China
Construction starts for affordable housing only began to pick up recently (Figure 3.2) and became a substantial portion of the housing market by 2011. Historically the development has been slow due to lack of incentives and a misalignment of interest with the local governments. Despite the Central government's promotion on affordable housing with the original goal of completing 3.9 million economic housing units and 5.9 million low-rent housing units between 2009 and 2011, the World Bank estimated only 62% commenced construction in 2009. Beijing achieved its 5 year plan and completed 30 million square meter of affordable housing, but Shanghai and Guangzhou only met 30% of its original 5 year plan targets. The lack of affordable land for construction is a major reason of the shortfall because local governments lacked the incentives to allocate more lands for affordable housing. In fact, 611 million square meter of land were planned for affordable housing but only 95 million square meter or 16% were actually supplied. In addition, the local governments also lacked the funding and commitment to initiate affordable housing
development. This can be seen in the deviation between the planned and actual spending on affordable housing between Central government and local government (Figure 3.3).
(miI sqm) 1,800 -8 Private Housing 1,600 -1,400 - * Affordable Housing 1,200 -1,000 800 -600 400 200 0~ 1999 2000 2001 2002 2003 2004 2005 2006 2007 2008 2009 2010E2011E
Figure 3.2 New Construction Starts for Affordable Housing vs Private Housing Source: Ministry of Housing and Urban-Rural Development (MOHURD)
National Bureau of Statistics of China
Figure 3.3 Affordable Housing Spending in 2009
Central government spending 49 55
Local government spending 118 39
Total overnment ndin 168 95
Source: Ministry of Housing and Urban-Rural Development (MOHURD) Soufun
The setback in 2009 made the Chinese government more determined to achieve its 2010 targets. The Central government sets its target at 3 million units of affordable housing,
2.8 million units of resettlement homes and 1.2 million units of rural redevelopment homes
for 2010. As of Sep 2010, close to 90% of the construction starts have commenced, an equivalent of 5.1 million units. Affordable housing will remain as an important sector for