HAL Id: hal-02549493
https://hal.archives-ouvertes.fr/hal-02549493
Submitted on 21 Apr 2020
HAL is a multi-disciplinary open access
archive for the deposit and dissemination of sci-entific research documents, whether they are pub-lished or not. The documents may come from teaching and research institutions in France or abroad, or from public or private research centers.
L’archive ouverte pluridisciplinaire HAL, est destinée au dépôt et à la diffusion de documents scientifiques de niveau recherche, publiés ou non, émanant des établissements d’enseignement et de recherche français ou étrangers, des laboratoires publics ou privés.
Chronostratigraphy of a 1.5
±0.1 Ma composite
sedimentary record from Colônia basin (SE Brazil):
Bayesian modeling based on paleomagnetic, authigenic
10Be/9Be, radiocarbon and luminescence dating
Quentin Simon, Marie-Pierre Ledru, André Oliveira Sawakuchi, Charly Favier,
Thays Mineli, Carlos Grohmann, Marco Guedes, Edouard Bard, Nicolas
Thouveny, Marta Garcia, et al.
To cite this version:
Quentin Simon, Marie-Pierre Ledru, André Oliveira Sawakuchi, Charly Favier, Thays Mineli, et al.. Chronostratigraphy of a 1.5±0.1 Ma composite sedimentary record from Colônia basin (SE Brazil): Bayesian modeling based on paleomagnetic, authigenic 10Be/9Be, radiocarbon and luminescence dat-ing. Quaternary Geochronology, Elsevier, In press, pp.101081. �10.1016/j.quageo.2020.101081�. �hal-02549493�
Chronostratigraphy of a 1.5±0.1 Ma composite sedimentary record from
Colônia basin (SE Brazil): Bayesian modeling based on paleomagnetic,
authigenic
10Be/
9Be, radiocarbon and luminescence dating
Quentin Simon1, Marie-Pierre Ledru2, André Oliveira Sawakuchi3, Charly Favier2, Thays D. Mineli3, Carlos H. Grohmann4, Marco Guedes4, Edouard Bard1, Nicolas Thouveny1, Marta Garcia1, Kazuyo Tachikawa1, Paula A. Rodríguez-Zorro2, ASTER Team1*
1CEREGE UM34, Aix Marseille Univ, CNRS, IRD, INRAE, Coll France, 13545, Aix en Provence, France 2ISEM, Univ Montpellier, CNRS, IRD,EPHE, 34095, Montpellier, France
3Universidade de São Paulo, Instituto de Geociências, 05508-080, São Paulo, Brazil
4Universidade de São Paulo, Instituto de Energia e Ambiente, São Paulo, Brazil
Corresponding author: Quentin Simon (simon@cerege.fr)
* Georges Aumaître, Didier L. Bourlès, Karim Keddadouche
Keywords
Peat and lake sediments, paleomagnetism, luminescence dating, radiocarbon, authigenic 10Be/9Be dating, deep drilling
Highlights
• A 52 m composite record from the Colônia basin is built from 5 sedimentary cores • The 1.5±0.1 Ma age-depth model is based on independent geochronometers
• Paleomagnetic and authigenic 10Be/9Be dating used in a Bayesian age-depth modeling
• XRF scanning of COL17c sediments reveal large-scale paleoenvironmental variations • The age of the Colônia basin formation is revised between 5.3 and 11.2 Ma
Abstract
We present a new 52 m composite record (COL17c) composed of five sedimentary sequences retrieved from the Colônia basin (Southeastern Brazil). The COL17c record is composed of two main sub-units deposited under different regimes: a peatland above ∼14 m and lacustrine sediments below. Sedimentary description and core scanning (MSCL and XRF) are first used to align individual cores in order to produce a nearly continuous composite record. We then established an original chronological framework based on radiocarbon, paleomagnetic, optically stimulated luminescence (OSL), post-infrared infrared stimulated luminescence at elevated temperature (pIRIR290°C) and authigenic 10Be/9Be dating. We describe the protocols used for each technique and discuss the positive and negative results, as well as their implications for proxy interpretation. In spite of negative results of some techniques, mainly due to the absence of adequate sample material, the multi-proxy approach used is essential to maximize the chances of obtaining a satisfactory age model for this unique continental sedimentary sequence. All valid chronological proxies, comprising
three AMS 14C ages, one pIRIR
290°C age, two paleomagnetic constraints and eight authigenic 10Be/9Be datum, are integrated within a Bayesian age-depth modeling to produce a 1.5±0.1 Ma chronology for the whole COL17c sequence. This age model represents the first long-term chronological estimate of sediments deposition in the Colônia basin. The record allows to refine the age of the Colônia basin formation between 5.3 and 11.2 Ma, much older than previously estimated from short sedimentary cores.
1. Introduction
Exploring long-term evolution of lowland rainforest from Southern Hemisphere is particularly challenging due to i) logistic complications in remote or politically unstable areas, ii) human impacts on highly populated regions and/or iii) scarcity of suitable sites with continuous sedimentation in a reduced land surface hemisphere. Long and continuous terrestrial records from the Southern Tropics are therefore quite rare. They are however essential to provide insights on continental climate and environmental responses to global climatic variations. For instance, record from eastern Africa lake Chala shows the effect of half precession cycles on monsoon dynamics over the past 25 ka (Verschuren et al., 2009). In Australia, the Lynch Crater record shows that tropical rainforest responded differently than temperate forest to glacial/interglacial cycles during the last 230 ka (Kershaw et al., 2007). In the high Andes, records from lakes Titicaca and Funza demonstrate the influence of the South American Summer Monsoon (SASM) on water column stratification and regional climate variations over Quaternary glacial/interglacial cycles (Torres et al., 2013; Fritz et al., 2007). In southeastern Brazil and western Amazonia, speleothem records show that seasonal moisture distribution was imprinted by precessional control on the SASM over the past 250 ka (Cruz et al., 2005, 2006; Cheng et al., 2013). Modern observations also demonstrate that southern Tropics receive additional rainfalls mainly related to extratropical sources during austral winter (Cruz et al., 2005, 2006; Ledru et al., 1993, 2009).
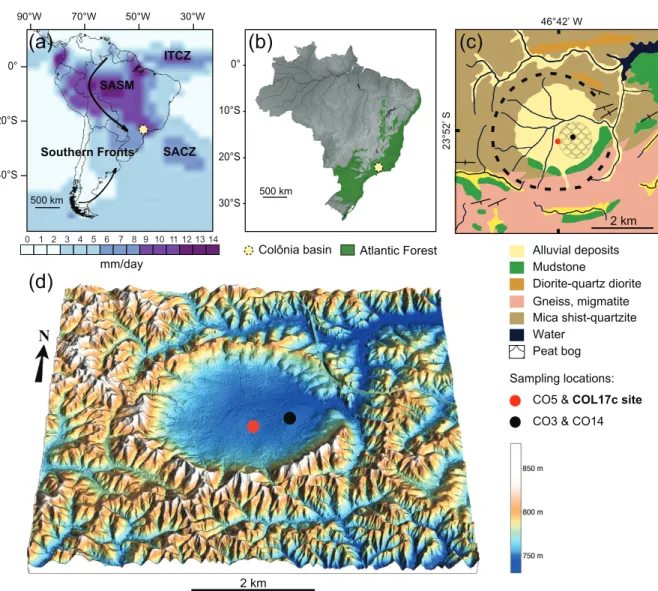
Long-term impact of hydrological cycles and air masses source changes on the Atlantic rainforest biodiversity have been investigated since 1989 when a first 7.8 m long sedimentary core (CO3) was recovered from the Colônia basin located in southeastern Brazil, near the city of São Paulo (Fig. 1). Pollen analyses show that changes in the forest expansion/regression phases were paced mainly by precession cycles, with significant modifications in the floristic composition of the rainforest between cycles, suggesting a strong
influence of the southern air masses on moisture distribution during glacial times (Riccomini et al., 1991; Ledru et al., 2005, 2009). In 2014, an International Consortium retrieved a 14 m long core covering the last 180 ka (CO14) from the Colônia basin (Ledru et al., 2015). First palynological results highlight different expressions of Marine Isotope Stages (MIS) 2 and 6 with changes in temperature likely paced by eccentricity while more complex patterns emerged for regional hydrological cycle, therefore differentiating neotropical rainforest behaviors during the last (MIS 2) and penultimate (MIS 6) glacial periods (Rodríguez-Zorro et al., 2020). In 2017, 2018 and 2019, the same consortium drilled five parallel holes from the center of the Colônia basin (Fig. 1), reaching a maximum depth of 52 m.
In this paper, we build a nearly continuous 52 m composite record (COL17c) from the 2017-2019 cores and propose the first age-depth model for COL17c sediments. In addition to the usual challenges faced for establishing reliable age models from lake sediments, the low sediment recovery and sedimentary disturbances during coring request the use of complementary and independent geochronometers. We use a multi-proxy approach based on paleomagnetic measurements, radiocarbon, authigenic 10Be/9Be dating, optically simulated luminescence (OSL) dating of quartz and post-infrared infrared stimulated luminescence (pIRIR) of feldspar to propose an integrated chronological framework of Colônia basin sediments. We discuss the consistency and weakness of each geochronometer and construct an age-depth model through an iterative Bayesian approach.
2. Regional setting
The Colônia basin is a near-circular geomorphological structure of 3.6 km diameter with a hilly circular rim elevated by up to 125 m (Fig. 1). It is located on the Paulistano Plateau (South of São Paulo city) at an altitude of about 800 m. The most accepted hypothesis of its origin is that of an impact crater, although not yet demonstrated (Riccomini et al., 1991; Velazquez et al., 2013; Prado et al., 2019), dated between 5 and 36 Ma. This coarse estimate
is based on the apparent deformation of imbrication contact from a regional outcrop, alongside structure diameter, filling and preservation state (Riccomini et al., 1991, 2011). No datable material related to the basin formation has been found so far. Seismic investigations within the Colônia structure indicate a sedimentary basin of 2.8 km diameter with a maximum sedimentary filling comprised between 250 and 370 m (Neves 1998; Riccomini et al., 2011; Prado et al., 2019). The seismic stratigraphic model proposed recently by Prado et al. (2019) comprises three main sedimentary units below the bog (Riccomini et al., 1991; Ledru et al., 2005, 2009). A first lacustrine unit of ~180 m thickness composed of organic-rich clay with few sandy mud layers deposited in humid conditions (Riccomini et al., 2005, 2011). A second ~70 m lacustrine unit composed of sandy muds with grains and pebbles of quartz deposited under drier conditions during the initial sedimentary filling of the depression (Prado et al., 2019). A lowermost unit approximately 120 m thick possibly includes an impact breccia layer. Altogether, Prado et al. (2019) proposed a total depth of ~400 m (considering uncertainties on data calibration) from seismic and gravimetric studies. Cores previously drilled in the Colônia basin for groundwater exploration and palynological studies allow first insights into sediments composition (Riccomini et al., 1991, Ledru et al., 2005, 2009) and provide a tenuous age estimate of ∼2.6 Ma for the formation of the basin. However, this age is based on a crude extrapolation of a 7.8 m upper core and most of the nature and age of the sedimentary infill remain unknown in the absence of a long sedimentary core recovery and geochronological constraints. The inner central part of the structure contains a modern swampy alluvial plain drained by the Vargem Grande Stream flowing through a single outlet in the eastern rim of the structure (Fig. 1c-d). The Colônia basin is inserted in the tectonic-stratigraphic domain of the Neoproterozoic Embu Complex in the Ribeira Belt (Campanha et al., 2019). Accordingly, the main rock types in the region are gneisses, migmatites, diorites, mica schists, quartzites, mylonites, amphibolites, metabasites, granites and granodiorites, all
of which are intensively weathered (Riccomini et al., 1991). Of major importance at the rim radius are mica-schists and quartzites. Mudstone from the Paleogene Resende Formation are dominant at the southernmost part of the structure (Riccomini et al., 2011), whereas alluvial deposits are found within the rim.
3. Coring and composite sequence
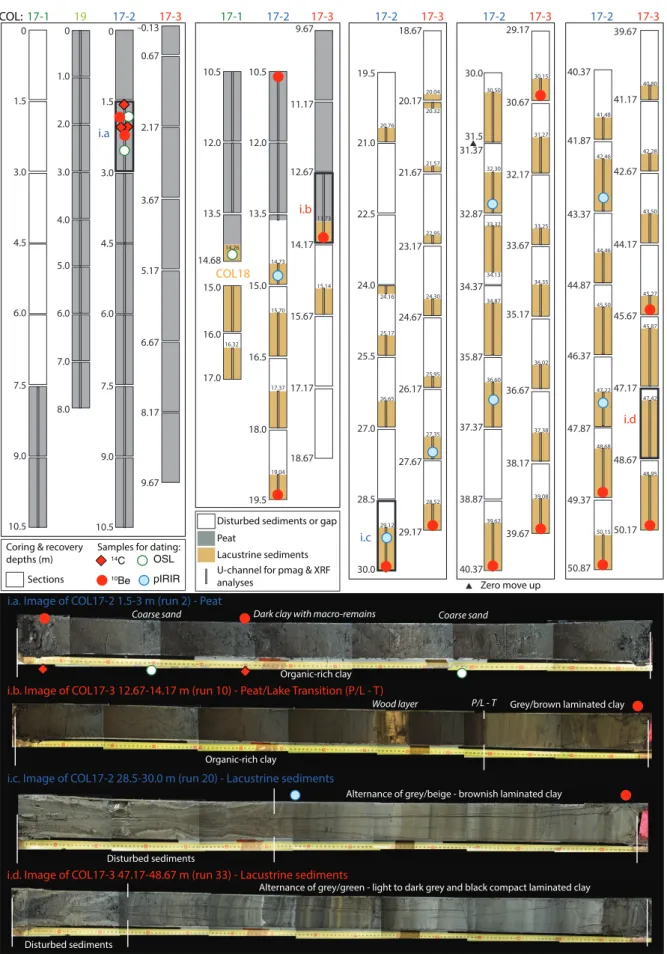
The sedimentary cores used to build the COL17c composite record were retrieved during three distinct missions in August 2017, May 2018 and May 2019. Three parallel holes (COL17-1, -2, -3) distant of few meters apart were drilled from the center of the Colônia basin in 2017 (red dot in Fig. 1c-d). COL17-1 was obtained using a hand hammering system mounted on a tripod. In-place sediments were recovered within the 7.5 to 14.7 m depth interval, while sediments from the first 5 sections (0 to 7.5 m) suffer of mixing, compaction and poor recovery. Following this first coring, we changed drilling equipment to retrieve deeper sediments because of limited penetration range of the hand hammering system. COL17-2 and COL17-3 were drilled using a built-in pushing corer with rotary tubing mounted on a 6T Caterpillar® drill rig. This system has permitted to retrieve sediments until 52 m deep, but the recovered sediments show important disturbances within the top-half of most sections (with various disturbed thickness) or within some entire sections (Fig. 2). These sedimentary disturbances were most likely induced during coring by inadequate drilling techniques, e.g., large amount of water used, squeezing and suction induced by the inadequate penetration and retrieving of the coring barrels and laying casing. In May 2018, we drilled back at COL17 site after technical adjustments by the contractor company, but obtained similar unsatisfying results, eventually acquiring only two undisturbed 1-m sections (COL18). In 2019, a fifth hole was retrieved from the exact same location using a conventional D-section Russian corer. This third expedition (COL19) was motivated by the poor sediment recovery of COL17-1 within the upper part of the section (from 0 to 8 m depth). Altogether,
we obtained a total cumulative thickness of ∼126 m sediments, reaching a maximum corrected depth of 52 m: 14.7 m (COL17-1) – 51 m (COL17-2) – 50 m (COL17-3) – 2 m (COL18) – 8 m (COL19) (Fig. 2).
Despite gaps in core sections, we built a composite sequence using all reliable sedimentary intervals from the five holes. Depth adjustments were required to correct for depth shifts among cores induced by distance separating each hole and the different devices used for coring/drilling. We first calculated coring offsets based on fieldwork notebook and data logging of the two cores, COL17-2 and -3, in order to obtain a common depth scale for these two cores. Corrections were applied to COL17-2 and -3 to account for the shift of the zero reference after drilling run number 23 of COL17-2 and for sediments lost in the core catchers. We then aligned cores using non-destructive high-resolution scanning measurements and sedimentological changes observable in different cores (see section 4.1 for methods). More specifically, we aligned COL17-3 sections to COL17-2 sections by using visual sedimentological tie points, natural gamma ray and X-ray fluorescence (XRF) scanning results; and by maximizing the correlations between the signals (see Supplementary Material, Figs. S1 to S3; Table S1). Due to overall agreement in XRF scanning results between COL19 and 1, we kept the original depth for these two cores. We finally aligned COL17-1/COL19 depth and COL17-2/COL17-3 composite depth according to the peat-lake deposit transition using natural gamma ray data. Hereafter, all depths are expressed in meter composite depth (mcd) scale. The vertical offsets between COL17-2 and COL17-3 allowed a composite recovery of about 60% within the lacustrine sediments part of the record, between 14.26 and 51.73 mcd (Fig. 2). It further reaches relatively good recovery, up to 80%, between 30 and 51.73 mcd corresponding to the oldest nearly continuous lacustrine sedimentary sequence ever retrieved in the region.
The COL17c composite record is characterized by two distinct units separated by a sharp transition: a) organic-rich silty-clayey brown-grey to greenish lacustrine sediments until 14.26 mcd, and b) organic rich peaty sediments from 14.26 mcd to surface (Fig. 2). These two units have been deposited under different sedimentary regimes, characterized by a lacustrine system that shifted to a peatland system (Ledru et al., 2015). Alternations of light brownish grey to black organic rich lamina are observed within the lacustrine unit (Fig. 2). Charcoal, small pieces of wood and shells were observed in the lacustrine unit while large fragments of wood to woody layers were retrieved in the peat sequence. Few centimetric lamina of sand and gravel mixed with clay were found in the peat unit. All disturbed sediments are constituted by wet brown-yellowish silty-clayey muds intervals, easily recognizable by a typical “chimney” structure, parallel to the liner (Fig. 2). Following sedimentological description, the core sections (1.5 m long) were sampled with u-channels (rigid u-shaped plastic liners, 2x2 cm cross section) from the center of the working halves for magnetic and XRF analyses.
4. Methods
4.1. Core scanning
Gamma bulk density and low field volumetric magnetic susceptibility (MS) were measured immediately after coring on half-sections at University of São Paulo (Brazil) using a GEOTEK Multi Sensor Core Logger (MSCL) at 0.2 cm intervals to characterize sediment properties such as wet bulk density and large-scale lithological changes. Magnetic susceptibility was later measured on u-channels at 2 cm intervals using a uniaxial fluxgate probe (Demory et al., 2019). XRF measurements were performed on u-channels using a Mo tube at 30 kV and 45 mA to determine variability of Si, K, Ca, Ti, Mn, Fe, Br, Rb, Sr and Zr using ITRAX scanner (Cox Analytical Systems) at CEREGE. The spatial resolution of XRF measurements was of 0.5 cm with counting time of 15 seconds. The ratio between incoherent
and coherent response (inc/coh) from the Mo tube corresponds to Compton to Rayleigh scattering ratio, and represents the relative abundance between light and heavy elements (Croudace et al., 2006; Chawchai et al., 2016).
4.2. Radiocarbon dating
Twelve samples of bulk peat sediment were extracted from the 1 and COL17-2 cores, respectively, and measured at CEREGE with the AixMICADAS facility (Bard et al. 2015). The samples were examined under binocular to exclude possible macro contaminants and were lyophilized, but not homogenized by grinding. To speed-up the process, these bulk samples were measured by direct combustion with an elemental-analyzer coupled with the
CO2 gas ion source of AixMICADAS (Tuna et al. 2018). Reported 14C results in Table 1 are
expressed as percent modern Carbon (pmC) and conventional 14C ages in yr BP, which were
calibrated using the IntCal13 curve (Reimer et al. 2013) and the RBacon package (Blaauw
and Christen, 2011; R Core Team, 2018). The 14C results on COL17-1 provide further
evidence that the upper part of this core is disturbed by sediment mixing and compaction. Indeed, core COL17-1 exhibits a poor reproducibility between different aliquots from the same depths, and a factor 3 lower apparent sedimentation accumulation rate than core
COL17-2, which 14C results were used in the final chronology.
4.3. Luminescence dating
Ten samples were selected for luminescence dating of quartz and potassium feldspar (K-feldspar) performed in the Luminescence and Gamma Spectrometry Laboratory (LEGaL) of the Institute of Geoscience at University of São Paulo. Measurements were done on the fine silt (4-11µm) fraction due to limited amount of grains in the sand fraction. Samples were first wet sieved at 63 µm, then the 4-11 µm grain size fraction was acquired by decantation in distilled water and treated with hydrogen peroxide (H2O2 27%) and hydrochloric acid (HCl 10%) to remove organic material and carbonates. Fine silt aliquots were mounted on stainless
steel discs for luminescence measurements using Risø TL/OSL DA-20 readers, equipped with Sr90/Y90 beta sources with dose rates of 0.075 Gy/s and 0.125 Gy/s (steel discs) and blue
LEDs (470nm, 80 mW cm-2)and infrared (IR) LEDs (870 nm, 145 mW cm-2) for stimulation.
The ultraviolet emission of quartz (blue stimulation) was recorded using a Hoya U-340 detection filter. A combination of Schott BG 39 and BG3 detection filters was used for detection of the blue emission from feldspar stimulated with IR. Quartz aliquots were checked for K-feldspar contamination with IR stimulation at 60º C. IR stimulation revealed that feldspar was present in the lacustrine sediment samples but not in the peat samples. Optically stimulated luminescence (OSL) measurements using blue stimulation pointed that the luminescence signal of quartz from peat samples is dominated by a fast OSL component, as suggested by OSL decay curves with fast decay rate in the initial 1s of stimulation (see Supplementary Material, Fig. S4).
Equivalent doses in quartz was estimated using the single aliquot regeneration dose protocol as proposed by Murray and Wintle (2003) (Table S2). Dose response curves were built using the integral of the first 0.8 s of the OSL decay curves (Fig. S4a) subtracting the integral of the last 10 s as background. Equivalent doses in K-feldspar were estimated by post-infrared infrared stimulated luminescence, with the first IR stimulation at 50º C and the second at 290ºC (pIRIR290ºC) (Buylaert et al., 2012, Table S2). The pIRIR290ºC signal was calculated using the integral of the initial 2s of the IRSL decay curve (Fig. S4c) subtracting the last 10 s as background. Dose response curve was determined through a single exponential function. Only aliquots with recycling ratio (ratio between corrected signals for D6 and D1 doses) between 0.9 and 1.1 and insignificant recuperation (D5 signal < 5% of natural signal) were accepted for calculation of equivalent doses. The equivalent dose of each samples was calculated using the Central Age Model (CAM, Galbraith et al., 1999). The dose recovery test for quartz OSL signal was performed using 4 aliquots of sample COL17-2_1.78 mcd. The
aliquots were bleached for 3-4 hours under a solar simulator. The dose recovery was carried
out with a preheat temperature of 200o C and given dose of 150 Gy. The average
calculated-to-given dose ratio was 0.99 ± 0.07. In this study, the reduced amount of quartz in the peat interval was a limitation to perform several dose recovery tests. However, previous dating studies demonstrate that a wide range of equivalent doses can be reliably estimated in quartz
from southeastern Brazilian sediments using a preheat temperature of 200oC (e.g. Sawakuchi
et al., 2016). Dose recovery tests for the pIRIR290ºC signal were performed with aliquots of sample COL17-2_15.72 mcd bleached under a solar simulator (24 or 72 hours) and for aliquots bleached on the Risø TL/OSL DA-20 reader. A given dose of 500 Gy was used for
all dose recovery tests carried out for the pIRIR290ºC signal. The average calculated-to-given
dose ratios for aliquots (accepted/measured) bleached under the solar simulator for 24 and 72 hours and for aliquots bleached with stimulation in the Risø TL/OSL DA-20 reader were respectively 1.08±0.12 (3/6 aliquots), 1.13±0.14 (2/8 aliquots) and 0.98 ± 0.09 (4/4 aliquots). Some aliquots bleached under the solar simulator presented given dose signals in saturation, suggesting that 72 hours of light exposure is unsuitable for complete bleaching of the natural signal. Then, equivalent doses of five aliquots (natural dose) exposed to the solar simulator for 72 hours were estimated, showing a dose of 109±13 Gy (overdispersion of 19%). This result points that the overestimation of given doses observed in dose recover tests is due to unsuitability of complete bleaching of the pIRIR290ºC signal using the solar simulator.
For dose rate calculation, the 238U, 232Th and 40K concentrations of samples from the lacustrine sediments were estimated by high resolution gamma ray spectrometry (GS) using a high-purity germanium (HPGe) detector (2.1 keV energy resolution and 55% relative efficiency) in an ultralow background shield (Canberra Industries). The samples were weighed and dried to estimate water content (i.e. determined by the ratio between wet and dry sample weights). Dried samples were packed in plastic containers and stored for at least 21
days to allow radon equilibrium before gamma spectrometry. The U, Th and K concentrations of samples from the upper peat unit (1.78 and 2.48 mcd) were estimated by induced coupled plasma mass spectrometry (ICP-MS) due to their reduced mass (< 5 g), which hindered high-resolution gamma spectrometry. The radionuclides activities were converted in dose rates using conversion factors presented in Guérin et al. (2011). Alpha radiation efficiency was calculated by a-value correction proposed by Mauz et al. (2006). The calculation of internal dose rate from 40K in K-feldspar assumed a K concentration of 12.5% (Huntley and Baril, 1997). Cosmic dose rate contribution was calculated by latitude, longitude, altitude and depth data following model proposed by Prescott and Hutton (1994).
4.4. Magnetostratigraphy
The natural and anhysteretic remanent magnetization (NRM and ARM) were measured on u-channels at 2 cm intervals using a three-axis super conducting rock magnetometer (2G cryogenic magnetometer 760 SRM) installed in a magnetically shielded room at CEREGE. A first series of alternating field (AF) demagnetization steps were applied at 5, 10, 15 and 20 mT on all u-channels in order to provide a preliminary NRM estimate, cleaned of viscous component, for the whole COL17c record. NRM measurements were further completed on non-disturbed sedimentary intervals after stepwise AF demagnetization from 20 to 80 mT with 5 to 10 mT increments. ARM was imparted in a linearly decaying AF field of 100 mT AF combined with a 0.05 mT direct field (DF), and demagnetized at the same steps as the NRM. All results were analyzed using the Puffinplot software (Lurcock and Wilson, 2012). Characteristic remanent magnetization (ChRM) directions were calculated using the PCA method (Kirschvink, 1980) within selected AF demagnetization range. The precision of the best fit procedure was estimated by the maximum angular deviation (MAD).
4.5. Authigenic 10Be/9Be dating
Fourteen samples from the COL17-2 and COL17-3 cores (Fig. 2) have been prepared for 10Be and 9Be measurements following the method of Bourlès et al. (1989) revised by
Simon et al. (2016a, 2016b). Authigenic 10Be and its stable isotope 9Be were extracted from
∼1 g dry samples by soaking them in a 20 ml leaching solution (0.04 M hydroxylamine (NH2OH–HCl) and 25% acetic acid) at 95±5°C for 7h. A 2 ml aliquot of the resulting leaching solution was sampled for measurement of the natural 9Be concentration using a graphite-furnace Atomic Absorption Spectrophotometer (AAS) with a double beam correction (Thermo Scientific ICE 3400®). The remaining solution was spiked with 300 µl of a 9.8039 x 10⁻⁴ g.g-1 9Be-carrier before Be-purification by chromatography to determine
accurately 10Be sample concentrations from accelerator mass spectrometer (AMS)
measurements of 10Be/9Be ratios at the French AMS national facility ASTER (CEREGE). 10Be sample concentrations were calculated from the measured spiked 10Be/9Be ratios normalized to the BeO STD-11 in-house standard (1.191±0.013 x 10⁻¹¹) (Braucher et al., 2015). The authigenic 10Be/9Be ratio (Be ratio hereafter) dating method rests on the
radioactive decay of the 10Be cosmogenic radionuclide initially deposited within the
sediments. The method has been successfully applied from very different settings, including: oceanic sediments from central Pacific (Bourlès et al., 1989) and central Arctic (Frank et al., 2008); continental sediments from the Chad Basin (Lebatard et al., 2008, 2010), paleolake Friis in Antarctica (Valletta et al., 2015), Danube Basin (Šujan et al., 2016, 2020) and in Lake Acigöl (Turkey; Demory et al., 2020); and marine ferromanganese crusts and nodules (Frank et al., 1999; Graham et al., 2004).
5. Results and interpretations
5.1. Stratigraphy and sedimentary patterns
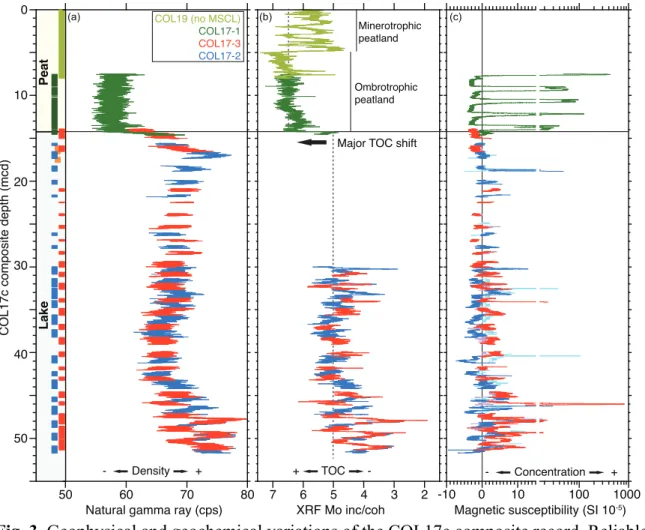
Natural gamma ray (NGR) measurements on fresh split core sections provide a wet bulk sediment density proxy showing a sharp transition from higher to lower values between
the lacustrine and peatland units, respectively (Fig. 3a). Relatively steady values are observed within the lower peatland unit (no data between 0 and 7.5 mcd), while large-scale oscillations and long-term amplitude changes characterized the lacustrine sediments record. Better resolved oscillations are found within the lower part of COL17c where the highest sedimentary recovery rates correspond to highest sediment density estimates. Overall lower XRF Mo inc/coh ratio together with oscillating features are found within the lacustrine unit, while the peatland unit is rather characterized by two distinct states corresponding to minerotrophic- and ombrotrophic-like peatland systems (Roeser et al., 2017; Poto et al., 2013; Longman et al., 2019). The ombrotrophic peatland presents the highest XRF Mo inc/coh and Ca/Ti ratios values (Figs. 3 and 4). Intermediate XRF Mo inc/coh ratio values characterized by large variations are observed within the minerotrophic peatland (5 mcd upward). We interpret the XRF Mo inc/coh oscillations within the lacustrine unit as raw estimate of total organic content (TOC) variations (Fig. 3b). The major shift toward higher values within the ombrotrophic peatland unit is most likely associated with a drastic increase in the TOC, although straightforward comparison with the lacustrine sediments should be avoided without any proxy calibration from TOC, porosity and moisture measurements (Chawchai et al., 2016; Woodward and Gadd, 2018). This major shift is also accompanied by a sharp delivery decrease of detrital siliciclastic components (Ti, K, Rb, Si) at the transition between the lacustrine and ombrotrophic peatland units (Fig. 4). The abundance of these elements is low within the whole ombrotrophic peatland, while they present higher concentrations and demonstrate large-scale oscillations within the minerotrophic peatland and lacustrine units. These observations support important lateral sedimentary inputs from the catchment area during the lacustrine and minerotrophic intervals, and muted detrital deliveries characterizing the ombrotrophic peatland. Intervals with higher detrital siliciclastic component concentrations present the lowest XRF Mo inc/coh ratio, and vice versa, showing rapid
paleoenvironmental variations through the minerotrophic peatland. Overall, the Fe/Ti ratio varies slightly around a constant value within the lacustrine unit, providing a typical lacustrine signature associated with more or less continuous detrital inputs modulated by grain size variations (Fig. 4). The large Fe/Ti variation range and shift observed within the peatland unit is rather associated with massive detrital inputs and, especially, redox condition changes associated with large paleoenvironmental variations. We interpret the low Fe/Ti ratio of the minerotrophic peatland sub-unit by a reduction of Fe within coprogenous sediments containing the remains of all particulate organic matter, inorganic precipitations, and minerogenic matter (surface run-off). These variations are likely associated with large regional hydrological changes that modify detrital inputs and water table, henceforth contributing to sustain large redox variations within the peatland unit as shown by similar behavior of redox sensitive elements and ratio such as Fe, Mn and Mn/Ti. Bulk magnetic susceptibility (MS) ranges mainly from -10 to 10 x 10-5 SI (Fig. 3c). Measurements using loop sensor on half-sections (MSCL) and fluxgate point sensor on u-channels provide rather similar MS values, the latest being sensibly less negative which is most likely associated with calibration and water content difference between fresh split core measured immediately after coring and measurements on u-channel samples more than 1 year after coring. Overall, the results point out to low ferro- or ferrimagnetic minerals concentration, while negative MS are associated with dilution by high content of diamagnetic material such as organic matter. MS spikes observed within COL17-1 are associated with intervals characterized by higher percent of coarse sand-size material, tracing episodic detrital inputs within the very organic ombrotrophic peatland (Fig. 3c). These episodes are also characterized by small increase of detrital siliciclastic elements such as Ti, K, Rb and Si (Fig. 4). Within the lacustrine unit, few
spikes above 10 x 10-5 SI are associated with events of increase concentration and/or coarser
fine silt sediments. Higher MS amplitude variations are noticed from the lowermost 5 mcd of the COL17c sequence and correspond to the large-scale fluctuations of gamma density and XRF datasets (Figs. 3 and 4).
It is far beyond the scope of this paper to discuss these data which need to be confronted and calibrated with complementary proxies before robust paleoenvironmental and paleoclimatic interpretations could be drawn. These core scans provide however important constraint to fine-tune the composite record (see section 3) and further give qualitative proxies showing the succession of two different sedimentary regimes, as previously reported for other records in the Colônia basin (Riccomini et al., 1991, 2011; Ledru et al., 2005, 2009; Rodriguez-Zorro et al., 2020) and demonstrating the occurrence of large-scale paleoenvironmental variations recorded in Colônia sediments.
5.2. Luminescence dating
The dose rates of the studied samples vary from 0.53 ± 0.02 Gy/ka to 2.05 ± 0.12 Gy/ka. The water saturation ranges from 0.29 to 2.17, with the lower values in peat samples from shallower depths compared to lacustrine sediment samples. The equivalent doses measured by the OSL signal from quartz and pIRIR290ºC signal from K-feldspar as well as other data relevant for luminescence ages calculation are presented in Table 2. The number of aliquots accepted for calculation of equivalent doses ranged from 8 to 20. Aliquots rejection was mostly due to poor recycling or natural signal beyond 2D0, which represent the higher reliable dose that can be estimated (Wintle and Murray, 2006). Despite the occurrence of saturated aliquots in sample from 15.72 mcd, it was possible to obtain a significant number of
aliquots with pIRIR290ºC signal below saturation for calculation of equivalent doses.
Therefore, only the samples from 1.78 mcd, 2.48 mcd and 15.72 ± 0.14 mcd (all from
COL17-2) present natural OSL or pIRIR290ºC signals below saturation, providing three
sample from the peat interval shows a saturated natural OSL signal at depth of 7 mcd (Fig.
S5). In this case, minimum natural dose was calculated through 2D0. The quartz OSL signal
saturation occurs in the peat layers from the depth of 7 mcd, with quartz aliquots of this sample showing 2D0 of 314.1 Gy (Fig. S5a). In the same way, the natural pIRIR290ºC is in
field saturation at depth of 28.49 mcd (Fig. S5b, 2D0 = 421.6 Gy). The maximum doses that
can be measured using pIRIR290ºC signals of K-feldspar from the lacustrine sediment samples
are presented in Table 2. The 2D0 values represent therefore minimum natural doses and then
estimates of minimum ages that are reported in Table 2, but not used for age-depth modeling.
5.3. Magnetostratigraphy
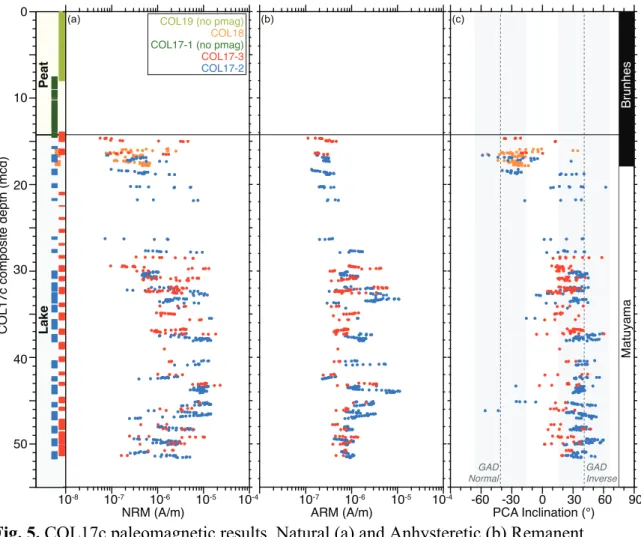
The peatland unit is characterized by low NRM values ranging from 10-9 to 10-6 A/m
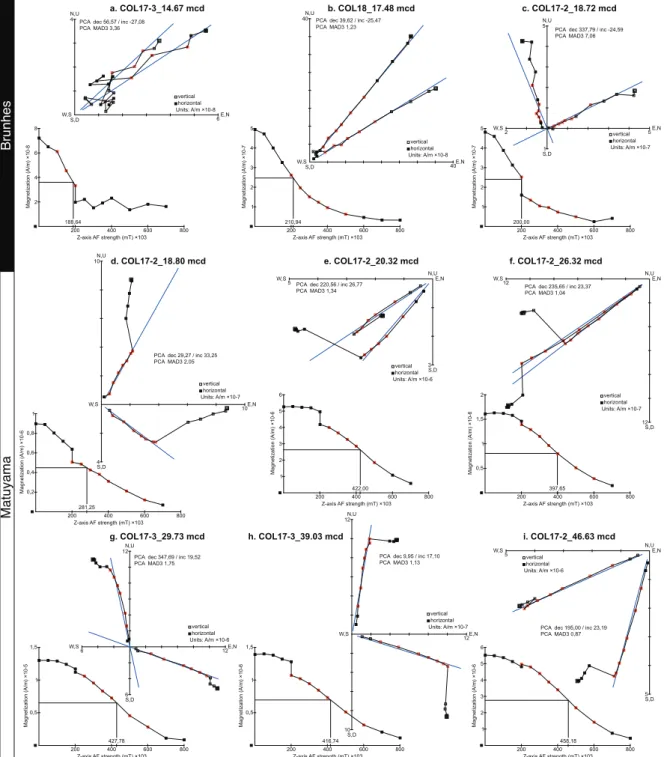
and presenting extremely scattered inclinations, sharply oscillating from 83° to -86° (not shown). These values which are associated with high organic matter content and varying redox conditions (Figs. 3 and 4) preclude the use of magnetic data for paleomagnetic interpretations and are not discussed further. Low NRM and ARM values ranging between 10-7 and 10-5 A/m characterize the non-disturbed Colônia lacustrine sediments (Fig. 5a-b). These values are associated with low ferrimagnetic particles concentration, which is further confirmed by very low to negative MS (Fig. 3c). The NRM and ARM values slightly increase below 30 mcd, but remain overall low. Such very low and variable magnetization values associated with organic-rich sediments, variable detrital inputs and redox condition changes hinder reconstruction of reliable continuous paleosecular variation (PSV) or relative paleointensity (RPI) according to quality criteria (e.g. King et al., 1983; Tauxe, 1993). Moreover, many sedimentary intervals are characterized by unstable and scattered directions over demagnetization steps preventing the identification of reliable characteristic remanent magnetization (ChRM) for the whole COL17c composite record.
In order to provide low-resolution paleomagnetic constraints, we followed a strict procedure to dismiss all unreliable data by carefully scrutinizing demagnetization and Zijderveld plots of all measured samples. Demagnetization steps associated with viscous overprint (< 15-20 mT), weak noisy values at higher fields and occasional gyroremanent magnetization (GRM) occurring at some levels above 45 mT or 60 mT were removed. The alignment of the ChRM vector to the origin of an orthogonal projection was also checked. Only samples presenting a stable and well-defined direction over a minimum of 5 consecutive demagnetization steps within the interval 15 to 50 mT were retained (red squares in Fig. 6). We then calculated the paleomagnetic directions by principal component analysis (PCA) on selected ChRM interval and kept only samples presenting maximum angular deviation values (MAD) below 10°. 53% and 30% of the total samples pass these strict selection criteria in COL17-2 and COL17-3 cores, respectively (Fig. 5c). Trustworthy PCA inclination values above and below 18.76 mcd are mainly normal (-15±21°) and inverse (30±14°), respectively, although being relatively noisy and presenting inclination flattening with directions slightly shallower than expected for the geocentric axial dipole (GAD) model for the site latitude (-41° - normal / (-41° - inverse), or computed by the most recent World Magnetic Model (WMM)
or International Geomagnetic Reference Field (IGRF) models (-38.2±0.2°;
https://www.ngdc.noaa.gov/geomag). Inclination flattening can be explained partly by sediment compaction or to sedimentary fabric changes (e.g. rotation of elongated magnetic grains toward horizontal direction), which is rather common in such organic-rich sedimentary sequence. Potential coring artifact is also suggested by the largest scattering of COL17-3 inclination values and the lower percent of reliable paleomagnetic data (compared to COL17-2). Interestingly, the location of the Colônia basin lying right in the middle of the actual South Atlantic Anomaly (SAA) could also explain part of such “lower than expected” inclination values (according to GAD model; Trindade et al., 2018), but the resolution and quality of the
current dataset prevent such inferences. We interpret the inverse inclination values below 18.76 mcd as corresponding to sediments deposited during the Matuyama chron (Laj and Channell, 2015). Most importantly, the identification of two antipodal and well-defined samples at 18.72 and 18.80 mcd (Fig. 6c-d) allows identifying precisely the Matuyama-Brunhes transition, the last geomagnetic reversal, which occurred at 773±7 ka (Valet et al., 2019; Singer et al., 2019; Simon et al., 2019). Sediments deposited during the inverse Matuyama chron show only few transitional to normal data points, but no long duration normal inclination values are observed. We therefore speculate on the absence of the long duration normal Olduvai subchron, which support a maximum age of 1.77 Ma for the bottom part of the COL17c record (Simon et al., 2018; Channell et al., 2020). The absence of the normal Jaramillo subchron (0.99 - 1.07 ka) or other short duration normal events (e.g. Cobb Mountain) is explained by low sediment recovery, disturb intervals and/or unreliable paleomagnetic data within the 20 – 30 mcd (Fig. 5) and by overall low sedimentation rates (i.e. < 10 cm/ka; Roberts, 2008).
5.4. Authigenic 10Be, 9Be and 10Be/9Be ratio (Be ratio) results and dating
The 10Be leachates concentration (av. 11.7±1.5 x 10⁸ at/g) and Be ratio (av. 4.3±0.6 x
10-8) from the two uppermost samples (1.55 and 2 mcd) are one order of magnitude higher
compare to all other samples with average 10Be and Be ratio of 1.5±0.5 x 10⁸ at/g and 0.2±0.1
x 10-8, respectively (Fig. 7b, Table 3). These results strongly support distinct authigenic 10Be geochemical behaviors between the peatland and lacustrine units, which is rather coherent with different input/deposition regimes, organic matter content, redox condition changes and remobilization modes between these two distinct sedimentary systems (e.g. Barg et al., 1997). This observation is particularly important since the superposition of these two different sedimentary regimes controlling the Be inputs and behavior is incompatible with the use of Be ratio as a geochronometer for the whole COL17c record, which request homogeneous
sedimentary settings (e.g. Lebatard et al., 2008, 2010). Interestingly, the 10Be concentration (Fig. 7b) from 10.52 mcd presents a rather comparable value with samples from the lacustrine
unit, which supports similar atmospheric 10Be input/adsorption rates between the
ombrotrophic peatland and lacustrine units. Yet, the 9Be concentration (Fig. 7a) from 10.52
mcd (3.2 x 10¹⁶ at/g) is rather similar to the peat average (2.9±0.3 x 10¹⁶ at/g) and significantly different to the lacustrine average (8.6±2.1 x 10¹⁶ at/g). These results are fully coherent with siliciclastic components changes (Figs. 4 and 7a), which suggest different sources and geochemical behavior between both isotopes within the peatland unit. The Be isotopes concentration (Fig. 7a-b) and Be ratio (Fig. 7c) from sample 40.51 mcd are significantly lower and considered as outliers for chronological interpretation. Lacustrine 10Be
concentrations varying from 1.2 to 2.1 x 10⁸ at/g do not show any long-term decrease trend
which can be interpreted as rapid sedimentation (young sequence) or 10Be concentrations controlled by secondary depositional processes associated with environmental changes (Fig. 7b). Lacustrine 9Be concentrations range between 6.3 to 12.4 x 10¹⁶ at/g, with noticeable higher values at the two deepest samples (av. 11.9±0.7 x 10¹⁶ at/g) and av. 7.7±1.9 x 10¹⁶ at/g between 15.03 and 50.25 mcd (Fig. 7a). This is coherent with clayey to fine silts detrital
sediment inputs as seen by XRF and MSCL measurements (Figs. 3, 4 and 7). Both 10Be and
9Be are highly correlated with each other (r = 0.86), and with detrital siliciclastic components (0.71 < r > 0.84) within the lacustrine unit (Fig. 7a-b; Table S3). These observations suggest similar input pathways and behavior of both authigenic Be isotopes in the lacustrine unit
supporting the use of authigenic 9Be as normalizer to remove/minimize most remaining
environmental component (Bourlès et al., 1989; Willenbring and von Blanckenburg, 2010), allowing chronological interpretation from the Be ratio.
Once normalized for environmental components, the fundamentals for using Be ratio dating relies on several strict conditions: 1) a Be ratio showing systematic stratigraphic
decrease; 2) that the selected samples have remained in a closed system with no entry or loss
of the cosmogenic isotope 10Be and its normalizing element 9Be; and, 3) accurate estimation
of the initial Be ratio. Providing that these conditions are respected, the equation 𝑁 𝑡 = 𝑁"𝑒#𝜆𝑡 (where 𝑁(𝑡) is the measured ratio; 𝑁" is the initial ratio; 𝜆 is the radioactive decay
constant and 𝑡 is the age of the sediments) can be applied to the measured Be ratios in order to
calculate the ages of the studied sediments. Condition 1 is broadly respected in our study considering uncertainties and assuming a relative young age from the paleomagnetic results,
i.e. maximum age of 1.77 Ma which is not much older than one 10Be half life cycle (1.387
Ma, Chmeleff et al., 2010; Korschinek et al., 2010). Note here that the 10Be production variations induced by geomagnetic field intensity and solar activity might slightly impact the nominal 10Be concentration of every sample, but change little to the average long-term decrease trend. Condition 2 is most certainly not respected within the whole COL17c record, but seems to be established within the lacustrine unit as shown by the rather coherent Be isotopes behavior and the Be ratio model (Fig. 7c). This exponential decay model further provides a theoretical Be ratio value of 0.287 x 10⁻⁸ at the surface (star in Fig. 7c), ten times lower than the measured values. Condition 3 cannot be fulfilled easily given the different inputs and geochemical behaviors of the cosmogenic 10Be and detrital 9Be between the peatland and lacustrine units. The only way to solve this conundrum is by using an initial authigenic Be ratio of know age (𝑁") within the sediments deposited during the late
lacustrine phase using an independent dating method (see section 6). In order to obtain a raw estimate of the time elapsed between the upper lacustrine limit and the lower part of the COL17c, we derived a duration from the Be ratio measurements at 15.03 and 51.75 mcd using the following equation: ∆𝑡 = −𝜆 × ln (𝑁,-./,/𝑁-,."1). We obtained a duration estimate of 761±80 ka, which correspond to sedimentation rates comprise between 4.4 to 5.4 cm/ka for the lacustrine interval.
6. Age-depth modeling
Dating long lacustrine sedimentary sequences extending beyond the radiocarbon range proves particularly difficult because of peculiar sedimentary regimes and generally much contrasted deposition history. These different settings imply that interpreting chronostratigraphic results from lake is rarely, or never, straightforward (e.g. Colman et al., 2006; Kadereit et al., 2012; Kliem et al., 2013; Shanahan et al., 2013; Nowaczyk et al., 2013; Roberts et al., 2018; Leicher et al., 2016; Chen et al., 2019; Wagner et al., 2019). In this study, we used several dating approaches, i.e. radiocarbon, paleomagnetic, luminescence and Be ratio dating, with various success rates (see section 5). All available chronological markers from COL17c are summarized in Tables 1 to 4. Three reliable radiocarbon ages and only two samples with non-saturated natural OSL signals exist within the peatland unit. The radiocarbon ages are however inconsistent with the OSL ages that are older than the upper radiocarbon limit, i.e. the two radiocarbon ages at 2 mcd are fully reproducible with an average age of 33.3±3.0 ka cal BP, while the OSL age above, at 1.78 mcd, is significantly older with 74.5±4.7 ka. Incomplete reset (“bleaching”) of OSL signal before deposition of quartz grains can lead to residual doses and age overestimation. However, studies about OSL signals of quartz from water-laid sediments (e.g. Hu et al., 2010; Chamberlain and Wallinga, 2019) show that silt grains are relatively well-bleached and suitable for luminescence dating. Chamberlain and Wallinga (2019) observed residual doses lower than 0.5 Gy in quartz from fine silt and a tendency of decreasing residual doses from fine sand (125-180 µm) to fine silt (4-20 µm). These findings suggest that residual signals would have minor contribution to overestimation of equivalent doses found in the measured quartz aliquots, which present equivalent doses beyond 100 Gy (Table 2). Changes in water saturation and/or radionuclides concentrations through time have influence on dose rate and are another sources of age uncertainty when luminescence dating is applied to high porosity material suitable to leaching
the increase in water content through time due to rising water table would promote decrease in dose rate and overestimation of burial ages. Additionally, values of 226Ra/232Th ratios below unit (Table 2) indicate loss of U-series radionuclides, which would promote dose rate underestimation and consequent age overestimation. Similar reasonings can be drawn for the OSL date at 2.48 mcd (146.6±10.5 ka). Therefore, we assume our OSL ages as maximum deposition ages of quartz grains found within the Colônia basin peat. We are left with only three radiocarbon ages distributed over two depth levels: 16.8±0.5 ka cal BP at 1.55 mcd and 33.3±3.0 ka cal BP at 2 mcd. This gives an estimated average sediment accumulation rate (SAR) of 2.8±0.3 cm/ka in between these two dated stratums. This is about three time lower than an average SAR estimate of the CO3 and CO14 records (i.e. 7.5 cm/ka; Ledru et al., 2009; Rodríguez-Zorro et al., 2020). Such disparity could be explained by different location of both studied sites: within central basin for COL17c and closer to the margin for CO3/14 site (Fig. 1). Site CO3/14 potentially receiving more detrital sediment inputs from catchment weathering, higher sedimentation rates may be expected. Assuming in first approximation an overall constant SAR within the whole peatland unit gives an extrapolated age of 471±49 ka for the lacustrine to peat transition. We are fully aware that our hypothesis is highly tentative and barely significant, especially considering the two very different peatland systems (Fig. 4).
Yet, it is consistent with the pIRIR290°C age from 15.72 mcd (506.9±32.2 ka) that is otherwise
estimated at 523±55 ka by extrapolating downward the radiocarbon derived model. We therefore attribute a raw long-term average SAR for the whole peatland unit of 2.8±0.3 cm/ka, knowing that this value most likely varies highly around this average, especially between the two peatland sub-units. We highlight that only sample at 15.72 mcd in the lacustrine
sediments has an pIRIR290°C signal below saturation allowing to estimate an equivalent dose
for age calculation. Overdispersion of equivalent dose distribution is 5.4%, suggesting well-bleached sediments without significant post-depositional mixing. Additionally, other samples
from the lacustrine sediments show natural signals in saturation ensuring signal stability under burial conditions.
We then used authigenic Be ratio results from the lacustrine interval to build-up an age-depth model assuming that the buried sediments have constituted a closed system for beryllium isotopes since their depositions (Fig. 7). We modeled the ratio 𝑁𝐵𝑒 between concentration in 10Be and 9Be isotopes using equation 𝑁
𝐵𝑒 𝑥 = 𝑁"𝑒#𝜆𝑡(𝑥) where 𝑥 is the
composite depth (cd), 𝑡 𝑥 the time of deposition at cd 𝑥, 𝜆 the 10Be radioactive decay constant, and 𝑁" the unknown initial Be ratio. We constrained this unknown parameter using
the closer robust age estimate, the Matuyama/Brunhes transition (M/B, the last geomagnetic polarity reversal) identified at 18.76 mcd, and considering that sediments deposited at 51.73 mcd are younger than the Upper Olduvai transition (U. Olduvai) (Fig. 5). Log-transforming the radioactive decay equation leads to: 𝑡 𝑥 = 𝑡"−𝜆#-ln 𝑁𝐵𝑒 𝑥 , where 𝑡" = 𝜆#-ln 𝑁" is a time shift to be estimated. To do so, we first built a reference age-depth model with an arbitrarily chosen 𝑡" = 39.7 Ma with Bacon software (through library rbacon v.2.3.9.1.; Blaauw and Christen, 2011), operated on R software (R Core Team, 2018). Considering that the standard errors 𝜎-" for 10Be and 𝜎7 for 9Be are small compared to their means 𝜇-" and 𝜇7,
the age mean and error at each depth are taken as 𝑡" −𝜆#-ln 𝜇-" 𝜇7 and
𝜆#- 𝜎
-"8 𝜇-"8 +𝜎78 𝜇78. We then derived the age probability density at 18.76 mcd and 51.73
mcd, 𝑓-:./;~ 𝑡 and 𝑓,-./1~ 𝑡 . With a different 𝑡", the resulting age model is simply shifted
from the reference one by ∆𝑡" =𝑡"−𝑡". We computed the likelihood of ∆𝑡" as the joint
probability of a M/B recorded at 18.76 mcd and an U. Olduvai occurring below 51.73 mcd, given the value of ∆𝑡" considering that the timing of the M/B is distributed according to a
U. Olduvai transition is distributed according to a normal distribution of cumulative distribution function 𝐹𝑈. 𝑂𝑙𝑑𝑢𝑣𝑎𝑖 of mean 1770 ka and standard deviation 10 ka. It gives:
ℒ ∆𝑡" 𝑀/𝐵 at 18.76 mcd & U. Olduvai below 51.73 mcd = 𝑝 𝑀/𝐵 at 18.76 mcd & U. Olduvai below 51.73 mcd ∆𝑡" = 𝑓-:./;~ 𝑡 + ∆𝑡 " 𝑓QR 𝑡 𝑑𝑡 T #T × 𝑓,-./1~ 𝑡 + ∆𝑡 " 1 − 𝐹V.WXYZ[\] 𝑡 𝑑𝑡 T #T
The likelihood function is approximated by a Gaussian function of mean ∆𝑡" and standard deviation 𝜎𝑡". The mean and standard errors of age estimates at measurement depths then become 𝑡" + ∆𝑡" −𝜆#-ln 𝜇-" 𝜇7 and 𝜎8𝑡"+𝜆#8 𝜎-"8 𝜇8-"+𝜎78 𝜇78 (Table 3). We
finally computed the age model for the whole composite sequence by running the Bacon software using the Be ratio ages calibrated by paleomagnetic constraints within the lacustrine interval (see above) and incorporating radiocarbon ages from the upper peatland unit and the
pIRIR290°C age from the upper lacustrine unit (Fig. 8). The obtained age-depth model extents
the COL17c record to 1.5±0.1 Ma with derived SAR ranging from 2 to 6 cm/ka (average and standard deviation of 3.9±1.4 cm/ka).
7. Discussion
We fully recognize the limitations of our approach arising from overall low resolution and sediments recovery from cores constituting the COL17c record. Our assumption and the associated uncertainties must certainly be considered before any serial paleoclimatic correlations at this stage. However, this age-depth model provides important chronological constraints, independent from any orbital configurations or reference chronologies tuning a priori (e.g. Blaauw, 2012), and represents our best chronological estimate of long-term sediment deposition in Colônia basin. Most importantly, it demonstrates that total sedimentary infill of the Colônia basin is much older than previously thought based on surface cores from the basin (see introduction) and that COL17c record is the oldest nearly
continuous Quaternary continental paleoclimatic archive ever retrieved in the region. Other dating methods are not possible or remain to be tested by dedicated studies. For instance, the absence of recognized tephra layers within Colônia sediments prevents using a
tephrochronology approach, nor absolute 40Ar/39Ar radiometric dating from the sedimentary
sequence (e.g. Giaccio et al., 2019). The old age together with overall organic-rich and clayey sediments from Colônia basin do not permit using Uranium-series dating approach within the lacustrine unit (e.g. Chen et al., 2019). We did not attempt U-Th dating within the peatland unit (e.g. Van der Wijk et al., 1988; Rowe et al., 1997; Frechen et al., 2007) because the main objective was to obtain a long-term chronological framework of COL17c. Moreover, a non-closed-system between the two peatland sub-units or within is suspected, with possible uranium migration after deposition and the contamination of peat by varying amounts of detrital thorium. However, potential application of the U-Th method at Colônia could be relevant to provide independent radiometric constraints within the peatland unit, which is seriously missing now, but demands a dedicated study on undisturbed sediments. Cosmogenic exposure or burial dating using “in-situ” 10Be or 26Al request enough coarse grain material to be measured and modeled (e.g. Granger, 2014). This last method could be tested on sand lenses containing large amount of quartz grains identified below 52 m deep within the Colônia basin (Riccomini et al., 2011) and at the basin basements, providing that its age is young enough which is likely not respected at Colônia considering our new age-depth model. Indeed, a conservative extrapolation using derived sedimentation rates gives an age comprised between 5.3 and 11.2 Ma (median age: 7.2 Ma) for the base of the Colônia basin sedimentary infill at ~280 m (excluding the ~120 m interval of the putative breccia layer; Prado et al., 2019), which is fully coherent with previous estimation between 5 and 36 Ma (Riccomini et al., 1991, 2011). The Colônia basin sediments have therefore a strong potential for documenting long-term behavior of the SASM and regional paleoenvironmental responses of
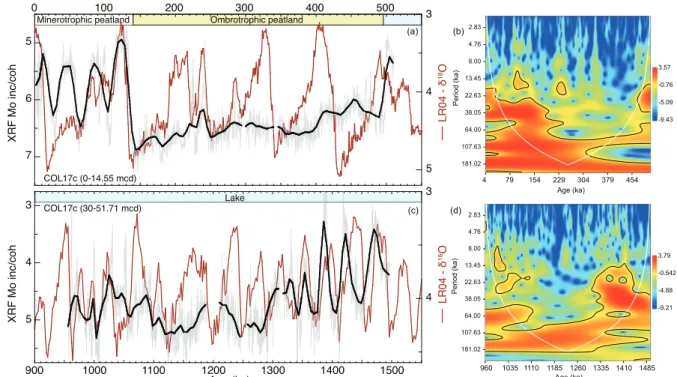
the Atlantic forest to major global paleoclimatic variations and reorganizations that occurred within the course of the Mio-Pleistocene time period. For instance, the XRF Mo inc/coh ratio of COL17c shows large variations tightly associated with glacial/interglacial pacing within the two nearly continuous intervals measured, i.e. from the peatland unit and bottom part of the lacustrine intervals, respectively. Detrital variations within the minerotrophic peatland are correlated to marine isotope stages and paced by obliquity signal (Fig. 9a-b). The limit between the ombrotrophic and minerotrophic peatland systems notably corresponds to the penultimate deglaciation (Termination II) with nearly perfect synchronism between the
Colônia XRF Mo inc/coh ratio and the global benthic δ18O stack (Lisiecki and Raymo, 2005).
It is worth noting that both curves from Figure 9a are fully independents and placed on their own chronologies (no wiggle matching attempt). The almost muted XRF Mo inc/coh response to glacial/interglacial pacing within the ombrotrophic peatland is tentatively explained by very low to null detrital siliciclastic inputs within this interval at the COL17c site (Fig. 4). Within the lacustrine interval, the large scale XRF Mo inc/coh oscillations observed before 1.3 Ma show a prominent frequency period at 41 ka (Fig. 9c-d). Although, these preliminary qualitative XRF interpretations need complementary proxies and additional time markers to truthfully discuss regional paleoenvironmental responses to paleoclimatic variations, our results present the first evidence of paleoclimatic variations over the neotropical rainforest realm before the Mid-Pleistocene transition.
8. Conclusion
In this study, we present a new 52 m composite record (COL17c) composed of five sedimentary sequences retrieved from the Colônia basin (Southeastern Brazil). Core scanning (MSCL and XRF) provides key constraints to align and fine-tune individual cores in order to propose a nearly continuous composite record. These methods further give qualitative proxies showing the succession of two very different sedimentary regimes: a peatland above ∼14 m
depth and lacustrine sediments below. Altogether, the composite record represents 100% sediments recovery within the peatland unit and over 80% between 30 and 51.73 mcd. An original chronological framework is proposed from a multi-proxy approach that include: radiocarbon, paleomagnetic, optically stimulated luminescence (OSL) dating of quartz,
post-infrared post-infrared stimulated luminescence at elevated temperature (pIRIR290°C) of feldspar and
authigenic 10Be/9Be dating. We describe the protocols used for each technique and discuss the
positive and negative results, as well as their implications for proxy interpretation. In spite of negative results of some techniques, mainly due to the absence of adequate sample material, the multi-proxy approach used is essential to maximize the chances of obtaining a satisfactory age model for a unique lacustrine sedimentary sequence. All valid chronological proxies,
comprising three AMS 14C ages, one pIRIR290°C age, two paleomagnetic constraints and eight
authigenic 10Be/9Be datum, are integrated within a Bayesian age-depth modeling to produce a
1.5±0.1 Ma chronology for the whole COL17c sequence. This age model represents our best chronological estimate of sediment deposition in the Colônia basin and allows to refine its formation age between 5.3 and 11.2 Ma, much older than previously estimated from short sedimentary cores, but fully coherent with geomorphological observations. Our results support the opportunity of a deep drilling in the Colônia basin to retrieve a continental Mio-Pleistocene record of tropical climatic variations and to evaluate the origin and age of the basin formation.
Acknowledgments
We thank Fabiano Pupim for assistance in fieldwork, Luciana Nogueira for assistance with gamma rays spectrometry, François Demory for its support with magnetic susceptibility measurements and Coralie Andreucci for assistance with the beryllium samples preparation. The CLIMCOR program at INSU and the C2FN in France are acknowledged for their support. Laurent Augustin and Alain de Moya (C2FN-DT-INSU) are thanked for assistance during the 2017 coring mission. We acknowledge Claudio Riccomini for sharing his knowledge about Colônia and constant support; and Ricardo Trindade for offering MSCL access at USP. The Suehara family, owner of the land, APA Capivari Monos, Associação ACHAVE de Vargem Grande are thanked for granting access to drilling site. We also acknowledge Christian Zeeden and an anonymous reviewer for constructive and helpful comments. AOS is supported by Conselho Nacional de Desenvolvimento Científico e
Tecnológico (CNPq grant 304727/2017-2). The ASTER AMS national facility (CEREGE,
Aix en Provence) is supported by INSU/CNRS, ANR through the EQUIPEX ASTER-CEREGE action, and IRD. The AixMICADAS and its operation are funded by the Collège de France and the EQUIPEX ASTER-CEREGE. Yoann Fagault and Thibaut Tuna are thanked for performing analyses. This research is part of the projects “Dimensions of biodiversity” FAPESP (BIOTA 2013/50297-0), NSF (DEB 1343578) and NASA, the International Continental Deep Drilling Program (ICDP), « UV-Trop » INSU LEFE, the Labex-CEBA, « TROPICOL » Foundation BNP Paribas « Climate Initiative » (2017-2020). The data presented in this study are available within the supporting information.
References
Adler, R.F., G.J. Huffman, A. Chang, R. Ferraro, P. Xie, J. Janowiak, B. Rudolf, U. Schneider, S. Curtis, D. Bolvin, A. Gruber, J. Susskind, and P. Arkin, 2003. The Version 2 Global Precipitation Climatology Project (GPCP) Monthly Precipitation Analysis (1979-Present). J. Hydrometeor. 4, 1147-1167.
Bard E, Tuna T, Fagault Y, Bonvalot L, Wacker L, Fahrni S, Synal H-A., 2015. AixMICADAS, the accelerator mass spectrometer dedicated to 14C recently installed in Aix-en-Provence, France. Nuclear Instruments and
Barg, E., Lal, D., Pavitch, M.J., Caffee, M.W., Southon, J.R., 1997. Beryllium geochemistry in soils: evaluation of l0Be/9Be ratios in authigenic minerals as a basis for age models. Chemical Geology 140, 237-258.
Blaauw, M., Christen, J.A., 2011. Flexible paleoclimate age-depth models using an autoregressive gamma process. Bayesian Analysis 6, 457-474.
Blaauw, M., 2012. Out of tune: the dangers of aligning proxy archives. Quaternary Science Reviews 36, 38-49. Bourlès, D.L., Raisbeck, G.M., Yiou, F., 1989. 10Be and 9Be in Marine sediments and their potential for dating.
Geochimica et Cosmochimica Acta 53(2), 443–452.
Braucher, R., Guillou, V., Bourlès, D.L., Arnold, M., Aumaître, G., Keddadouche, K., Nottoli, E., 2015. Preparation of ASTER in-house 10Be/9Be standard solutions. Nuclear Instruments and Methods in Physics
Research Section B: Beam Interactions with Materials and Atoms 361, 335-340.
Buylaert, J.P., Jain, M., Murray, A.S., Thomsen, K.J., Thiel, C., Sohbati, R., 2012. A robust feldspar luminescence dating method for Middle and Late Pleistocene sediments. Boreas 41(3), 435-451. Campanha, G.A.C., Faleiros, F.M., Cawood, P.A., Cabrita, D.I.G., Ribeiro, B.V., Basi, M.A.S., 2019. The
Tonian Embu Complex in the Ribeira Belt (Brazil): revision, depositional age and setting in Rodinia and West Gondwana. Precambrian Research 320, 31-45.
Chamberlain, E., Wallinga, J., 2019. Seeking enlightenment of fluvial sediment pathways by optically
stimulated luminescence signal bleaching of river sediments and deltaic deposits. Earth Surface Dynamics 7, 723-736.
Channell, J.E.T., Singer, B.S., Jicha, B.R., 2020. Timing of Quaternary geomagnetic reversals and excursions in volcanic and sedimentary archives. Quat. Sci. Rev. 228, 106114.
Chawchai, S., Kylander, M.E., Chabangborn, A., Lowemark, L., Wohlfarth, B., 2016. Testing commonly used X-ray fluorescence core scanning-based proxies for organic-rich lake sediments and peat. Boreas 45(1), 180– 189.
Chen, C. Y., McGee, D., Woods, A., Pérez, L., Hatfield, R. G., Edwards, R. L., Cheng, H., Valero-Garcés, B. L., Lehmann, S. B., Stoner, J. S., Schwalb, A., Tal, I., Seltzer, G. O., Tapia, P. M., Abbott, M.A., Rodbell, D. T., 2019. U-Th dating of lake sediments: Lessons from the 700 kyr sediment record of Lake Junín, Peru. Cheng, H., Sinha, A., Cruz, F.W., Wang, X., Edwards, R.L., d’Horta, F.M., Ribas, C.C., Vuille, M., Stott, L.D.,
Auler, A.S., 2013. Climate change patterns in Amazonia and biodiversity. Nat Commun 4, 1411. Chmeleff, J., von Blanckenburg, F., Kossert, K., Jakob, D., 2010. Determination of the 10Be half-life by
multicollector ICP-MS and liquid scintillation counting. Nuclear instruments and methods in physics research B. 268(2), 192-199.
Colman, S.M., Kaufman, D.S., Bright, J., Heil, C., King, J.W., Dean, W.E., Rosenbaum, J.G., Forester, R.M., Bischoff, J.L., Perkins, M., McGeehin, J.P., 2006. Age model for a continuous, ca 250-ka Quaternary lacustrine recordfrom Bear Lake, Utah–Idaho. Quaternary Science Reviews 25, 2271–2282.
Croudace, I.W., Rindby, A., Rothwell, R.G., 2006. ITRAX: description and evaluation of a new multifunctional X-ray core scanner. In: Rothwell, R. (Ed.), New Techniques in Sediment Core Analysis. Geol Soc SP, pp. 51–63.
Cruz, F.W, Burns, S.J., Karmann, I., Sharp, W.D., Vuille, M., Cardoso, A.O., Ferrari, J.A., Dias, P.L.S., Viana, O. Jr, 2005. Insolation-driven changes in atmospheric circulation over the past 116,000 years in subtropical Brazil. Nature 434, 63–66.
Cruz, F.W., Burns, S.J., Karmann, I., Sharp, W.D., Vuille, M., 2006. Reconstruction of regional atmosphere circulation features during the late Pleistocene in subtropical Brazil from oxygen isotope composition of speleothems. Earth Planet Sci Lett 248, 494–506.
Demory, F., Uehara, M., Quesnel, Y., Rochette, P., Romey, C., Tachikawa, K., Garcia, M., Borschneck, D., Pignol, L., Bard, E., Andrieu-Ponel, V., 2019. A New High Resolution Magnetic Scanner for Sedimentary Sections. Geochem., Geophys., Geosyst., 20, 3186–3200.
Demory, F., Rambeau, C., Lebatard, A.E., Perrin, M., Blawal, S., Andrieu-Ponel, V., Rochette, P., Alcicek, H., Boulbes, N., Bourlès, D.L., Helvaci, C., Petschick, R., Mayda, S., Moigne, A.M., Nomade, S., Ponel, P., Vialet, A., Alcicek, M.C., ASTER Team, 2020. Chronostratigraphy, depositional patterns and climatic imprints in Lake Acigöl (SW Anatolia) during the Quaternary. Quaternary Geochronology 56, 101038.