HAL Id: cea-02431811
https://hal-cea.archives-ouvertes.fr/cea-02431811
Submitted on 8 Jan 2020
HAL is a multi-disciplinary open access
archive for the deposit and dissemination of
sci-entific research documents, whether they are
pub-lished or not. The documents may come from
teaching and research institutions in France or
abroad, or from public or private research centers.
L’archive ouverte pluridisciplinaire HAL, est
destinée au dépôt et à la diffusion de documents
scientifiques de niveau recherche, publiés ou non,
émanant des établissements d’enseignement et de
recherche français ou étrangers, des laboratoires
publics ou privés.
Development of a continuous O/M measurement
technics during sintering for MOX application
S. Vaudez, J. Lechelle, S. Berzati
To cite this version:
S. Vaudez, J. Lechelle, S. Berzati. Development of a continuous O/M measurement technics during
sintering for MOX application. ATALANTE 2016, Jun 2016, Montpellier, France. �cea-02431811�
1
Development of a continuous O/M measurement technics during sintering for MOX application
S. Vaudez1, J. Lechelle2 and S. Berzati1
1
DEN/MAR/DETC/SECA/LFC, 2DEN/CAD/DEC/SESC/LLCC
1. Introduction
The fabrication process of mixed uranium plutonium oxide (MOX) for Sodium Fast Reactor (SFR) and Light Water Reactor (LWR) is based on powder metallurgy processes including UO2 and PuO2 powder
mixing step to reach the final Pu concentration of around 30%wt and 10%wt respectively. The mixture is pelletized and sintered at about 1700°C under reducing atmosphere of Ar/4%H2/H2O. To control the
fuel characteristics (e.g. density and O/M ratio), it is crucial to control the sintering atmosphere and especially the oxygen partial pressure (pO2) throughout the thermal cycle [1, 2]. It’s the reason why an
original analysis method has been developed for a better understanding of the densification mechanisms and the O/M ratio evolution during the sintering step. This paper is focused on the description of this technics and its application to the UO2 and PuO2 sintering.
2. Experimental
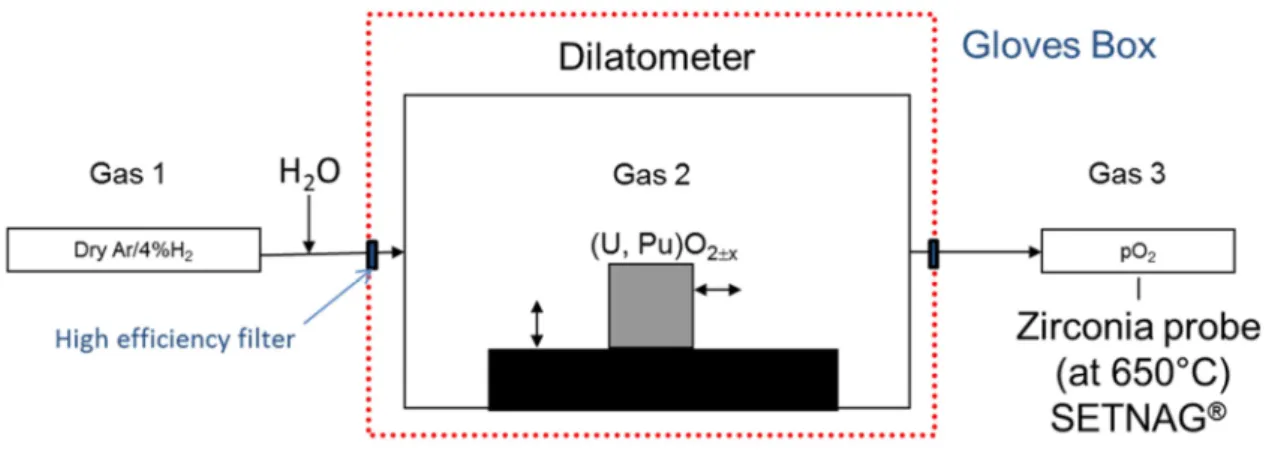
The densification behavior of the pellet and the pO2 evolution of the sintering gas were assessed using
a vertical dilatometer (SETARAM TMA92-16.18) coupled with a SETNAG® zirconia probe. The latter is implemented at the furnace outlet (see figure 1) and operates at 650°C with a metallic reference. The zirconia probe measures continuously the amount of O2 exchanged between the solid sample and
its atmosphere. The incoming H2 gas partial pressure is measured with gas chromatography (typically
4 vol.%) and the humidity rate of the inlet gas is determined with a capacity probe device (from Vaisala company). A blank measurement of pO2 was taken prior to any experiment in order to assess the pO2
of the carrier gas.
The pO2 monitored throughout the sintering cycle with the sample combines the oxygen of the carrier
gas and the oxygen added (or deducted) from the redox reactions during the sintering so that these measurements can be used to evaluate the redox reaction of actinide oxides throughout the sintering thermal cycle [3], as illustrated in the next section.
Figure 1: Schematic view of the dilatometer coupled with the zirconia probe to control the PO2
evolution of the sintering gas throughout the thermal cycle 3. Results and Discussion
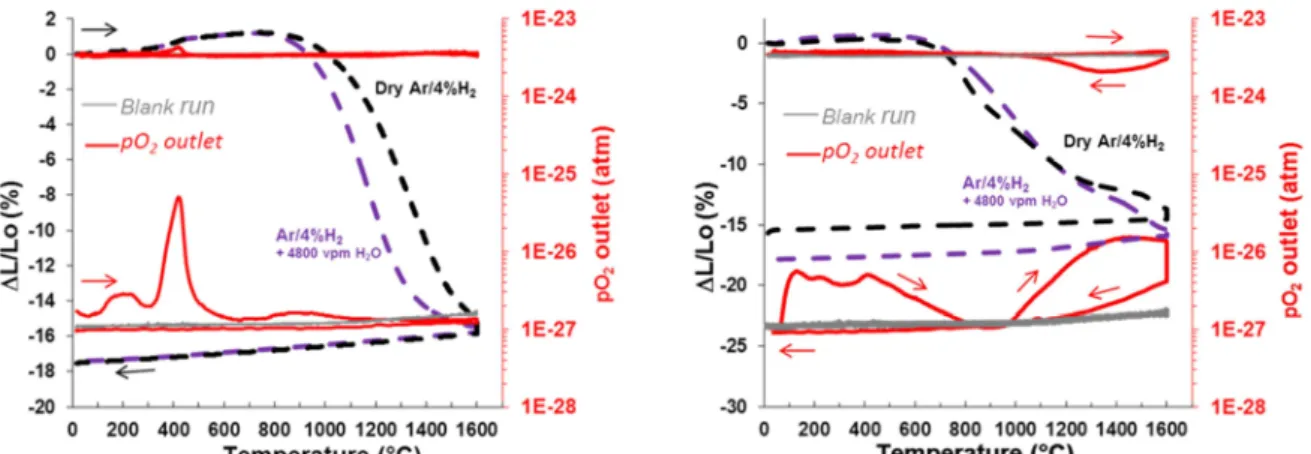
The experiments on UO2 and PuO2 samples are illustrated in figure 2. The relative shrinkage ∆L/L0
(dotted lines) is given versus temperature as well as the measured pO2 (red lines) during heating (right
arrow) and cooling (left arrow). Grey curves are the pO2 measurement results without any sample: it
2
Figure 2: dilatometric studies of the densification of UO2 (left) and PuO2 (right) samples under
dry Ar/4%H2 (black curve) and Ar/4%H2 + 4800 vpm H2O (violet curve) combined with pO2 gas
outlet measurement (red curve with wet atmosphere on the top, dry atmosphere at the bottom).
Under wet Ar/4%H2, the shrinkage temperature of UO2 is shifted to the lower temperatures compared
to the experiment under dry Ar/4%H2, consistent with the results of literature [2]. A large O2 release
peak between 300 and 600°C is directly linked to the reduction of UO2+x into UO2.00, occurring before
the densification (note that the peak at low temperature is due to the water desorption from the fuel surface) [2]. Above 600°C and during cooling, the sample is close to the thermodynamic equilibrium with the carrier gas and the slight pO2 variations correspond to the slight O/U ratio evolution.
As regards PuO2 sample, the shrinkage curve under wet Ar/4%H2 is, in contrast to the previous case,
delayed in temperature up to 1200°C compared to that in dry Ar/4%H2. Above 1200°C, the opposite
happens. Two large peaks of O2 release are recorded. The first peak up to 700°C is related to the
elimination of adsorbed species, as observed elsewhere [3]. The second peak within the temperature range of 1200 -1600°C and during the plateau is consistent with the reduction of PuO2 into PuO2-x.
During cooling, pO2 decreases in each case, but the pO2 curve is above the blank curve in dry
atmosphere and below in wet one, pointing out in the latter case an oxidation reaction.
Knowing the pO2 evolution at each time of the sintering cycle, the O/M evolution is calculated in
function of the temperature as illustrated for the PuO2 case in figure 3 (note that for UO2, there is no
evolution of O/U above 1000°C).
Figure 3: experimental variation in the O/M ratio during the sintering of PuO2 under Ar/4%H2 +
50 vpm H2O (black curve) and Ar/4%H2 + 4800 vpm H2O (red curve) during heating (right arrow)
and cooling (left arrow).
Under dry and wet sintering gas, a continuous decrease in the O/M can be observed during heating and the plateau, as expected according to the thermodynamic calculations [4, 5]. The lower the pO2,
3
the smaller the O/M at high temperature. The difference between wet and dry atmosphere is however significant during the cooling. Under wet atmosphere, the sample gets oxidized again and the O/M ratio tends to 2.00 around 1000°C, as expected. On the contrary, no O/M evolution was seen during cooling under dry atmosphere. More generally, such a significant deviation between thermodynamic and experimental O/M is observed for MOX pellets with high Pu content whatever the temperature in reducing conditions (O/M<2.00).
4. Conclusions and outlook
By coupling a dilatometer and a zirconia probe, it was possible to identify the different redox phenomena and to assess the evolution of the O/M ratio of the oxides at each time of the densification process. It was shown that under certain conditions, the thermodynamic equilibrium between gas and fuel is long to be reached so that it can be difficult to control and predict O/M ratio, especially for SFR-type fuel (sintered in reductive conditions). Thanks to this equipment, it is possible to recommend the best sintering atmosphere and thermal cycle to obtain a high density and an O/M ratio close to the target value.
5. References
[1] Hj. Matzke, J. Chem. Soc. Faraday Trans. 83 (1987) 1121.
[2] S. Berzati, S. Vaudez, R. C. Belin, J. Lechelle, Y. Marc, JC. Richaud, JM. Heintz J. Nuc. Mat., 447 (2014) 115-124.
[3] X. Wang, G. Li, Proc 180, Pu Futures 2014, Las Vegas
[4] S. Vaudez, J. Lechelle, S. Berzati, JM. Heintz J. Nuc. Mat., 460 (2015) 221–225.
[5] C. Guéneau, N. Dupin, Bo Sundman, C Martial, JC Dumas, S. Gosse, S. Chatain, F. De Bruycker, D. Manara, R. J. M.Konings, J. Nuc. Mat 419 (2011) 145-167.