A
Advanced aerospace procurement models with sensitivity analysis and optimized demand allocation
by Jason R. Kary
B.S. Mechanical Engineering, Pennsylvania State University (2000)
Submitted to the Sloan School of Management and the Engineering Systems Division in Partial Fulfillment of the Requirements for the Degrees of
Master of Business Administration and
Master of Science in Engineering Systems
In Conjunction with the Leaders for Manufacturing Program at the Massachusetts Institute of Technology
June 2006
©2006 Massachusetts Institute of Technology. All rights reserved.
Signature of Author
/
--~ -'7~
Ji)
Sloan School of Management Engineering Systems Division May 12, 2006
Certified by
Donald B. Rosenfield, Thesis Supervisor Senior Lecturer, Sloan School of Management
Certified by
David Simchi-Levi, Thesis Supervisor
Professor of Engineering Systems Division & Civil and Environmental Engineering
Accepted by
Debbie Berechman, Executive Director, MBA Program Sloan School of Management
Accepted by
) Richard de Neufville, Prc orof Er{gineering Systems Ihair, Engineering Systems Division Education Committee
MIT Thesis - Jason R. Kary
BARKER
MASSA S INSTITUTE OF TECHNOLOGYAUG 3
1 2006
UBRARIES
__ Page I of 80[This page intentionally left blank]
Advanced aerospace procurement models with sensitivity analysis and optimized demand allocation
by Jason R. Kary
Submitted to the Sloan School of Management and Engineering Systems Division on May 12, 2006
in partial fulfillment of the requirements
for the Degrees of Master of Business Administration and Master of Science in Engineering Systems Abstract
The impact of the sourcing function on the profitability of U.S.-based manufacturing firms is more significant than ever. Today, the purchased component of the cost of goods sold for many firms is more than fifty-percent of sales.' As the volume of purchased material grows every year, and the sourcing function impacts corporate profitability more and more, it has become critical that effective analysis techniques and cost models are used in the development and execution of sourcing strategies. Perhaps the most critical element of the sourcing process is the determination of the optimal supplier or portfolio of suppliers who will be responsible for providing purchased materials.
This thesis explores the allocation of outsourced material demand to the supply base in the aerospace industry. A significant portion of this research involves the development of a framework to support a strategic sourcing organization in the determination of the most appropriate portfolio of suppliers for a group of similarly manufactured parts. This framework combines total cost sensitivity analysis and demand allocation programming.
The results of this thesis are intended to present sourcing managers with a framework that can be applied when comparing U.S.-based manufacturers to low-cost international suppliers. The total cost sensitivity analysis enables the sourcing manager to evaluate the impact of supply chain dynamics including tax rates and currency fluctuation, as well as variations in supplier performance on procurement decisions. Using the total cost model output, a sourcing manager is then able to apply the demand allocation programming model to determine the optimal supplier portfolio given aerospace industry constraints and the operational requirements of the organization studied. The demand allocation programming model is developed as a mixed integer linear program (MILP).
The basis for the thesis analysis was a six month internship with a major U.S. aerospace OEM. The research was based on hands-on commodity management experience, literature review, and work with sourcing, finance, and operations professionals.
Thesis Supervisor: Donald Rosenfield
Title: Senior Lecturer, Sloan School of Management Thesis Supervisor: David Simchi-Levi
Title: Professor of Engineering Systems Division & Civil and Environmental Engineering
ASCET: Best Practices in Procurement
[This page intentionally left blank]
ACKNOWLEDGMENTS
I wish to extend my sincere appreciation to the United Technologies Corporation (UTC), the UTC Aerospace Supply Management Team, and the entire UTC Corporate Operations team for
sponsoring my internship. I would like to recognize the contributions of Rick O'Donnell, without his support, my internship would not have taken place. Special thanks to Steve Nelson for his mentorship and supervision during my internship.
I am grateful for the advice and encouragement of my thesis advisors, Donald Rosenfield and
David Simchi-Levi, who were integral in the development of my thesis research. It was truly a great learning experience working with two of the leaders in the field of supply chain
management.
My deepest thanks and appreciation goes to the Leaders for Manufacturing (LFM) Program - the administration and staff, my classmates, the professors of both the Sloan School of Management and the School of Engineering and the entire LFM community.
Finally, I would like to thank my family for their support throughout LFM. Most importantly, I would like to thank my wife, Sophia, for her love, support, guidance and patience over the past two year years - I could not have done it without you.
[This page intentionally left blank]
Table of Contents
IN TR O D U C TIO N ... 8
1.1 CONTEXT AND OVERVIEW ... 8
1.2 PROBLEM IDENTIFICATION ... 8
1.3 SETTING ... 9
1.4 O BJECTIVES AND M ETHODS ... 9
1.5 O UTLINE...9
2 TH E A ER O SPA C E IN D U STRY ... 11
2.1 A EROSPACE INDUSTRY PROFILE ... 11
2.2 A EROSPACE SUPPLY CHAIN ... 14
2.3 A EROSPACE M ARKET FORCES AND TRENDS ... 15
2.4 IM PACT OF TRENDS ON AEROSPACE SOURCING ... 20
2.5 INHERENT AEROSPACE SOURCING COM PLEXITY ... 23
3 UTC AND THE AEROSPACE SUPPLY MANAGEMENT TEAM ... 26
3.1 U TC AND THE AEROSPACE INDUSTRY ... 26
3.2 U TC SOURCING OPERATIONS ... 31
3.3 A EROSPACE SUPPLY M ANAGEMENT TEAM ... 31
3.4 ASM STRATEGIC SOURCING APPROACH (8-STEP SOURCING PROCESS) ... 35
3.5 ASM SOURCING ANALYSIS AND ALLOCATION DECISION COMPLEXITY ... 35
4 SENSITIVITY OF TOTAL COST ANALYSIS...37
4.1 TOTAL COST ANALYSIS...37
4.2 RELEVANT COST FACTORS...38
4.3 IMPORTANCE OF SENSITIVITY ANALYSIS ... 40
4.4 COST M ODEL ... 40
4.5 RESULTS OF ANALYSIS ... 47
4.6 LIM ITATION OF ANALYSIS ... 47
5 DEMAND ALLOCATION TO THE SUPPLY BASE...47
5.1 N EED FOR DEM AND ALLOCATION M ODEL ... 47
5.2 M ODEL OBJECTIVE ... 47
5.3 MODEL APPROACH - MIXED-INTEGER LINEAR PROGRAM ... 47
5.4 M ODEL DEVELOPM ENT...47
5.5 M ODEL INPUTS...47
5.6 M ODEL OUTPUT...47
5.7 SUM M ARY OF OPTIM IZATION RESULTS ... 47
5.8 LIM ITATIONS OF OPTIM IZATION MODEL ... 47
6 CO N C LU SIO N ... 47
6.1 SUM M ARY OF RESULTS...47
6.2 BENEFITS OF THE M ODELS...47
6.3 O PPORTUNITIES FOR FUTURE RESEARCH ... 47
7 BIBLIO G R A PH Y ... 47
8 A U T H O R 'S BIO G R A PH Y...47
9 APPENDIX A - TOTAL COST SENSITIVITY MODEL ... 47
10 APPENDIX B - DEMAND ALLOCATION MODEL ... 47
Introduction
The purpose of this chapter is to give an overview of the thesis, and to provide the reader with the context and motivation for the research. This chapter defines the challenges addressed, as well as describes the environment in which the analysis was conducted. This chapter concludes with an outline of the thesis structure.
1.1 Context and overview
The impact of supply management on the profitability of U.S.-based manufacturing firms is more significant than ever. As vertical integration has decreased, the purchased component of the cost of goods sold (COGS) for many firms has grown to more than fifty-percent of sales.2 Put another way, more than half the value provided to the end-customer is by someone other than the original equipment manufacturer (OEM).
Supply management, or sourcing as it is more commonly known, has become a preferred operational management lever, given its ability to quickly and effectively impact financial performance. In fact, Fitzgerald contends that sourcing impacts company profitability "faster
and more dramatically than any other corporate function."3
As the volume of purchased material grows every year and the sourcing function impacts corporate profitability more and more, it has become critical that effective analysis techniques and cost models are used in the development and execution of sourcing strategies. Perhaps the most critical element of the sourcing process is the determination of the optimal supplier or portfolio of suppliers who will be responsible for providing purchased components. After all, the
supplier or suppliers awarded a procurement contract will need to ensure that material is provided on-time, that targeted cost reductions are achieved and that end-customer demand is successfully fulfilled.
1.2 Problem identification
Although many factors have led companies to increase sourcing activities, one of the most significant motivating forces has been the promise of achieving PPV or purchase price variance goals using international suppliers. International sourcing is viewed not only as a way to achieve targeted cost reduction, but also as a means of gaining access to coveted high-growth markets. Many industries have utilized international suppliers to achieve both ends, yet the aerospace industry has been slow to follow. In fact, a 2005 study conducted by the Institute for Supply Management revealed that 90% of aerospace industry sourcing is from U.S. suppliers.4 As a
result, many leading aerospace firms have recently turned their attention to international sourcing opportunities in an effort to meet aggressive cost reduction targets established by the large commercial jetliner manufacturers and the U.S. government - to say nothing of shareholders. The sourcing allocation decision process becomes increasingly complex as overseas suppliers are
2 ASCET: Best Practices in Procurement
3 ASCET: Best Practices in Procurement
4 CAPS Center for Strategic Supply Research: Purchasing Performance Benchmarking Reportfor the Aerospace / Defense Industry
considered. Historically, supplier comparisons and allocation decisions concerned suppliers located in the same country and in many cases the same region, state or even town. Now sourcing managers are considering unknown suppliers with little or no aerospace experience located halfway around the world. An effective and efficient total cost analysis process is difficult with local, known entities, but with new international suppliers, the analysis methodology requires reevaluation.
Moreover, a basic total cost evaluation is insufficient given the dynamics of the current market place - tax rate variability, currency fluctuation, disproportionate quality and unknown supplier capacity preclude utilization of a static, point-forecast model to effectively determine which
supplier to use. In addition, given the increasing demand for aerospace products, multiple suppliers may be required to completely fulfill demand requirements.
The focus of this research is on the sourcing allocation decision process, specifically developing a framework for determining the most appropriate allocation of sourced demand to the supply base. The framework was developed for a sourcing organization within the aerospace industry that is responsible for aggregating demand across several business units and ensuring both
fulfillment and cost reduction.
1.3 Setting
This research and analysis was developed over the course of a six month internship with the United Technologies Corporation (UTC) as partial fulfillment of the requirements for the Leaders for Manufacturing program at the Massachusetts Institute of Technology. The models presented in this thesis were developed in conjunction with activities as a member of the UTC Aerospace Supply Management team, an organization chartered to aggregate the purchased demand of the three aerospace business units of UTC.
1.4 Objectives and Methods
The frameworks presented in this paper were developed from modeling and analysis, as well as "hands-on" work as a commodity manager with the UTC Aerospace Supply Management team. The foundations of the model are based on discussions, meetings and interactions with the Aerospace Supply Management team, as well as members of the operations and finance functions. The development of the models and frameworks presented were encouraged and
supported by UTC. The modeling and analysis are intended to be used by the Aerospace Supply Management team in the development and execution of the sourcing strategies across a variety of commodities.
Although the internship and related research focused specifically on the aerospace industry, the results of this thesis work can be adapted and applied to other industries and the sourcing function in general.
1.5 Outline
This thesis is divided into six chapters. The following summaries provide an overview of the content in the balance of the thesis chapters:
Chapter 2, The aerospace industry profiles the U.S. market. The chapter provides an overview of the industry structure and product offerings, as well as identifies the firms operating in the market place. In addition, the industry supply chain is outlined for the reader. The chapter also contains a review of the industry trends and concludes with an examination of the impact of the industry trends on the sourcing function.
Chapter 3, UTC and the Aerospace Supply Management team discusses the structure and financial performance of the Corporation across its business units. An overview of the structure, objective, and operations of the Aerospace Supply Management team is also offered.
Chapter 4, Sensitivity of total cost analysis presents a total cost framework for the Aerospace Supply Management team. The framework includes all cost factors relevant to the evaluation of buy-to-buy decisions focusing on the analysis of a domestic supplier relative to that of a low-cost international supplier. The model provides sourcing managers with an understanding of net present value impact of the variation of several criteria including international tax rates, currency fluctuation and supplier delivery and quality performance.
Chapter 5, Demand allocation to the supply base offers a programming model that optimally allocates the demand to the supply base given the operational constraints of the aerospace industry and the organizational requirements of the UTC Aerospace Supply Management team. The programming model provides the sourcing manager with an understanding of the cost tradeoffs associated with different sourcing allocation profiles.
Chapter 6, Conclusion provides a summary of the findings presented in this thesis. This section concludes with thoughts on potential avenues for future research in the area of total cost analysis and sourcing allocation.
2 The aerospace industry
This chapter provides a brief overview of the U.S. aerospace industry. The objective of this chapter is to provide the reader with sufficient understanding of the aerospace supply chain structure and industry trends. It is important the reader has a working knowledge of the industry dynamics and how they impact the sourcing challenges addressed by the thesis research. This chapter is not intended to be inclusive, but rather provide the reader with a basic understanding of the U.S. aerospace industry.
As a point of reference, the defense sector is often incorporated in discussions of the aerospace industry given the considerable role of aircraft systems in national defense; however, for the purposes of this thesis, considerations of the defense sector are limited to aircraft and aircraft related products, systems and services.
2.1 Aerospace industry profile
This section defines the U.S. aerospace industry for the reader and goes on to outline the industry structure and market segmentation. This section concludes by providing a breakdown of the
2005 sales figures and a brief review of the U.S. aerospace trade balance.
2.1.1 Aerospace industry defined
The aerospace industry, defined by the U.S. Bureau of Labor Statistics as those companies whose business comprises of "producing aircraft, guided missiles, space vehicles, aircraft engines, propulsion units, and related parts... [and] aircraft overhaul, rebuilding, and related parts," is a significant contributor to the overall U.S. economy.5 The U.S. aerospace industry
generated sales of $170 billion (B) in 2005.6 These sales represent only aerospace equipment and do not correspond to the overall economic benefit the aviation industry provides. A 2002 study conducted by DRI-WEFA, concluded that commercial aviation accounted for 4.4% of total
U.S. GDP and more than 5 million jobs.7 These numbers do not include the impact of the military segment of the industry which undoubtedly contributes to a larger percentage of GDP, as well as additional jobs, but do include benefits associated with airport and airline operations. Overall, the importance of the aerospace industry to the U.S. economy is undeniable.
2.1.2 Aerospace industry structure
The aerospace industry is easily divided into three segments: (1) military, (2) civil and (3) space. The military segment of the industry corresponds to aerospace products utilized for defense purposes and is traditionally purchased by government entities. Conversely, the civil segment of the aerospace industry corresponds to the use of aircraft for the transport of commercial
passengers or cargo for non-military applications. In addition to the commercial sector, the civil aircraft segment also includes general aviation aircraft. General aviation aircraft range from small two-seater planes used for leisure to corporate jets used for business purposes. Lastly, the
' U.S. Bureau of Labor Statistics: Aerospace Products and Parts Manufacturing (NAICS 3364) 6 Aerospace Industries Association: 2005 Year-End Review and 2006 Forecast
7 DRI-WEFA: The National Economic Impact of Civil Aviation.
8 U.S. Bureau of Labor Statistics: Aerospace Product and Parts Manufacturing. (NAICS 3364)
space segment typically corresponds to products and services for NASA, space-related Department of Defense (DOD) programs and commercial satellites.
Figure 2.1 provides a graphical representation of the U.S. aerospace industry.
U.S. Aerospace Industry
Civil
Part & Service
General Aviattor Fe -wigArR
Military - Parts I raft -Missiles Space ___________________________________
I_________________
NASA -1I
Commercial Satellites D.O.DFigure 2.1: U.S. aerospace industry structure
The thesis research is predominantly concerned with those industry segments highlighted in Figure 2.1.
2.1.3 The aerospace market
This section defines the U.S. aerospace market through an evaluation of the 2005 U.S. industry sales figures and a review of the trade balance.
2.1.3.1 2005 U.S. aerospace sales breakdown
Overall, 2005 sales of $1 70B consisted of $39B from the civil aerospace sector, $50B from military and the balance from a combination of missiles, space and other aerospace related products.9 A breakdown of the 2005 U.S. aerospace sales is provided in Table 2.1.
9 Aerospace Industries Association: 2005 Year-End Review and 2006 Forecast
Civil
Large Commercial Jetliners General Aviation Helicopters $ 39.00 B $_22.00 B $ 8.50 B $ 0.75 B
Parts and Service $ 8.OOB
Military $ 50.00 B
Missiles, space and other aircraft related products $ 81.00 B
TOTAL $170.00 B
Table 2.1: 2005 U.S. aerospace industry sales0
The $22B in large commercial jetliner sales in Table 2.1 corresponds to shipment of 290 aircraft."
2.1.3.2 U.S. aerospace trade balance
The aerospace industry is a global economic force, yet it is dominated by the U.S. and Europe, both in terms of manufacturing infrastructure and aircraft sales. The U.S. does have a trade
surplus in the aerospace industry as made evident by Figure 2.2. This trade surplus is driven mainly by the sale of Boeing's large commercial jetliners. According to a 2005 Department of
Commerce report on the U.S. air transportation industry, three out of every four Boeing planes are exported.'2 The surplus has been challenged by the growth of European jetliner
manufacturer Airbus, who for the first time in 2003 sold more large airframes than Boeing.'3 70 0 0 60 -50 -40 -30 -20 -10 0 M -4 W W Q . W N 0 M -4 W W W N
Figure 2.2: U.S. trade of aerospace products 14
10 Aerospace Industries Association: 2005 Year-End Review and 2006 Forecast
" Aerospace Industries Association: 2005 Year-End Review and 2006 Forecast
12 U.S. Department of Commerce: The U.S. Jet Transport Industry 13 U.S. Department of Commerce: The U.S. Jet Transport Industry
14 Aerospace Industries Association: 41s Annual Year End Review & Forecast Luncheon
MIT Thesis - Jason R. Kary Page 13 of 80
2.2 Aerospace supply chain
The aerospace industry supply chain is best viewed as a tiered pyramid. Each tier of the pyramid represents a level of the supply chain, with the lower levels supporting those above by providing products and services. At the top of the pyramid are the manufacturers of the jetliners and military aircraft, known as airframers. At the bottom of the pyramid are the thousands of
sub-tier suppliers that provide components, parts, materials and services that are ultimately used in the products manufactured by the airframer. Between the airframers and the sub-tier suppliers are the engine system manufacturers, the major sub-system suppliers and the tier-one suppliers.
The aerospace supply chain pyramid is provided in Figure 2.3.
Level -1Air-Level-framers Engine System Leve - 2Manufacturers / Level-32 Major Sub-system Suppliers
Level - 3 Tier-One Suppliers
Level - 4 Sub-tier Suppliers
Figure 2.3: Aerospace supply chain pyramid
The pyramid is an apt graphical representation. The vertical component of the pyramid corresponds to the supply chain hierarchy and the horizontal component corresponds to the number of firms occupying each level of the supply chain.
As stated, the vertical component represents the hierarchy of the supply chain. The airframers are at the top of the pyramid. To a large extent, the supply chain power lies with the airframer who chooses which suppliers' products are to be incorporated on a new airframe design. This power is limited to the extent the end-customer selects the suppliers to be incorporated on the purchased aircraft.
Although not without exception, industry interaction conforms to the pyramid structure. The
Level-I airframers interact directly with the Level-2 engine system manufacturers and the major sub-system suppliers. To a lesser extent, the airframers may interact with the Level-3 tier-one
suppliers. In general, supply chain entities engage most often with members one level from their
own position in the pyramid and less so with members two levels removed from their own. Rarely will a firm engage with firms more than two levels from their own.
The horizontal component of the pyramid corresponds to the number of firms participating in that level of the supply chain level. Given that the aerospace industry is highly concentrated, only a handful of manufacturers produce commercial and military aircraft.1 5 In fact, the U.S. and
Europe are the only regions currently producing significant volumes of both commercial and military aircraft. Boeing and Airbus are the only providers of large commercial airliners.
Likewise, Lockheed Martin and Boeing in the U.S. and BAE systems in the European Union are the leading players in the military airframe segment. Therefore, the top of the pyramid is
occupied by only four firms.
Meanwhile, the bottom of the pyramid is occupied by thousands of sub-tier suppliers, many of whom would not consider themselves engaged in aerospace industry activities. Although many aerospace firms are actively pursuing efforts to reduce their supply base, a process known as supplier rationalization, during a one year period from 2003 to 2004, Boeing paid over 32,000 suppliers for their parts and services.16
Some of the key firms in the airframer, engine systems manufacturer and major sub-system supplier levels of the supply chain pyramid are provided below for the reader's reference: 7
Airframers: Boeing Airbus
Lockheed BAE
Engine Systems: Pratt & Whitney Aircraft Engines General Electric Aircraft Engines Rolls Royce
Malor Sub-systems: Carlyle Group BAE Systems
Eaton Finemeccanica SpA
Hamilton Sundstrand Kohlberg Kravis Roberts
Goodrich Smiths Group
Harris Corporation Thales Honeywell International Volvo Aero Parker Hannifin Corporation Rockwell Collins
Having profiled the aerospace industry and its supply chain structure, it is appropriate to review some of the industry trends that are driving sourcing challenges and complexity.
2.3 Aerospace market forces and trends
This section consists of an examination of the market forces and trends in both the civil and military segments of the aerospace industry followed by a trend summary.
" Datamonitor: Global Aerospace & Defence Industry Profile
16 U.S. Department of Commerce: The U.S. Jet Transport Industry 17 U.S. Department of Commerce: The U.S. Jet Transport Industry
2.3.1 Civil aerospace market forces
Orders of civil aircraft tend to be closely tied to the economic health of the airline industry and more generally, the economy as a whole.'8 Figure 2.4 depicts growth of aerospace industry sales
since 1990. The reader will note the correlation between industry sales and the health of the U.S. economy. Industry revenues increased during the economic-boom years of the late 1990's followed by a leveling off and subsequent decline after 2001. Moreover, a decline in sales is evident during the recessionary years of the early 1990's.
200 - 175- 150-0 125 -100 0 S75-0 50 -5 25-0 WD co WD WD co WD WD W to W ) CD0 0 0 0 0D 0D 0 WD to W W CD Wt C> CD C1 0 C QD CD00 oa 40k~)C. . Ml 0M -J Go0 CD 0 ~ Ci (DC 0
Figure 2.4: U.S. aerospace industry sales'9
Beyond the correlation to overall economic health, there are trends both positively and negatively influencing the growth of the civil segment of the U.S. aerospace industry. Three notable trends positively influencing the growth of the civil segment of the U.S. aerospace industry are (1) the growth of international air travel, (2) the growth of the domestic low cost carrier market segment and (3) economic recovery.
(1) Growth of international air travel: Overall foreign sales are up from $57B in 2004 to
$65.4B in 2005. Not surprisingly, $55B of the $65.4B, or 84% of foreign sales were in 21
the civil aerospace segment. In 2005, exports of large commercial jetliners, the largest component of civil aircraft exports, were up $3B to $22B.2
2 Moreover, general aviation
aircraft exports increased 48% to $2.2B.2 3 The increase in sales has been buffeted by
18 U.S. Department of Commerce: The U.S. Jet Transport Industry
19 Aerospace Industries Association: 41" Annual Year End Review & Forecast Luncheon 20 Aerospace Industries Association: 2005 Year-End Review and 2006 Forecast
2 1Aerospace Industries Association: 2005 Year-End Review and 2006 Forecast 2 Aerospace Industries Association: 2005 Year-End Review and 2006 Forecast
23 Aerospace Industries Association: 2005 Year-End Review and 2006 Forecast
international air travel which is growing a full 2% faster than that of domestic air travel. As a result, Boeing is more reliant than ever on international markets, with three of every four planes being exported.25
(2) Growth of the domestic low cost carrier market segment: The low cost carrier
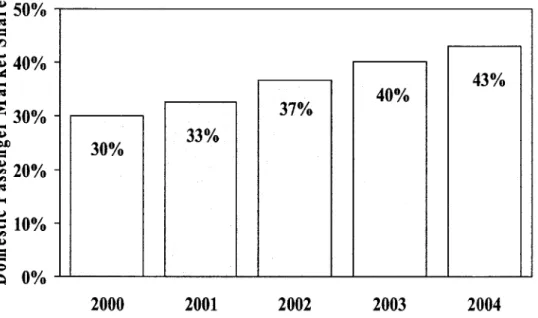
segment of the U.S. commercial aviation industry continues to gain market share. Figure
2.5 shows that the market share of the low cost carrier segment has increased from 30%
in 2000 to 43% in 2004.26 This segment is led by Southwest Airlines and Jet Blue Airways who have remained profitable and expanded over a period in which several
legacy carriers have filed for bankruptcy protection.
' 50% 40%- 30%- 20%-1 0% 0%) 2000 2001 2002 2003 2004
Figure 2.5: Low cost carrier market share growth27
(3) Economic recovery: Overall economic recovery since the tragic events of September 11,
2001 has helped increase sales of aircraft across the portfolio of products from large commercial jetliners to small general aviation aircraft. In addition to increases in aircraft
sales, commercial passenger volumes have exceeded 2001 levels for the first time per Figure 2.6.
24 Federal Aviation Administration: FAA Aerospace Forecast 2005-2016 [Report] 2 5
U.S. Department of Commerce: The U.S. Jet Transport Industry
26 Federal Aviation Administration: FAA Aviation Forecasts Fiscal Years 2005-2016 [Slides] 27 Federal Aviation Administration: FAA Aviation Forecasts Fiscal Years 2005-2016 [Slides]
MIT Thesis - Jason R. Kary Page 17 of 80
43% 40%
660 ' 640 -- 620 - 600- 580- 560-S540 - 520-2000 2001 2002 2003 2004 2005
Figure 2.6: Post September 11, 2001 air travel recovery2
There is one notable trend negatively influencing the growth of the civil segment of the U.S. aerospace industry - the struggles of the commercial legacy carriers. Several factors, including but not limited to the rise in oil prices and the cost of employee health care and pensions have led several legacy carriers to file for bankruptcy since 2001. Delta Air Lines, United Airlines and Northwest Airlines are the most prominent names on the list of U.S. carriers
currently operating under bankruptcy protection. The struggles of these and other carriers have led to significant losses in the commercial aviation industry since 2001. In fact, the Federal Aviation Administration (FAA) reports industry losses in excess of $25B from 2001 to 2004, per
Figure 2.7.
28 Federal Aviation Administration: FAA Aviation Forecasts Fiscal Years 2005-2016 [Slides]
MIT Thesis - Jason R. Kary Page 18 of 80
641.2 649.6
626.8 627.2
587.9 574.5
$6.0 $3.0-Cos $3.6 V $0.0-(-$3.0 ($4.5) ($4.7) 0 $.0 ($5.4) S-$6.0--$9.0 ($10.9) -$12.0-2000 2001 2002 2003 2004
Figure 2.7: Struggles of the U.S. commercial passenger carriers29 2.3.2 Military aerospace market forces
The U.S. government is a major purchaser of aircraft and aerospace equipment for the DOD. In 2003, the U.S. government spent $417.4 B on defense.30 Although not all $417.4 B is aerospace related, the fact that 47% of the global defense spending is by the U.S. government, makes the DOD a non-trivial market force. i Within the military segment of the aerospace industry, growth is driven predominantly by the level of active military engagement and technology spending. Industry-wide sales since 1990, per Figure 2.4 on page 16, also correspond well with military market drivers. Military spending dropped in the early 1990's, correlating to the period immediately following the end of the Cold War. Conversely, the level of DOD spending increased in the years following 2001 as the U.S. became engaged in wars both in Afghanistan and Iraq. In fact, the military portion of aerospace revenues increased from 25% in 2002 to 30% in 2004.32
Additionally, over this same period military spending has been driven by the need for new technologies to fight the battles of the 21st Century. As the U.S. and its allies transition their
defense programs to fight the War on Terror rather than the Cold War, the Joint Strike Fighter has been developed to replace the aging and increasingly obsolete fighter-jet fleet. The Joint Strike Fighter is one example of the Research, Development, Testing and Evaluation or RDT&E spending that is responsible for the 7% growth in the $50B military aerospace segment.3 3
29 Federal Aviation Administration: FAA Aviation Forecasts Fiscal Years 2005-2016 [Slides] 3 0
PriceWaterhouseCoopers: The Defence Industry in the 21" Century
3 PriceWaterhouseCoopers: The Defence Industry in the 21s' Century
32 Aerospace Industries Association: 41' Annual Year End Review & Forecast Luncheon
3 Aerospace Industries Association: 41" Annual Year End Review & Forecast Luncheon
2.3.3 Aerospace industry trend summary
In summary, the demand for aerospace equipment has increased following the tragic events of September 11, 2001, driven predominantly by defense spending and overall economic health. Economic recovery, highlighted by international growth of the Asian economies, most notably India and China, has created a boost in the demand for civil aircraft. Domestically, the
commercial legacy carriers have struggled; with rampant bankruptcies across the civil aviation sector, yet strength of the low cost carriers has increased demand for large commercial aircraft. Meanwhile, demand for replacement parts and investment in new technologies are likely to continue the growth of the military segment for the foreseeable future.
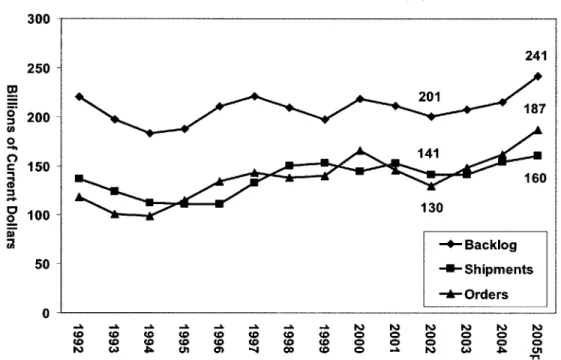
Figure 2.8 provides a graphic representation of the overall industry growth trend.
0 0 0 0 300 250 -200 150 100 -50 -0 co co 241 20-1 187 141 160 130 -4- Backlog -U-Shipments -- Orders CD CD CDCD CDCD (Il -L 0) -4 CD CD 0) CD CD CD 0) 01 0 0 00 I~~) Ili 0 0 0n
Figure 2.8: U.S. aerospace industry orders, shipments and backlog34
As 2006 begins, the upward trend of increased orders, shipments and backlog is promising. Overall, it is a good picture for the U.S. aerospace industry. Demand for product is up, but at the same time pressure is being felt for both cost and cycle reductions.
2.4 Impact of trends on aerospace sourcing
The market forces and trends identified in Section 2.3 are having a profound impact on the
sourcing functions of the leading U.S. aerospace firms. Collectively, the market forces and trends translate to increased demand and pressure for cost reduction. Growth is expected to
continue for the foreseeable future, with 8.2% growth forecasted in 2006.35 At the same time, the industry has been consolidating for years. Twenty four of the 100 largest defense companies
34 Aerospace Industries Association: 4 1" Annual Year End Review & Forecast Luncheon 35 Aerospace Industries Association: 2005 Year-End Review and 2006 Forecast
in 1990 were no longer in the industry by 1998.36 Moreover, employment in the U.S. aerospace sector is projected to decline 17.6% from 2002 to 2012.37 Between consolidation and headcount contraction - to say nothing of investor motivations - there is a lack of interest in capital
investment to acquire capacity or manufacturing capability for the forecasted growth that has already begun to be realized. The following sections provide insight into the impact the market forces and trends are having on the sourcing functions of the leading U.S. aerospace firms. 2.4.1 Outsourcing and globalization
The overall trend of growth creates a need to expand capacity. Airframers, engine system
manufacturers and major sub-system providers are not interested in the capital investment to
achieve capabilities in-house, but rather are looking to their supply base to achieve much of the gains. The trends identified in Section 2.3 all correlate to pressure on airframers and
subsequently those in the aerospace supply chain to lower the cost of the products they provide. In order to achieve this, the top three levels of the aerospace supply chain pyramid are
outsourcing more than ever in the history of the industry. For example, given the 2005 sale of its Wichita, Kansas facility, Boeing will only be manufacturing the vertical fin of the tail and
various fairings and flaps on the new 787 airframe.38
Beyond simply increasing outsourcing to limit capital investment, the firms at the top three levels of the aerospace supply chain hierarchy are also looking to lower procurement cost by using low cost internationally-based suppliers. A U.S. Department of Commerce report states it best: "U.S. companies that historically supplied parts and components exclusively to U.S. prime manufacturers face more difficulty maintaining their positions in an increasingly global
industry."39 Increased outsourcing and a focus on globalization of the supply base has added pressure to the sourcing organizations of the top three supply chain levels.
2.4.2 Risk sharing on new programs
The pressures on sourcing organizations are at their greatest during the development of new airframes, engine systems and major sub-systems. The cost of investment, combined with the probability of program failure, has led to the development of partnerships and risk sharing on new programs. In today's aerospace market place, the sourcing organizations do not develop the relationships, qualify suppliers and negotiate procurement contracts for piece parts. Instead, they are performing these functions for complete assemblies and sub-systems as prime manufacturers no longer bear the burden of design and production of new platforms.40 The prime
manufacturers have essentially become systems integrators.4' This integration has fallen under the auspices of the sourcing function in many instances, as aerospace manufacturing continues the trend of increased focus on systems integration.4 2
36 PriceWaterhouseCoopers: The Defence Industry in the
21s' Century
3 U.S. Bureau of Labor Statistics: Aerospace Products and Parts Manufacturing (NA CIS 3364).
38 Seattle Times: "Boeing names 7E7 suppliers; Goodrich the big winner" 39
U.S. Department of Commerce: The US. Jet Transport Industry 4 0
U.S. Department of Commerce: The U.S. Jet Transport Industry 41 U.S. Department of Commerce: The U.S. Jet Transport Industry 42 U.S. Department of Commerce: The U.S. Jet Transport Industry
This pressure is also evident in the military segment of the aerospace industry. Risk is being passed down the supply chain, and suppliers are being asked to invest more in new programs and
to manage a broader scope of the supply chain.43 2.4.3 Lean manufacturing
The two dominant airframers in the commercial aviation sector, Boeing and Airbus, have each recently introduced new jetliner models, the 787 and A380, respectively. Boeing has designed the 787 to allow for a final stage assembly in 3 days, whereas the 767 took as long as 30 days.44 Meanwhile, in 2006, Airbus intends to produce a single-aisle airframe in 6 months - a 50% reduction from the 2003 cycle time.45 In order to achieve these remarkable cycle reductions,
while at the same time hitting the cost targets, the leading aerospace industry firms have adopted lean manufacturing. UTC, Boeing and GE have all adopted the lean manufacturing philosophy in an effort to improve operational efficiency. These OEMs are also pushing the lean approach to their supply bases. The sourcing organizations have been charged with championing this
approach to suppliers. It is the task of the sourcing managers to incorporate the lean philosophy into procurement contract language, train the suppliers in the lean principles and measure the lean performance of their suppliers. Lean manufacturing presents at once an opportunity for improved sourcing efficiency and a challenge to get "buy-in" from the supply base on yet another initiative.
2.4.4 Supply chain disintermediation
The pressure on aerospace OEM's to lower procurement costs has resulted in a business
phenomenon known as supply chain disintermediation. Years of price reduction pressure on the supply chain has recently resulted in the suppliers circumventing the traditional industry sales channel. Traditionally, suppliers would sell replacement parts to the OEM who would in turn
sell to the end customer, most often the large commercial airlines. Instead, suppliers have begun to sell directly to their buyers' customers. Not only are sourcing organizations receiving pressure to achieve year-over-year cost reduction with an increasingly combative supply chain, they are doing so in an environment in which the very same suppliers are attacking the sacred high margin aftermarket business segment once monopolized by the OEM.
2.4.5 Raw material capacity constraints and price escalation
The growth of the aerospace industry over the past few years combined with the industrialization and development of the Chinese and Indian economies have put a severe strain on the supply chains of the metals industries. This has led to unprecedented prices for aerospace metals, such as titanium, and long lead-times for industry metals across the board. Not surprisingly, this has impacted the sourcing managers responsible for the procurement of raw materials, forgings and castings. However, this trend has also affected sourcing managers responsible for fabrications, machined parts and other components requiring aerospace metals for finished goods. Overall,
43 PriceWaterhouseCoopers: The Defence Industry in the 2 s1' Century
44 Michaels, D. & Lunsford, J.L.,: "Streamlined Plane Making; Boeing, Airbus Look to Car Companies' Methods to Speed Up Jetliner Production"
45 Michaels, D. & Lunsford, J.L.,: "Streamlined Plane Making; Boeing, Airbus Look to Car Companies' Methods to Speed Up Jetliner Production"
46 Rossetti, C. & Choi, T.Y.: "On the dark side of strategic sourcing: Experiences from the aerospace industry"
the metals markets have put significant pressure on the cost reduction and lead time reduction efforts of all aerospace sourcing managers.
2.4.6 Summary of impacts on sourcing functions
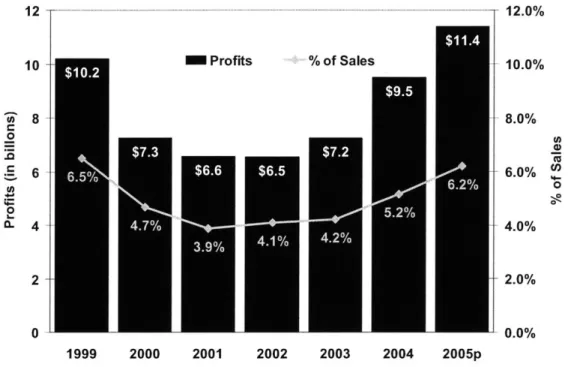
Despite the pressures that have been placed on the sourcing organizations of the U.S. aerospace industry, the sourcing function has proved an invaluable resource in making the U.S. aerospace industry more profitable over the past few years. Figure 2.9 illustrates the increased profitability of the aerospace industry - from 3.9% return-on-sales in 2001 to 6.2% return-on-sales in 2005.
12 -10 - ii-0 0 L_. CL 8 6 4 2 0 - Profits % of Sales - 12.0% 10.0% 8.0% - 6.0% 0 4.0% - 2.0% - 0.0% 1999 2000 2001 2002 2003 2004 2005p
Figure 2.9: Aerospace industry profitability47
This increase in industry profitability can in part be attributed to the impact of the sourcing organizations of the leading aerospace firms. Yet, at the same time the industry is achieving an increase in profitability, both in aggregate and as a percent of sales; the overall demand for both military and civil aircraft has caused industry insiders to comment on the unprecedented strain on the aerospace supply chain.
2.5 Inherent aerospace sourcing complexity
Beyond the trends that are the result of broader economic and market forces, there are some characteristics of the aerospace industry that make the sourcing process inherently more complex than other industries. These characteristics impose additional constraints on the total cost
analysis and the sourcing allocation decision process, and are of critical significance in the development of a framework for optimal supply chain demand allocation. These characteristics are discussed in the following sub-sections.
47 Aerospace Industries Association: 41'' Annual Year End Review & Forecast Luncheon
2.5.1 Advanced technology
In general, the complexity of aerospace products is much greater than those of other manufacturing industries. The designs, materials and processes used in the manufacture of aerospace products are most appropriately characterized as advanced technology. Suppliers must possess advanced technical design and processing knowledge in order to produce aerospace products. Suppliers in the aerospace industry are held to higher standards than those in general industry with increased quality requirements. The level of independent quality certification in the aerospace industry is above the standards of ISO9000. To accommodate the requirements of both the civil and military aviation and aerospace sectors, suppliers are held to the quality management standards of the more rigorous AS9 100.48
In addition to design and processing knowledge, suppliers must also have a highly educated workforce, both in the office and on the shop floor. According to the U.S. Bureau of Labor Statistics, the production worker in the aerospace industry must posses a "high level of skill" and be able to maintain "high quality standards in their work."49
Therefore, the numbers of suppliers currently capable of providing aerospace quality parts are much less than in general industry. In fact, according to the independent Performance Review Institute, there are only 1833 suppliers that are certified by the National Aerospace and Defence Contractors Accreditation Program (NADCAP), the worldwide cooperative responsible for validating special processing requirements of the aerospace industry such as heat treatment and materials testing.5
Additionally, most aerospace suppliers are in highly developed, high cost labor regions. Of the
1833 NADCAP certified suppliers, 1263 are located in the U.S.51 Meanwhile, there are only 89 NADCAP certified suppliers in all of Asia and 14 located in Mexico.5 Those in low-cost regions generally require up front investment. The investment may take on the form of capital
equipment or processing knowledge or perhaps technical personnel on the ground. 2.5.2 Supplier qualification requirements
The U.S. aerospace industry is highly regulated. The FAA is responsible for regulating not only commercial and non-commercial air traffic, but also aerospace equipment producers. Each flight critical or flight essential component must pass a rigorous set of tests to validate design.
Moreover, the U.S. government requires even more rigorous testing and validation of designs used in military aircraft. The testing and validation requirements of the FAA and the DOD translate to higher costs for supplier qualification. This higher cost is a function of longer lead-time requirements to qualify a new supplier and higher testing and qualification investment cost.
48 Scrimshire, D.: AS9100 - The Latest Development in Global Aerospace Quality Standards
49
U.S. Department of Commerce: The U.S. Jet Transport Industry '0 NADCAP: PRIFA Qs
51 eAuditNet: Qualified Manufacturers List
52 eAuditNet: Qualified Manufacturers List
2.5.3 Military / commercial mix
One of the inherent complexities of the sourcing function in the aerospace industry is the
management of the procurement and testing requirements of military products relative to those of commercial or civil products. As previously stated, the testing and validation requirements for product used in military aircraft exceed those of civil aircraft; however, there are additional considerations, most notably the source requirements of military parts. In general, the DOD requires all parts to be used on military aircraft be sourced from U.S. suppliers. Not without exception, this requirement extends to the component parts and materials used by the U.S. manufacturer in the production of military aircraft parts. Hence, the sub-tier supply base is required to source their materials and parts from U.S. suppliers, as well.
2.5.4 Local content offset requirements
When airframers, engine system providers and major sub-system manufacturers sell products
overseas, in many instances local content requirements or offsets are included in the sales contracts. For example, Boeing may sell ten 777 jetliners to a Brazilian based company or UTC may provide the engines for the Embraer VLJ turboprop civil aircraft. As part of the contractual agreements for both of these sales, Boeing and UTC may be required to purchase a certain percentage of the contract value from Brazilian suppliers over the course of the next several years. Although the example presented required the seller fund activity directly related to the products sold, an offset agreement may require the seller invest in activities not directly related to the product sold.53 An offset agreement may require the seller invest in development of manufacturing capability in the buyer's country, or alternatively non-manufacturing infrastructure such as a hospital or telecommunications capability.
53 Emiliani, M.L.: "Sourcing in the global aerospace supply chain using online reverse auctions" 5 Emiliani, M.L.: "Sourcing in the global aerospace supply chain using online reverse auctions"
3 UTC and the Aerospace Supply Management team
This chapter provides an overview of the organization in which the six month internship took place. This chapter begins by outlining the operations and financial performance of UTC, and goes on to provide a thorough understanding of the UTC Aerospace Supply Management team. It is important to understand the organizational structure and objectives of the Aerospace Supply Management team to appreciate the sourcing complexity and constraints, and ultimately the benefits of the research conducted.
3.1 UTC and the aerospace industry
This section provides a summary of UTC's operations, outlining the product and service
offerings of each business unit, followed by a review of the Corporation's financial performance. Section 3.1 concludes with a discussion of the growth opportunities in UTC's Aerospace
business units.
3.1.1 UTC overview
UTC is a $37.4B multinational conglomerate based in Hartford, Connecticut.55 UTC has more
than 210,000 employees and over 250 manufacturing sites around the globe.6 UTC's business
units provide high-technology products and services to the building systems and aerospace industries through its seven business units.57 The seven business units of UTC are classified into two categories: (1) Commercial and Industrial and (2) Aerospace. The business units and a brief overview of their product and service offerings are provided in Sections 3.1.2 and 3.1.3.58
3.1.2 UTC Commercial and Industrial business units Carrier59
Carrier is the world's largest producer and distributor of heating ventilation and air conditioning (HVAC) systems, refrigeration and food service equipment, and related controls for residential, commercial, industrial and transportation applications.
Additionally, Carrier provides aftermarket components and services for its own products, as well as the products of other manufacturers.
UTC Fire & Securiy60
Formerly Chubb, UTC Fire & Security was given its current namesake with the
acquisition of Kidde in April 2005. UTC Fire & Security provides products and services under the brand names Chubb and Kidde. Within the security space, the business
provides integration, installation, monitoring and service of intruder alarms, access control and video surveillance systems. It also provides alarm response and security
5 United Technologies Corporation: 2004 Annual Report
56 United Technologies Corporation: Aerospace Supply Management Marketing Presentation
57 United Technologies Corporation: 2004 Annual Report
58 United Technologies Corporation: 2004 Annual
Report
59 United Technologies Corporation: 2004 Annual Report
60 United Technologies Corporation Fire & Security: http://www.utc.com/units/security.htm
personnel services, as well as cash logistics and physical security. The fire safety offerings of UTC Fire & Security consist of various fire detection, suppression and fire
fighting products. UTC Fire & Security also provides integration, installation and service of fire detection and suppression systems along with the manufacture and service of portable fire extinguishers.
Otis61
Otis is the world's largest elevator and escalator manufacturer, installer and service provider. Otis designs, manufactures, installs, maintains and services elevators, escalators and moving walkways for a variety of commercial and residential buildings, malls and urban transportation systems. Additionally, Otis provides upgrade packages and service for products manufactured by competing firms.
UTC Power62
UTC Power provides combined heating, cooling and power systems for commercial and
industrial applications and fuel cell systems for commercial, transportation and space applications, including the U.S. space shuttle program. As of the 2004 annual report,
UTC has not reported operating revenue or income for UTC Power; therefore, UTC
Power will not be included in the business unit performance in Section 3.1.4.
3.1.3 UTC Aerospace business units
Hamilton Sundstrand6 3
Hamilton Sundstrand is a leading supplier of technologically advanced aerospace and industrial products. Aerospace products include systems for power generation,
management and distribution, along with flight, engine, fuel and environmental controls, auxiliary power units and propeller systems. Hamilton Sundstrand also has an extensive line of industrial products to complement their aerospace product lines. The industrial products of Hamilton Sundstrand include air compressors, metering devices, fluid handling equipment and gear drives.
Pratt & Whitney64
Pratt & Whitney is one of the world's largest providers of commercial, general aviation and military aircraft engines. Additionally, Pratt & Whitney offers spare parts and aftermarket and fleet management services for those engines it provides, as well as those of other engine manufactures. Moreover, Pratt & Whitney provides power generation and space propulsion systems.
Sikorsky 5
61 United Technologies Corporation: 2004 Annual Report 62 United Technologies Corporation: 2004 Annual Report 63 United Technologies Corporation: 2004 Annual Report
" United Technologies Corporation: 2004 Annual Report
65 United Technologies Corporation: 2004 Annual Report
Sikorsky is among the world's largest manufacturers of helicopters for both commercial and military applications. Sikorsky also provides aftermarket helicopter and aircraft products and services.
3.1.4 UTC financial and operational performance
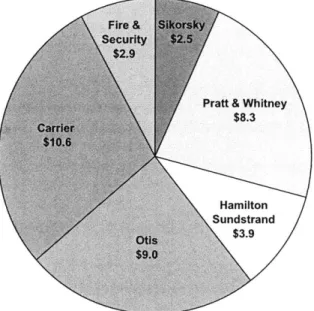
A breakdown of 2004 revenue across the seven UTC business units is provided in Figure 3.1.
Fire & Skrk Security
$2.9
Pratt & Whitney
$8.3 $1066 Hamilton Sundstrand Otis $3.9 $9.0
Figure 3.1: 2004 UTC revenue ($B) by business unit66
66 United Technologies Corporation: 2004 Annual Report
A breakdown of 2004 UTC revenue by business type is provided in Figure 3.2.
Figure 3.2: 2004 UTC revenue by business type6 7
A breakdown of 2004 UTC revenue by geographic region is provided in Figure 3.3.
. Rest of World 12% U.S. 41% Europe 28%
Figure 3.3: 2004 UTC revenue by geographic region61
67 United Technologies Corporation: 2004 Annual Report 68 United Technologies Corporation: 2004 Annual Report
A breakdown of 2004 UTC revenue by product type is provided in Figure 3.4.
Aftermarket
- E 42%
Figure 3.4: 2004 UTC revenue by business type69
Figures 3.1, 3.2, 3.3 and 3.4 reveal a balanced portfolio of businesses, products, and revenue streams. Although diversified, nearly 40% of revenue comes from the aerospace segment. As such, the aerospace industry trends identified in Chapter 2 are of particular interest to UTC. In fact, many of the growth trends identified in Chapter 2 will have a profound impact on the future
operating performance of the UTC Aerospace business units. 3.1.5 UTC Aerospace business growth
Hamilton Sundstrand was awarded a contract to provide eight of the major sub-systems on Boeing's new 787 airframe - an anticipated $8B revenue stream over the life of the contract.70 Meanwhile, Pratt & Whitney is one of the leaders in the development and production of the
F-135 Joint Strike Fighter jet engine, a program with the potential for as many as 4,500 fighter-jets over the life of the program. Moreover, Sikorsky, the manufacturer of the Blackhawk
helicopter, is expected to more than double revenue over a 6 year period from 2004 to 2010 with minimal increase in production facility square footage.72 At the same time, the commercial arm of Pratt & Whitney located in Quebec, Canada has become a major force in the civil turboprop market.7 3 Pratt & Whitney Canada, as it is known, have captured the dominant position in the turboprop engine systems market segment as the lead provider of engines on the new Cessna Mustang, Eclipse E500 and Embraer VLJ and LJ product lines.
69 United Technologies Corporation: 2004 Annual Report
70 Hamilton Sundstrand: "Hamilton Sundstrand Achieves Major Milestone in Dreamliner Development Program;
Completes First Engine Test of the Boeing 787 Auxiliary Power Unit"
71 United Technologies Corporation: Aerospace Supply Management Marketing Presentation 72 Defence Systems Daily: "Sikorsky on Track for Sustained Growth"
73 Franus, D.J.: "Engines Climb Back"
3.2 UTC sourcing operations
UTC is relying on their sourcing organizations and their supply base to successfully execute the
business growth identified in Section 3.1.5. The demand growth outlined in Section 3.1.5 has placed significant strain on all of the sourcing functions of the UTC Aerospace business units. This demand growth has put pressure on the sourcing organization of each of the Aerospace business units to not only ensure on-time fulfillment, but to also continue to lower the cost of direct material procurement. Without effective utilization of the existing supply base, as well as identification of new suppliers, the financial benefits of the programs identified will not be realized.
3.3 Aerospace Supply Management team
The Aerospace Supply Management (ASM) team is a strategic sourcing organization formed by the UTC Aerospace business units in the late 1990's. The ASM team is charged with lowering the total cost of procurement, leading global sourcing activities and enabling the supplier development effort. The following sub-sections define the ASM team, its charter and organization structure.
3.3.1 ASM overview
The ASM team was developed to aggregate the direct material purchases of the Aerospace divisions of UTC and act as "one-UTC" to the supply base. A high level of product synergy exists across the aerospace divisions of UTC. In fact, many of the component parts are
manufactured using the same processes. Prior to the formation of the ASM team, the Aerospace business units in many cases were using the same suppliers, but were not utilizing the leverage provided by the other Aerospace business units in contract negotiations.
The ASM team coordinates the strategic sourcing activities of the three Aerospace business units
- Pratt & Whitney, Hamilton Sundstrand and Sikorsky. The Aerospace business unit sourcing teams are responsible for the division-specific parts that do not have processing synergies with the other Aerospace business, as well as the more tactical aspects of sourcing. These tactical elements include purchase order placement and shop-floor fulfillment. Meanwhile, the ASM team is focused on strategy development and execution, and long-term supply chain contract development.
3.3.2 ASM organizational structure
The ASM team leadership reports directly to the Executive Director of Supply Management (Sourcing) who has responsibility for both strategic indirect and direct sourcing across the Corporation. In turn, the Executive Director of Supply Management reports to the UTC Vice President of Operations. The peers of the Executive Director of Supply Management are the Vice Presidents of Supply Management at each of the Corporations' business units. The Vice Presidents of Supply Management of each business unit report directly their respective Vice Presidents of Operations who also report to the UTC Vice President of Operations. Figure 3.6 provides a top-level organization chart of the ASM team leadership reporting structure.
UTC CEO UTC VP Operations
Sikorsky Pratt & Whitney Ham. Sund. VP Operations VP Operations VP Operations
Sikorsky Pratt & Whitney Ham. Sund.
VP Supply Mgnt. VP Supply Mgnt. VP Supply Mgnt.
Otis Fire & Security Carrier VP Operations VP Operations VP Operations
Otis Fire & Security Carrier VP Supply MgntI VP Supply Mgnt VP Supply Mgnt.
Executive Director
UTC Supply Management
Aerospace Supply Management Team
Figure 3.6: Top-level ASM reporting structure
Although the reporting structure in Figure 3.6 seems to indicate that the ASM team reports up through to the UTC Vice President of Operations, in reality, the customers of the ASM team are the Aerospace business unit Vice Presidents of Supply Management. In fact, the Supply
Management organizations of the Aerospace business units fund the operating budget of the ASM team.
Internally, the ASM team is organized into three sub-teams: (1) Regional Management, (2) Supplier Development and (3) Commodity Management. Figure 3.7 provides a detailed organization chart of the ASM team.
MIT Thesis - Jason R. Kary
I