HAL Id: hal-00910891
https://hal.archives-ouvertes.fr/hal-00910891
Submitted on 28 Nov 2013
HAL is a multi-disciplinary open access
archive for the deposit and dissemination of
sci-entific research documents, whether they are
pub-lished or not. The documents may come from
teaching and research institutions in France or
abroad, or from public or private research centers.
L’archive ouverte pluridisciplinaire HAL, est
destinée au dépôt et à la diffusion de documents
scientifiques de niveau recherche, publiés ou non,
émanant des établissements d’enseignement et de
recherche français ou étrangers, des laboratoires
publics ou privés.
Respiration signal as a promising diagnostic tool for late
onset sepsis in premature newborns.
Xavier Navarro, Fabienne Porée, Alain Beuchée, Guy Carrault
To cite this version:
Xavier Navarro, Fabienne Porée, Alain Beuchée, Guy Carrault. Respiration signal as a promising
diagnostic tool for late onset sepsis in premature newborns.. Computing in Cardiology, Sep 2010,
Belfast, Ireland. pp.947 - 950. �hal-00910891�
Respiration Signal as a Promising Diagnostic Tool for Late Onset Sepsis in
Premature Newborns
X Navarro
1,2, F Por´ee
1,2, A Beuch´ee
1,2,3, G Carrault
1,2 1LTSI, Universit´e de Rennes 1, Rennes, France
2
INSERM U642, Rennes, France
3
Pˆole M´edico-Chirurgical de P´ediatrie et de G´en´etique Clinique, CHU Rennes, France
Abstract
The purpose of this study was to find out differences be-tween septicemic and healthy premature newborns from the respiratory signal. An statistical analysis of breathing trace’s temporal features showed significant differences between the inspiration/expiration ratio, being its aver-age value shorter in healthy patients. All patient’s total respiratory cycle time exceeding the apnea threshold were classified, and two different distributions had been found: log-normal for non septicemic and GEV (Generalized Ex-treme Value) distribution for septicemic. Finally, assessing fractal signal properties, we found an increased Hurst ex-ponent (H) in non infected population. Results suggest that respiratory parameters could be helpful in sepsis diagnosis together with heart rate variability (HRV), demonstrated a relevant marker by our research team.
1.
Introduction
Late-onset sepsis is defined as a systemic infection after the third day of life in neonates and, whatever the source of infection, there are nonspecific clinical manifestations. It occurs in approximately 10% of all newborns, increas-ing to more than 25% when the infants are born with a very low weight and have to be hospitalized in the NICU (Neonatal Intensive Care Units) [1]. Late-onset sepsis is thus a major problem associated with high morbidity and mortality.
Currently, only blood culture can determine whether there is infection, because preterm neonates do not show fever and other evident signs. This practice is not only invasive, but also poorly predictable in early phases of infection [2]. Nevertheless, it has been experimentally observed that septic premature infants have more frequent and severe episodes of bradycardia and apnea than the non septic ones [3]. The need to find alternative fast noninvasive mark-ers to diagnose late-onset sepsis led to some works in our research team to assess the ECG and respiratory signals,
with results confirming the association between the occur-rence of disease and a reduction of information carried by cardiovascular signals [4]. Specifically, parameters such as sample entropy (SampEn) and regularity in HRV have shown significance in several studies [5], [6].
The aim of the present work is to find additional biomedi-cal indicators to help the late-onset diagnosis by analyzing the respiratory signal with time-domain and fractal tech-niques. They are described in the next section, as well as the study protocol and database; in section 3 we present significant parameters and statistical distributions of ap-nea, while the last section concludes and discusses the per-spectives of the assessment.
2.
Materials and methods
2.1.
Database and study protocol
The tests were performed on a cohort study of 26 prema-ture infants (post-menstrual age<33 weeks and chrono-logical age<72 hours), hospitalized in the neonatal inten-sive care unit at the university Hospital of Rennes (France) over two periods: June 2003 to June 2004 and January to July 2007. 13 of them were septicemic (group Sepsis) and 13 non septicemic (group No-sepsis). Sepsis is defined as the combination of an inflammatory response and positive blood cultures.
The inclusion criteria were: Unusual and recurrent brady-cardia (more than one per hour) and/or need for bag-and-mask resuscitation and/or cases where the physician sus-pected an infection. The exclusion criteria were: on-going inflammatory response with or without infection, medication known to influence autonomic nervous sys-tem including morphine, catecholamine, sedative drugs and Doxapram, tracheal respiratory support, intra-cerebral lesion or malformation. The study was approved by the local ethics committee (03/05-445).
The monitoring (Powerlab system , ADInstruments, Ox-R
sampling rate of two electrocardiogram (ECG), elec-trooculogram and electroencephalogram leads, one pulse oximetry saturation (SaO2), nasal flow and abdominal trace from strain gauges sampled at 4Hz. The need of the two breathing traces was to distinguish between Obstruc-tive Apnea and Central Apnea. In this work only abdomi-nal trace (thus, central apnea) will be taken in account.
2.2.
Breathing temporal features
We have chosen to deal with breathing temporal features rather than processing the respiratory trace. In fact, it is a wave-like signal from where temporal parameters can be obtained: ti (inspiration time), as the measure between
a maximum and its consecutive minimum; te(expiration
time) from a minimum and its consecutive maximum, and ttot, (total respiratory cycle time) as the measure between
two minima.
To proceed with parameter extraction, we have firstly fil-tered and resampled the respiratory signal to 40Hz. Af-terwards, we use a criterion to define the valid respiratory cycles to avoid the influence of extreme amplitudes such as deep breaths, cries and body movements: we divide the time-series by the inter-quartile range of all maxima, and then, we select cycles which maxima exceed a threshold established in 0.3.
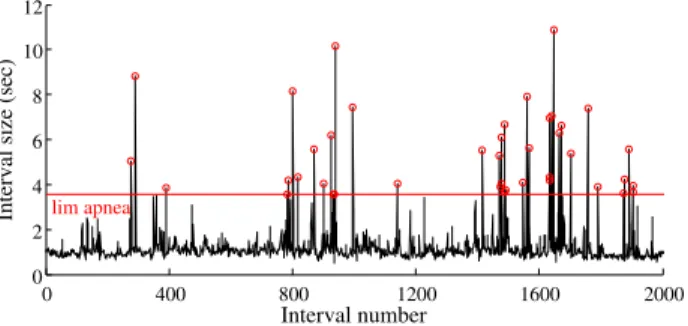
Similarly to the HRV, the respiratory variability signal or inter-breath interval (IBI) represents ttot as a function of
the breathing cycle (Figure 1)
0 400 800 1200 1600 2000 0 2 4 6 8 10 12 Interval number
Interval size (sec) lim apnea
Figure 1. Respiration variability signal with apnea thresh-old drawn in red. Each inter-breath interval over the threshold (red circles) corresponds to an apnea episode.
In order to detect apneas from the IBI signal, another threshold to this purpose has been defined. Since we are concerned with moderate to severe apnea, the chosen cri-terion is to find breathing cessations exceeding three times the average of ttot in the analyzed time-series. Once all
apnea episodes are identified, we proceed to classify them in two groups, those from infected and healthy infants.
Frequency 0 5 10 20 30 0 5 10 15 20 25 30 0 5 10 20 30 0 5 10 15 20 25 30
Figure 2. Histograms classifying all episodes of apnea by their duration (in seconds). Left: Group Sepsis ; right: Group No-sepsis
2.3.
Statistical analysis
To assess the distribution law followed by the dura-tion of apnea in Sepsis and No-sepsis, we have assumed some models based in the histogram observation (see fig-ure 2). Apnea’s positive and left skewed distribution ap-points Log-normal (Lgn) and Generalized Extreme Value (GEV) as good candidates. Lgn probability density func-tion (pdf) is: f (x) = e −(lnx−µl) 2 2σ2 l xσl √ 2π x ≥ 0; σ > 0
whereµlandσlare the mean and standard deviation of the
logarithm [9]. GEV is a three parameter distribution which has the following pdf:
f (x) = α1e−(1−κ)ye−e−y
wherey = (x − β)/α if κ = 0 and y = −κ−1log[1 −
κ(x − β)/α] for any other value of κ [10]. The param-eters α, β and κ are called scale, location and shape, re-spectively. The first parameter is analogous to the standard deviation, the second is analogous to the mean, while the third governs the shape of the tail of the distribution.
By means of the MLE (Maximum Likelihood Estima-tion) method we estimate the parameters in each distribu-tion law and finally we test the validity of the hypotheses measuring the goodness of fit using the Anderson Darling (AD) and Kolmogorov-Smirnov (KS) tests.
Wilcoxon and Mann-Whitney nonparametric rank-based tests were used in order to assess the statistical significance when comparing values ofti,te,ttotandti/teparameters
between infected/not infected infants. Significant differ-ences were taken into account when p<0.05.
All analysis were performed with R statistics language version 2.9.2 under Linux environment (GNU Public Li-cense).
2.4.
Fractal analysis
We used the Hurst exponent estimation method to study the fractal properties of the inter-breath time series. Fractal (scale-invariant or self-similarity) behavior is present in many biological processes [7] like HRV and IBI. The Hurst exponent quantifies the fractal dynamics with the analysis of the time-series on different scales. The rescaled range (R/S) characterizes the divergence of the time-series and is the base of the calculation of H. Being R the sum of the deviations of data from the mean and S the sample standard deviation, it is expressed asR/S = kTH
where k is a constant depending on the time-series and H is the Hurst exponent. This exponential law reflects the long-term dependence (or persistence) in a process. H is dimensionless and its values go from 0 to 1. For exam-ple, brownian noise is a self-affine fractal with a Hurst ex-ponent H=0.5; white noise may be considered as having H=0, and an exactly self-similar process would be char-acterized by H=1. More generally, H<0.5 indicates that future events tend to an inverse behavior (anti-persistence) and H>0.5 proves the tendency for an event to correlate positively with subsequent events (persistence) [8]. Calculations had been performed in Matlab by an unbi-R
ased estimator of the Hurst exponent in each patient’s IBI.
3.
Results
3.1.
Respiratory parameters
The statistical analysis of respiratory parameters showed differences in the inspiration to expiration ratio,ti/te. The
mean in infected infants (0.917), is greater than in non in-fected ones (0.814) with statistically significant differences (p=0.002) according to Mann-Whitney U test. The same p-value is obtained when comparing the standard deviation of infected (0.541) with healthy (0.313). The other de-scriptive statistics (see table 1) and respiratory parameters related totiandtewere not significantly different between
the two populations.
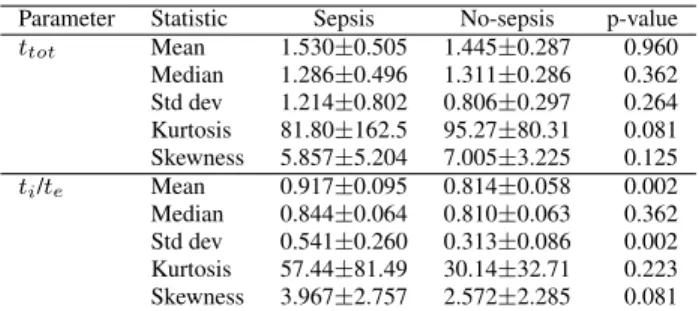
Table 1. Mean± standard deviation of descriptive statis-tics.ttotis measured in seconds.ti/teis dimensionless.
Parameter Statistic Sepsis No-sepsis p-value ttot Mean 1.530±0.505 1.445±0.287 0.960 Median 1.286±0.496 1.311±0.286 0.362 Std dev 1.214±0.802 0.806±0.297 0.264 Kurtosis 81.80±162.5 95.27±80.31 0.081 Skewness 5.857±5.204 7.005±3.225 0.125 ti/te Mean 0.917±0.095 0.814±0.058 0.002 Median 0.844±0.064 0.810±0.063 0.362 Std dev 0.541±0.260 0.313±0.086 0.002 Kurtosis 57.44±81.49 30.14±32.71 0.223 Skewness 3.967±2.757 2.572±2.285 0.081
Differences betweenti/tein the breathing trace can be
interpreted in physiological terms. This variable, which value is always under the unity, illustrates that expiration is slightly longer than inspiration. This is generalized pattern in all patients, but more noticeable for the infected ones.
3.2.
Apnea distribution
We found distribution law parameters in both popula-tions (see table 2). From the GEV a positive shape parame-ter (κ) is found, thus the specific extreme value distribution is type III or Frechet.
Table 2. MLE estimated parameters for each distribution in groups Sepsis and No-sepsis
GEV param estimates Log-normal param estimates
α β κ µ σ
Sepsis 3.220 6.553 0.317 2.099 0.550 No-sepsis 1.645 5.497 0.260 1.868 0.361
Regarding the p-values from the AD and KS tests, re-sults under the significance level would reject the null hy-pothesis (i.e. empirical samples and the theoretical values come from the same distribution), hence the highest prob-ability is the closest model to the real data. This is why, as reported in table 3 log-normal distributions describe ap-neas with more accuracy in infected population (p=0.490 in AD and p=0.370 in KS test) and Frechet distribution does in healthy patients (p=0.625 and 0.879 respectively).
Table 3. Results of goodness of fit by the Anderson Dar-ling and Kolmogorov-Smirnov test
AD p-value KS p-value
GEV Log-norm GEV Log-norm Better fit Sepsis 0.430 0.490 0.353 0.370 Log-normal No-sepsis 0.625 0.300 0.879 0.299 GEV
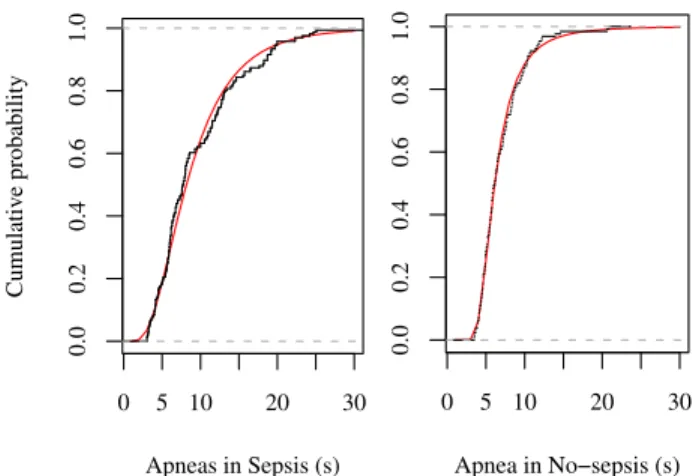
It can be observed that fitting results in Sepsis are very close, (GEV with p=0.430 and 0.353 versus p=0.490 and 0.370 in log-normal) , on the contrary, No-sepsis is clearly characterized by a GEV distribution law with more sepa-rated p-values. To have a more visual idea of the good-ness of fit, in figure 3 the empirical cumulative distribution function (ecdf) and the corresponding theoretical function (cdf) are represented.
3.3.
Fractal dynamics
The Hurst exponent revealed differences in the complex-ity between the groups Sepsis and No-sepsis. The Mann-Whitney U test found significant differences in the respi-ratory variability signal of the two groups with a p-value
0 5 10 20 30 0.0 0.2 0.4 0.6 0.8 1.0 Apneas in Sepsis (s) Cumulativ e probability 0 5 10 20 30 0.0 0.2 0.4 0.6 0.8 1.0 Apnea in No−sepsis (s)
Figure 3. cdf plots of empirical data (in black) and the best fitted distribution (red). Left: Log-normal for Sepsis ; right: GEV for No-Sepsis.
of 0.0292. The average value of H in Sepsis (0.616) is slightly lower than H in healthy babies (0.686), so a more complex and unpredictable breathing pattern is observed for infected patients (See figure 4).
Sepsis No−sepsis 0.5 0.6 0.7 0.8 Hurst exponent (H) ● ●
Figure 4. Boxplots of H in infected/healthy populations. Red symbols are: mean (circle) and standard deviation (+).
4.
Discussion and conclusions
Several parameters related to respiration in premature newborns have been analyzed in this paper. The complete respiratory cycle (ttot) itself does not reveal differences
be-tween infected and not infected groups. However, the ratio ti/teis lower in infected patients.
Distributions concerning the duration of apneas in the two groups constitute as well a subject of interest. Septicemic are prone to have more frequent and severe (longer) ap-neas; this is why their distribution is rather right skewed with a longer tail. After fitting distributions with differ-ent models, we proved that log-normal distribution char-acterizes better infected babies, and that GEV (Frechet)
distribution does better with healthy. Despite this is a case control study, we believe that it could be useful to estimate probability laws a priory in order to classify and predict in-dividually the presence of infection in a prospector study. Moreover, IBI fractal behavior provides more information to this purpose. It has been proven that estimated fractality by the Hurst exponent is lower in infected infants, hence, a less predictable breathing pattern seems to characterize this population in relationship with the healthy one. The results shown here are in accordance with previous studies performed by our team about HRV [4] and cardio-respiratory relationships [5], [6] in premature newborns, where differences between septicemic and healthy patients had been described. These observations bring additional inputs into our current research project, the construction of multivariate indexes for early detection of sepsis.
References
[1] Raymond J, Aujard Y, European Study Group. Nosocomial infec-tions in pediatric patients: A european, multicenter prospective study. Infect Control Hosp Epidemiol 2000;21:260–263. [2] Malik A, Hui CP, Pennie RA, Kirpalani H. Beyond the complete
blood cell count and c-reactive protein: A systematic review of modern diagnostic tests for neonatal sepsis. Arch Pediatr Adolesc Med 2003;157:511–516
[3] Cao H, Lake DE, Griffin MP, Moorman JR. Increased nonstation-arity of neonatal heart rate before the clinical diagnosis of sepsis. Ann Biomed Eng 2004;32:233–244
[4] Beuch´ee A, Carrault G, Bansard JY, Boutaric E, B´etr´emieux P, Pla-dys P. Uncorrelated Randomness of the Heart Rate Is Associated with Sepsis in Sick Premature Infants. Neonatology 2009;96:109– 114
[5] Carrault G, Beuche A, Pladys P, Senhadji L, Hernndez AI. Time frequency Relationships between Heart Rate and Respiration: a Diagnosis Tool for Late Onset Sepsis in Sick Premature Infants. Proceedings of IEEE Computers in Cardiology (CinC’09); 2009. p. 369-72
[6] Loforte R, Carrault G, Mainardi L, Beuche A. Heart rate and respi-ration relationships as a diagnostic tool for late onset sepsis in sick preterm infants. Computers in Cardiology 2006; 33;737-40 [7] Havlin S, Buldyerev SV, Goldberger AL, Stanley HE. Fractals in
Biology and Medicine. Chaos, Solitons and Fractals 1995;6:171– 201.
[8] Bassingthwaighte JB, Raymond GM. Evaluating rescaled ranged analysis for time series. Ann Biomed Eng. 1994;22:432-44 [9] Limert E, Werner AS, Abbt M. Log-normal Distributions across
the Sciences: Keys ans Clues. BioScience. 2001;51:341–352. [10] Prescott P, Walden AT. Maximum likelihood estimation of the
pa-rameters of the generalized extreme-value distribution. Biometrika. 1980;67(3):7234
Address for correspondence: Xavier Navarro
LTSI – INSERM U642 Campus de Bealieu. Bˆat 22 Universit´e de Rennes 1
35042 Cedex - Rennes - FRANCE javier.navarro@univ-rennes1.fr