THE COST OF
NOISE REDUCTION FOR
POWERED-LIFT
STOL AIRCRAFT
by Wesley E Moore
FTL Report R73-3
February 1973
Flight Transportation Laboratory
THE COST OF NOISE REDUCTION FOR POWERED-LIFT S.T.O.L. AIRCRAFT
by
Wesley F. Moore
Report FTL R73 -3 February 1973
The direct operating costs and noise impacts of a wide variety of Externally Blown Flap and Augmentor Wing STOL short haul transport aircraft designs were evaluated to study the costs of noise reduction for these types of aircraft.
The "two-stream" Augmentor Wing designs were found to be capable of the greatest noise reductions, and to have the lowest direct operating costs at all levels of noise impact. Sideline noise levels of 81 PNdB at 500 feet were attainable for an 80 seat aircraft with an 8 to 15 percent increase in direct operat-ing cost over an aircraft designed with no constraints on noise.
ACKNOWLEDGEMENTS
The work described in this report was supported by the Transportation Systems Center of the Department of Transporta-tion under Contract DOT-TSC-93.
The author would also like to thank Prof. Robert W. Simpson, for his patience in supervising these efforts; Mr. Henry Faulkner, for his many suggestions and for his time spent reading many drafts; Ms. Elisabeth Metzner, for her assistance and support; and the rest of the staff of the Flight Transportation Laboratory, for their frequent help.
I. Introduction
II. Powered Lift STOL Aircraft Design
III. Evaluation of Aircraft IV. Results and Discussion V. Conclusions
References
Appendix: A Program for the Design and Evaluation of Powered Lift STOL Aircraft
I. INTRODUCTION
During the past several years, the design of aircraft able to operate in the very restrictive environments of city centers has occupied the attention of the manufacturers,airlineq and agencies that make up the world's aviation community. These V/STOL (for Vertical and/or Short Takeoff and Landing) aircraft would be able to use landing fields less than 2000 feet in
length, fly steep takeoff and landing flight paths, and be
maneuverable enough to avoid the numerous obstructions encountered in an urban environment.
During the past few years, however, the problem of "noise pollution" has become the urban citizens' most frequent contact with air transportation. It now appears that no aircraft will be able to operate from small fields (with the closeness to other urban acitivities that the small size implies) without meeting very restrictive noise standards which have yet to be
promulgated.
It is possible for the designer to make these aircraft very quiet, just as it is possible to make aircraft fly at the low
speeds necessary to operate from small fields. There is a cost for noise reduction, however, just as there is a cost for V/STOL performance.
the Externally Blown Flap, and the Augmentor Wing. These "powered-lift" concepts enable flight at low speeds with high wing loadings, but tend to result in noisy aircraft (compared to
conventional aircraft).
In order to make these powered-lift aircraft quiet enough to meet or exceed proposed noise standards for V/STOL aircraft, it is necessary to sacrifice economy for quietness, through the use of wing sizes and engine parameters that are non-optimum
from the direct operating cost outlook.
Through the use of a computer program that synthesized aircraft designs, and evaluated their operating costs and noise
"footprints", it was possible to study a large number of designs using both concepts. For each level of noise generation, a
design of minimum operating cost was found, resulting in a pattern of cost-versus-noise for both STOL concepts.
II. POWERED LIFT STOL AIRCRAFT DESIGN
A. POWERED LIFT FLIGHT CONCEPTS
The two types of STOL aircraft discussed in this report rely on the "jet flap" principle for fight at low speeds. In a jet flap, the momentum of a jet of air flowing from the trailing edge of an aerofoil increases its effective lift, both by the direct thrust of the vertical component of momentum, and by enhancing the circulatory flow about the aerofoil. Suitable
secondary jets or slots can further enhance the circulation by sucking or blowing on the boundary layers, thus keeping the
flow attached and well behaved. Figure la shows the essentials of the concept.
The Externally Blown Flap (EBF) concept creates the jet flap at the trailing edge by immersing large double-or triple-slotted flaps in the exhaust flow of high bypass turbofan engines
(see Figure lb). This arrangement looks like a typical under-wing arrangement for conventional aircraft; in those, however, cut-outs are provided so that the flaps do not deflect the
thrust. Furthermore, the EBF engines are as close to the wing undersurface, and grouped close together as practical. This concept has the advantage of simplicity, but suffers from
at 60 degree flap deflection, only 65% of the gross engine thrust is effectively deflected (see References 1, 2, 3).
When high lift is not required, as when the aircraft is in cruising flight, the flaps are raised out of the engine exhaust stream, and the aircraft flies like a conventional airplane.
The Augmentor Wing (AW) concept is more complicated, but more efficient (see Figure lg,d). A pair of trailing edge flaps form an "ejector" slot for a slot nozzle. This nozzle is supplied with high pressure air from the aircraft power-plants through
ducts in the wings. This arrangement derives its efficiency from the efficient turning of the nozzle flow and the thrust augmentation of the ejector slot (see References 2, 4, 5).
Augmentor wing systems may be further divided into sub-types. The first is the so-called "two stream" system where the only
engine exhaust which does not pass through the duct and flap system is that of the gas generator, or "core". When the thrust of the system is increased beyond that necessary for lift
generation, the excess thrust must still be used by the flap system; the angle of the flap, however may be reduced for the same lift. See Figure lc.
The other system is the "three-stream" type, where a second bypass duct exhausts to the rear along with the core. When
(a) The "Jet Flap"
(b) The Externally Blown Flap
(c) The Two-Stream Augmentor Wing
(d) The Three-Stream Augmentor Wing
FIGURE 1. Powered Lift Concepts. ,,1
by this "third stream"; thus the duct and nozzle system need not be enlarged. See Figure ld.
In both types, the wing nozzle flow is diverted to "cruise nozzles" when the flaps are retracted and the aircraft is flying as a conventional airplane.
B. POWERED LIFT FLIGHT MECHANICS
In order to estimate the performance of powered lift air-craft in the takeoff and landing configurations, it is necessary to use flight mechanics which account for the deflection of power-plant thrust and the dependence of lift upon thrust.
In general, the most convenient way to handling these flight mechanics is through the use of dimensionless parameters, as in Reference 6. In conventional flight, for example, there is the coefficient of lift
C =Lif tA/pv2 (2.1)
In powered lift flight, the C is dependent upon the angle of attack (oc) and flap deflections (6 ), but also upon the coefficient of thrust
2
The gross thrust of the nozzle is used in this calculation. For the use of the computer program of section ILF, the dependence of CL on CT ,OC, and
6
was taken from wind tunnel data (see References 1 and 4) and reduced to form empiricalfunctions for CL (as a function of CT and
S
),QC(as a function maxof C , C , and
6
),
required C (as a function of the required C,
and the 8),
and required 8 (as a function of the requiredmax
CL
,
and the C),
for both the EBF and AW types. maxThe dependence of CL upon C introduces some unusual features to powered lift flight. The CL available increases
monotonic-max
ally with C T and so, conversely, decreases with decreasing C T for a constant 9. Thus, as the speed of flight increases, a constant power-plant gross thrust results in a decreasing C
T (through the increase of the denominator in Equation 2.2 above) and therefore, a decreasing CL'
The peculiar result of this is the decoupling of speed and load-factor margins. While a conventional airplane can'Pull" a normal load factor of up to 1.44 g's before stalling when flying at a speed 1.2 times stalling speed, the powered-lift airplane at 1.2 times stalling speed without changing thrust will find
itself able to "pull" a normal load factor only a little greater than 1.0, the exact value depending on other variables. This
should be born in mind in the discussion of the operational requirements in section II.C.
The calculation of excess specific thrust (thrust available for climb and/or acceleration) becomes a very involved process. For a conventional aircraft, the horizontal net force coefficient is simply the net thrust minus the total drag:
X T D
net
(2.3)
where the total drag coefficient is simply the sum of the profile and parasitic drag plus the induced drag plus the drag of deflected flaps (if any):
2
C =C + C /eT + C
D D o L DDfla (2.4)
where C L=coefficient of lift, e="Oswald" efficiency factor, and AR =aspect ratio.
For the powered lift aircraft, however, two factors require different analyses. First, part of the lift is from the deflected
thrust, so that the induced drag is reduced:
C = (CL -C Tsine) /eMn
D.1
where
e
is the total thrust deflection (fc + ) and is thedeflection efficiency. Secondly, the thrust is deflected, so that the net thrust is no longer the net thrust of the power-plants. Instead, the net thrust becomes
C = C cos e - C (V /V ) (2.6)
Tnet T 0 ex
where V =exhaust velocity and V 0=flight speed.
For the externally blown flap aircraft, the complete equa-tion becomes, in terms of coefficients (see Figure 2a)
C = C }cose -C -C -C -C -C (V /V ) (2.7) X T . D D. D T o ex 1 o trim flap
where
=j(f
)=1-.00583'
C Dtrim= (C ) = .0025c D./L LCD flap=
()
.f8* f (for the assumptions used in the Appendix)For the augmentor wind aircraft, the coefficient of thrust is related to the isentropic (ideal) thrust of the wing nozzles (mainly for the convenience of wind tunnel experimentors); thus, if the static augmentation ratio (the ratio of the augmentor wing thrust to the nozzle thrust) is , and the efficiency of
Aero Lift Trim Drag Induced Drag 'rim Momentum -- Parasitic Drag Weig1{ Gross Deflected Thrust (a) EBF Aero
Lift
Trim Drag Momentum Undeflected Thrust Weight{ \4 rim -4'arasiti -- Flap Drag Gross Augmented Thrust (b) AW£2 2 22 2 =t0u(h + V/V )
V n o ex
relative to the ideal thrust of the nozzle.
The momentum drag of the augmentor inlet is then
C = (06 -1) (V /V )C D ~ o o ex T
Thus the horizontal force coefficient becomes
C = C dcose + C cosoc - C - C - C (2.10)
TqVe 2 D o trim
-C D -4 C - T (V /V o ex ) -C T (V /V )
0 e flape
where C is the engine coefficient of thrust,which is not e
deflected by the flap. See Figure 2b.
C. COMMERCIAL STOL DESIGN REQUIREMENTS
Both the FAA in this country and the ARB in the United Kingdom have issued provisional airworthiness requirements for "Powered Lift" aircraft (see References 7 and 8). The require-ments and field length definitions set forth, however, are not yet adequate to define fully the performance required of aircraft
operating into urban or suburban "STOLports".
These STOLports may be characterized by extremely restricted space - both in terms of field lengths and air maneuvering space. In reference 9, R. K. Ransone has set forth operational require-ments for 2000 foot STOL fields which go far beyond either of the airworthiness standards. We have generally adopted these
requirements.
Those operational requirements established in Reference 9 which directly affect those parameters used by the design
analysis program (see section II.F) are as follows (see Figure 3): a) For takeoff, that the distance required to clear a 35
foot obstacle be not more than 1900 feet, assuming one power-plant failed at a decision speed, V1, such that
the aborted takeoff (accelerate-stop) distance be not more than 1650 feet (given a two second delay at V1
for pilot-power-plant response).
b) The gradient of climb with one power-plant failed must be no less than 7.7% at the second segment climb speed, V2, which is taken to equal the lift-off speed in the
analysis program.
c) For landing, the distance available for rollout from touchdown to a complete stop is 1050 feet. Passenger comfort requirements limit the normal operational
Threshold
LANDING
--Brake Releas
Distance for Continued Takeoff
Distance for Aborted Takeoff
100' 1900'
TAKEOFF
-STOL Field Allowances. FIGURE 3.
landing deceleration to .33 g's (well below that avail-able for emergency deceleration), giving a normal touch-down speed of 76 knots (130 feet/sec), assuming a two
second delay for pilot-airfiame-power-plant response. d) If a (conservative) assumption is made that there is no
deceleration in the flare maneuver, then the approach speed is also 76 knots (89 mph). The flare maneuver, with one power-plant failed, must require a horizontal
distance (measured from the glide slope aim point) of not more than 300 feet (while including the adverse effects of "ground-effect").
e) At this approach speed, on a 7.5 degree glide-slope, the aircraft must be able to clear the STOL field
surface after breaking out of a 100 foot ceiling (given a two second delay for pilot-airframe-power-plant
response), with one power-plant failed. This requires a normal (perpendicular to the flight path) acceleration of .3 g's; i.e., a load factor capability of 1.3, with one power-plant failed.
Due to the peculiarities of powered-lift flight pointed out in the previous section, this requirement is the critical one for sizing the thrust acting on the flaps. The takeoff requirements (a) and (b)
generally size the total thrust requirement.
f) Furthermore (in an extension of the requirements of Reference 9), after leveling off, and accelerating over a horizontal distance of 1000 feet, the aircraft must be able to climb at a gradient of 6.7%.
g) Consistent with the procedures of Reference 6 the com-binations of speed, flap settings and available thrust must be such that the flight speed is at least 1.2 times
the one power-plant failed stall speed for the configur-ation; in addition, the flight attitude must be (approxi-mately) 5 degrees below the stall angle of attack.
It should be noted that the above requirements do not include any factors on landing or takeoff distances. In conventional
operations (e.g., operations under F.A.R. Part 25), distance fac-tors are used to allow for variations in pilot skill and techni-que, aircraft-power-plant performance, etc. Instead of distance
factors, the STOLports of Reference 9 are equipped with arresting devices capable of stopping an aircraft at landing speed with no damage to the aircraft or injury to its occupants. Their use, which would be alarming to the average passenger, is restricted
to unusual and severe emergency incidents, such as multiple
engine failure. Single engine failure incidents should be handled without recourse to these devices.
The normal landing deceleration, as mentioned before, is limited by passenger comfort to .33 g's. The deceleration in an abort situation is limited by brake and thrust reverser
effectiveness.
In the takeoff calculations performed by the computer pro-gram,a coefficient of friction of .40 was assumed for the maximum braking case (abort). Reference 8 gives this as lower limit for the coefficient on wet grooved runways at high speed. As the coefficient increases with decreasing speed, the assumed constant is very conservative, especially since the effects of aerodynamic drag are completely ignored in the abort calculations.
The runway coefficient of friction on takeoff (with no brakes) is assumed to be .025.
Similarly, the thrust reverser effectiveness is assumed to be 40%; i.e., the maximum reverse thrust is 40% of the maximum forward thrust. This is optimistic, except for variable pitch fan engines; however, the inlet drag of the moving engine is ignored. Since this reverse thrust is to be used in the abort case with one engine failed, the full reverse thrust is assumed to operate on only two out of the four engines to avoid
asymetrical forces.
Although Reference 9 requires that the aircraft should be able to land at the approach rate of descent (implying a
aircraft-carrier-type no-flare touchdown), this seems too conservative in terms of landing gear requirements, and too liberal in terms of passenger comfort. Therefore, the landing gear is sized so that
it can withstand loads 1.66 times that of conventional transport aircraft.
The computer routines which compte landing and takeoff performance compute the flap angles required for all flight
conditions, as set by stall margins, etc. The maximum setting for the EBF aircraft is 60 degrees, and the maximum for the augmentor wing is 70 degrees.
In accordance with the practices of Reference 6, during the takeoff roll, the flap angle is assumed to be zero, to allow all of the thrust to accelerate the aircraft. This means that the flaps must be reasonably fast acting, with deflection rates of about 15 degrees/sec.
The effects of the ground plane on the landing flare maneuver are taken from Reference 10. All designs are assumed to be high wing configurations.
The requirements for STOL operation given in this section must be met at a hot day temperatureof 300 C, 150 C above the
standard day ground temperture. Cruise calculations, however, are made at standard day conditions.
D. POWER PLANT PERFORMANCE
The chief parameters which characterize each aircratdesign are those of the power plants. The selection of power-plant type has profound effects on the gross weight, cost, and noise of each design.
The most basic pramter that characterizes each power-plant is the velocity of the exhaust. The EBF power-plants are assumed to have only one exhaust velocity (the average of the bypass and core exhaust velocities), while the AW engines have two (one for the flap nozzle, and one for the engine nozzle(s)).
The thrust-to-weight ratios and static specific fuel consump-tions are shown in Figure 4 for the exhaust velocities used in this report. These values assume an advanced gas generator
(engine "core") with compressor ratios of about 28 and turbine inlet temperatures of 2800 0R, as will be available in the next generation of civil engines, available in the late 70's (see Reference 11).
E. OTHER DESIGN ASSUMPTIONS
No arbitrary lower limit was set on wing-loading, as is sometimes thought necessary for ride comfort considerations. References 12 and 13 have demonstrated the feasibility
.50 Specific Fuel -' Consumptiop--. 40 lb ,- per lbf per 6 -30 hr. Thrust-to-Weight ,' Ratio lbf .20 per lb-4 .10 400 600 800 1000 1200 1400
Exhaust Velocity, Ft/Sec
of ride smoothing by the aircraft control surfaces and fast acting flaps. Thus, wing loadings as low as 60 lb/ft2 were investigated.
There is no allowance made in the design program for asymetry in engine-out situations. The AW aircraft have
cross ducts in the wings to neutralize part of the effects, but the EBF aircraft must rely completely on differential flap and aileron control to counteract the resulting rolling moments.
With this in mind, there is an allowance in the design process of both types for the weight of equipment to "blow" all of the control surfaces.
No limit is placed on the ground angle on takeoff or landing, but the stall margin requirements coincidentally limit this to about 15 degrees.
All of the aircraft in this study have similar wing geometry. The rather low aspect ratio of 6.5 was assumed, as it was required for the AW aircraft (due to duct volume requirements), and EBF aircraft were not sensitive to aspect ratio changes, due to the low wing loadings of interest, and the short range of the aircraft.
The thickness-chord ratio (measured perpendicular to the wing structural axis) was 17% and a supercritical wing profile was assumed. The taper ratio was constant at 0.5.
resulted in a critical Mach number for the wing greater than the 0 0
design cruise speed (0 -20 ). For the EBF aircraft, the sweep angle was 250, which is required to spread the power-plant exhaust over a larger area of flap.
Cruise speed was not an input to the design process, the cruise speed being that which resulted from the thrust-loading necessary to meet the STOL requirement. An upper limit of Mach .8 was imposed, however, to prevent excessive fuel consumption by
those designs which were capable of very high speeds.
As most of the designs were limited in cruise speed, the operating cruise altitude was set at 25,000 feet, the optimum altitude for maximum speed for most designs.
The design range for all of the designs was 500 statute miles. STOL aircraft will be used for short-haul operations,
implying a average stage length of less than 300 miles. Such a low design range reduces the flexibility of the aircraft for
ferrying and semi-conventional operations, but the sizes of these designs are sensitive to the required range, so it is of great advantage to keep the range as short as practical.
A passenger weight factor (the assumed average weight of one passenger and his baggage) was 200 pounds for these designs. This is a bit generous for short-haul "commuter" type operations, but no allowance was made for cargo or mail carriage.
The weight of a standard airline interior was allowed for, although no galleys were assumed, and only a very small weight allowance was made for inflight services.
Most of the aircraft in this report carried 80 passengers. This size was chosen for two reasons. First, the initial sizes of all the short-range jets (the DC-9-10, the BAC-lll, the F-28, and the Caravelle) were all in that size range. Second, the
success of a short-haul transportation system in competition with other modes depends very strongly on frequency of service. For high frequency, it is necessary to have small aircraft.
Two other sizes were studied less broadly, however, to investigate the effects on cost and noise of other sizes;
50 seat and 110 seat aircraft were chosen, mainly for compati-bility with another FTL study of the cost of noise reduction in short haul helicopters, Reference 14.
The fuselage dimensions chosen for the three sizes were as follows:For the 50 seat aircraft,the seating arrangement was four abreast, resulting in a fuselage diameter of 9.5 feet and a length was 68 feet. For the 80 seat aircraft, the seating was also four
abreast, and the length was 85 feet. For the 110 seat aircraft, the seating was six abreast with two aisles, resulting in a fuselage diameter of 14 feet, and a length of 92 feet.
the 50 and 80 seat aircraft) or three (for the 110 seat aircrat) cabin attendants.
The reserves carried by the aircraft are sufficient to fly at the cruise speed for best milage (at the design cruise alti-tude) for one-half hour, plus that required to abandon a missed approach and fly to an alternate airfield 110 statute miles away.
These reserves are only half of those carried in conventional airline operations, but should be adequate considering the short-haul nature of the operations, and the ease with which STOL
air-craft could operate into conventional airports in the worst of weather.
F. THE AIRCRAFT DESIGN COMPUTER PROGRAM
As mentioned in previous sections, the actual synthesis and evaluation of aircraft designs was done by a computer program. This program enabled a large number of designs to be studied.
The program is described in detail in the Appendix. Its general design features are described here, and the evaluation features in Chapter III.
The design process used in the program is that of the pre-liminary design engineer: without detailed analysis of the design, find the required weight of each component, and solve for the
The inputs to the program include the required payload and range, the wing aerodynamic and structural geometry, the basic engine parameters, the required reserves, the required takeoff and landing performance, and the desired wing loading.
The first step is to solve for the necessary engine size (in terms of the thrust-to-weight ratio) to satisfy the takeoff and landing requirements. A rough estimate of the zero-lift drag coefficient (CD ) of the aircraft is made, and all of the other
0
necessary coefficients are found from the known wing and engine parameters. An initial value for the thrust-to-weight ratio is
found from the missed approach pull-up requirement. The missed approach maneuver is tested to see if the gradient of climb at
its completion is adequate. If it is not, the thrust-to-weight ratio is increased in steps of .01 until the requirement is met. The same process is repeated for the other requirements.
The resulting thrust-to-weight ratio now defines the engine size in terms of the unknown gross weight. Starting with an
estimate of the gross weight, the routine uses the fuselage, wing and engine parameters to find a better estimate of the aircraft zero-lift drag coefficient. Conventional aerodynamics are then used to calculate the climb, cruise, and descent performance of
the aircraft, in order to find the fuel weight required for completion of the design mission with the proper reserves.
The program then uses formulae taken from regression analy-sis studies to find the weights of the various components of the airframe. Thes3 formulae (taken from Reference 15) are consist-ent with convconsist-entional all-metal design and construction techniques of the late sixties. Due to the uncertainty of the availability and costs of composite construction in the time frame under
consideration (the late seventies), only conventional techniques could be considered.
The power-plant weights were taken from the previously found thrust-to-weight ratios and the specific weights shown in Figure 4.
The airframe, engine, fuel, payload, and other miscellaneous weights are then summed to find a total weight. This is compared
to the old estimate of gross weight that was used in all of the computdions. If these two weights agree to within ten pounds, the design is considered solved, and the design features are output in detail.
If the two weights do not agree, a new gross weight is solved for by the "weight fraction" method. In this method, the weight of each component whose size depends on the gross weight (wings, engines, fuel, etc.) is assumed to be a fixed fraction of the gross weight. All other weights are assumed to be fixed. A new gross weight is found by setting the fraction of the gross weight
remaining for the fixed weights equal to the total weight of these fixed weights.
This new estimate is used to repeat the process, starting with the detailed estimate of C , until successive iterations
0
III. EVALUATION OF AIRCRAFT
Two figures of merit were chosen to compare the results of the design activities. One was a cost measure; the direct oper-ating cost at 500 miles. The other was a noise measure; the footprint area within the 85 PNdB contour for a takeoff and landing.
A. DIRECT OPERATING COST
The results of the design process of section II.F are used to estimate the direct operating cost (DOC) of the design. A set of stage lengths (along with a cruise altitude and speed for each one) is input, and the aircraft drag and thrust performance used to calculate the block time and block fuel consumption for each one.
Next, a set of cost parameters is input and used to esti-mate the value of the aircraft. The power-plants for both types of aircraft were priced at $25 per pound of thrust. The airframe
(empty weight minus engine weight) was priced at $70 per pound for the EBF aircraft, and $80 per pound for the AW aircraft
(this is to reflect the added complexity of the duct and flap equipment). Assumed utilization is 3000 hours per year, with a useful life of twelve years.
-28-These values are put directly into the ATA (1967) Standard Method for DOCs (Reference 16), and used, along with the block data, to compute the direct operating costs (in 1967 dollars) for each stage length.
B. NOISE EVALUATION
It has been shown (Reference 17) that for uniform popula-tion density, the noise footprint area is proporpopula-tional to a mea-sure for total community annoyance. Therefore, the footprint area within the 85 PNdB contour has been selected as a measure of the noise impact of these aircraft.
The value of 85 PNdB was chosen for two reasons. First, it was neither so high a value that the approximations involved in
the contour calculations would break down, nor so low that the contour areas would be strongly dependent on the flight profile followed on takeoff or landing. Second, it approximates the exterior noise level which most people will tolerate repeatedly when they are inside of any reasonable building (see Reference
18). This contour can be assumed to encompass all of the land that will be effected by noise from a STOLport operation. This area must be either utilized by the STOLport, owned by the STOL-port operators, zoned for activities not influenced by aircraft noise, or covered by easements from landowners. The cost and
difficulty of STOLport location will be proportional to the value of this figure of merit.
In order to compute the 85 PNdB contours used as the noise figure of merit, it is of course necessary to know something of
the noise generation of powered-lift STOL aircraft.
There are three sources of noise from powered-lift aircraft operating in takeoff or landing configurations: the noise gener-ated by the fan, compressor and turbines ("fan" noise); the noise generated by the exhaust ("jet" noise); and the noise generated by the operation of the powered-lift system ("flap" noise).
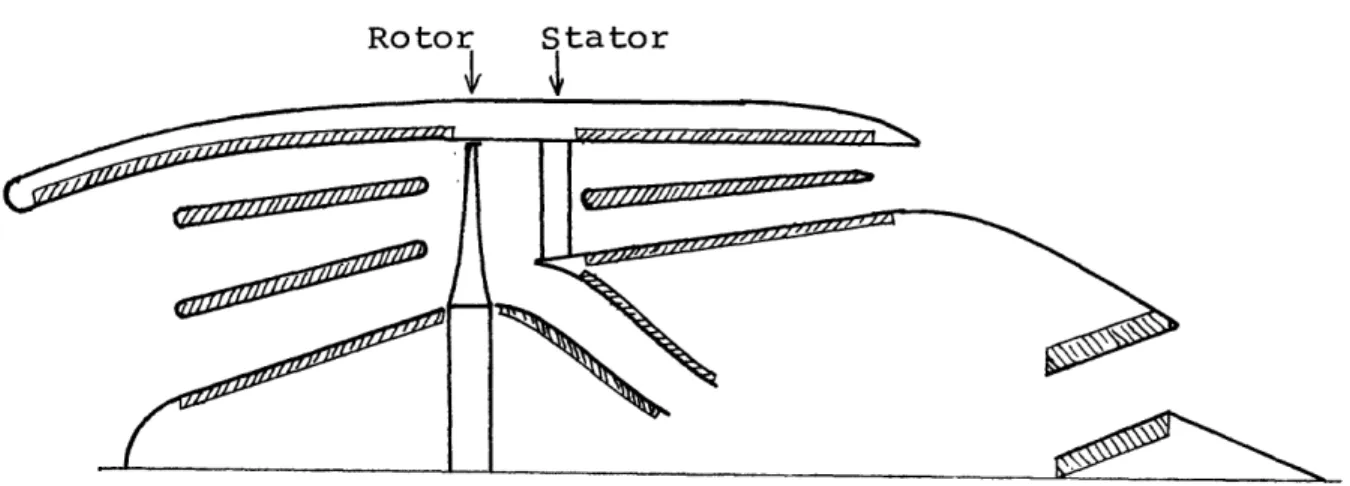
Fan noise is generated by the fluctating pressures on rotor and stator blades as the machinery rotates. This noise is emit-ted out of the inlet and exhaust nozzle of the engine. The level depends on both the basic parameters and the detailed design of the engine.
Fan noise may be reduced by three means. the first is to select the details of design, such as fan rotor tip speed and rotor-stator spacing, to minimize the noise, with only a small performance penalty. The second is to choose the basic para-meters of the power-plant for lower noise levels; this has very profound effects on the design of both the engine and the air-plane that carries it. The third method is to absorb the noise which is generated before it leaves the engine nacelle.
Tiere are two ways of absorbing fan noise (see Figures 5a and 5b). The simplest is to line the inlet and ducts with porous materials which damp out the sound waves which impinge upon them.
The second method is called "sonic choking", which involves con-stricting the inlet, forcing the velocity of the entering air to approach the speed of sound. The sound waves propagating out
through the inlet are slowed as they pass through the sonic zone, and are absorbed by the flow nauniformities associated with the
sonic flow (the mechanism of absorption is not completely under-stood). This method only works for noise propagating out of the inlet, so it is useful only for the two-stream type of Augmentor Wing aircraft, where all of the bypass flow goes into ducts
leading to the flap nozzles. The fan noise propagating down these ducts can be easily absorbed with no performance penalty. The sonic inlet has performance penalties only while it is in use; during cruise, or in an engine-out emergency, the inlet can be unconstricted, allowing the engine to develop full thrust.
Three fan noise levels were used for each engine type (from References 11 and 19) as shown in Figure 6. The loudest is for a moderate amount of suppression - absorptive lining of the in-let and exhaust duct walls, with no engine performance penalties, but with a 20% nacelle weight penalty. The middle curve is for the maximum amount of asorptive suppression, with linings on the
Noise Absorbing Materials
(a) Suppression By Acoustic Linings
Duct to Flaps Roto Stator
(b) Suppression By Inlet Choking (On an Augmentor Wing Engine)
Single-Stage Fans Two-Stage Fans Perceived Noise Level at10 500 ft. in Loudest Direction, PNdB 90 15000 lbs. static Thrust 80 Moderate Lining 1, .ximum Lining Inleti I n l t C h o k i n 70- -400 600 800 1000
Exhaust Velocity, Ft/Sec
FIGURE 6. Reference Fan Noise Levels
walls and on splitter rings inserted in the inlet and ducts. This can involve substantial performance losses, and adds 60% to the weight and 10% to the drag on the engine nacelles. The quietest curve is that for sonic choking. It involves severe performance losses when in operation, and also adds 60% to the weight and 10% to the drag of the nacelles.
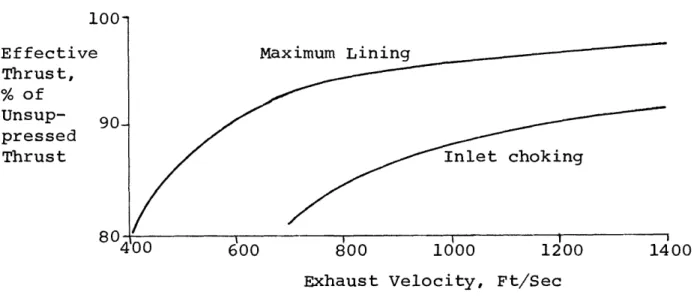
The performance penalties of the maximum lining suppression and sonic choking (from References 11 and 20) are shown in Figure 7. As the suppression devices cause constant pressure losses, the penalties increase with decreasing fan pressure ratio. (The pen-alties for the sonic choking are probably too severe in the light of results published after the studies in this report were com-pleted.)
Jet noise is caused by the turbulent mixing of the exhaust flow with the ambient air. This mixing is completely external to the engine, and cannot be absorbed. Reducing the exhaust veloci-ty by choice of engine parameters is the most effective way to reduce the noise, as slight reductions in the exhaust velocity can havemarked effects of the noise generation. This, of course, has basic effects on the engine and aircraft design.
The only other way to reduce the noise is to use a "mixer" nozzle (see Figure 8), which improves the mixing of the exhaust, reducing the noise levels. This sort of suppression has little
Effective Thrust, % of Unsup-pressed Thrust 80 Maximum Lining
Exhaust Velocity, Ft/Sec
FIGURE 7. Fan Suppression Penalties.
FIGURE 8. Mixer Nozzle
effect on the noise levels of engines with low exhaust veloci-ties, as are used for the aircraft studied in this report. The jet noise levels for the velocities of interest (from References 11 and 21) are shown in Figure 9.
Flap noise must be discussed for the two types of aircraft separately, for they have completely different mechanisms of generation.
In the EBF system, the exhaust of the engines blows directly on the flaps. The turbulence caused by the exhaust mixing "scrubs" across the flaps, causing pressure fluctuations, which, in the presence of a solid boundary, become efficient noise sources. The nois e of the exhaust blowing on the flap is louder than the noise of the exhaust by itself.
As with jet noise, the external nature of the noise does not allow the use of absorbing devices. Similarly, reductions in the blowing velocity allow marked reductions in the noise level. The use of a mixer nozzle on the engine, which results in lower peak velocities on the flap (reducing the intensity of the turbulence) can help reduce the noise of the flap scrubbing slightly. The noise levels for EBF flaps (from References 2,3, and 21) are shown in Figure 10. The upper curve is for plain nozzles, and the lower is for mixer nozzles. It can be seen that the differ-ence is slight.
110 Perceived Noise Level at 500 ft. 100 Loudest Direction, PNdB 90-15000 lbs. static Thrust 80-400 600 800 1000 1200
Exhaust Velocity, Ft/Sec
FIGURE 9. Static Reference Jet Noise Levels
110 Perceived Noise Level at 500 ft. 100 in Loudest Direction, PNdB 90 15000 lbs. static Thrust 80 Unmixed Mixed 0 600 800 1000 1200
Exhaust Velocity, Ft/Sec
FIGURE 10. Reference EBF Flap Noise Levels
110-Perceived Noise Level at 500 ft. in 100~ Loudest Direction, PNdB 90-15000 lbs. static Thrust Ou 400 Moderate Suppression, Plain Slot Maximum Suppression, Multi-Element Nozzles 600 800 1000 1200 1400
Exhaust Velocity, Ft/Sec
FIGURE 11. Reference AW Flap Noise Levels
The nozzle of an AW system exhausts between two flaps with-out impinging directly upon them. Thus, the noise source for a properly design system is a jet mixing noise identical to that described earlier.
The fact that this jet is in the form of a slot instead of a circular orifice increases the mixing efficiency of the system, resulting in a lower noise level relative to an ordinary jet of the same velocity and thrust. The advantage is further enhanced by the ejector slot, which constricts the flow around the jet, raising its speed, and lowering the relative mixing velocity, re-sulting in a still lower noise level.
The noise level can be lowered even further by two techniques. The first is the changing of the narrow slot into an array of mul-tiple slots, further increasing the mixing efficiency, and
lower-ing the noise level in a way -identical to the mixer nozzle on a circular jet. The second is to line the areas on the inner faces of the ejector flaps with absorptive material, which absorb the noise internally.
The noise of an AW system is also amenable to reduction by lowering the nozzle exhaust velocity. However, since the air for the nozzles must be carried by ducts inside the wing, and lower exhaust velocities require higher mass flows for the same thrust, a lower limit is placed on the nozzle velocity by the
cross sectional area of the wing profile.
Under certain conditions the noise of an AW system may be increased by such mechanisms as supersonic nozzle "screech" and flap "scrubbing". With proper design, however, these problems can be avoided.
Noise levas for the AW systems (from References 2,5,11 and 21) are shown in Figure 11. The upper curve is for plain slot nozzles with a moderate amount of suppression material applied to the interior surfaces of the flaps. The lower curve is for the maximum amount of suppression, with mixer nozzles, etc. The increased mixing efficiency of the maximum suppression flaps
results in increased thrust augmentation, so there is no perform-ance penalty. As with mixer nozzles for circular jets, the sup-pression is less effective for lower nozzle velocities.
The noise levels shown in Figures 6,9,10, and 11 were used as reference noise levels for the power-plants used in the noise-contour process. After the design process has found the required
thrust levels, the noise levels are scaled up or down to ac-count for the difference between the reference 15000 lb-thrust engines and the actual design engines.
The noise levels of the fan and jetsary with flight condition and thrust level in ways which are easily approximated. The noise levels of the flap systems are considered to remain constant with
-40-flight condition, changing only with thrust level and flap set-ting (see References 5 and 22).
Each of the noise sources has its own directivity pattern; i.e., the noise sources are not isotropic, but put out different noise levels in different directions. The program uses empirical curves adapted from data taken from References 2,3,11,19, and 21.
The thrust and drag performance is used to calculate take-off and landing trajectories for each design, with time histories of thrust,aircraft angle,and noise generation.
When the takeoff path is computed for the noise evaluation, the aircraft climbs at maximum power. No "noise-abatement" power reductions are used, as they are ineffective for the power-plants under study, and would require awkward changes in flaps, etc. On landing, the aircraft follows a 7.50 glide slope down to the
threshold.
These paths and time histories are then used, along with the directivity assumptions, to compute time histories of perceived noise level at each point on a ground level grid below and along side of the flight path (see Figure 12a).
The noise level from the aircraft drops off with distance, not only due to the spherical attenuation (the "inverse square" law), but also due to the absorption of sound energy by the
x(t),h(t)
R (x,y,t)
Ground "Listening Points" y Center Line
PNL(x ,y,t)
FIGURE 12a. Noise Evaluation Computations (Takeoff)
71. 9. 3 . 70. 77. A9?. 73. P3. 84. 73. 79. 14. 74. 76. 76. 71. 75. '7 EPNL 4. 92. 90. 95. 90. 84. 85 PNdB Contour '5. 74. 73. 0. 7. 79. 72. ). '3. 72. 71. 0. '5. 74. 70. 0. 68* 0. 66. 0. 71. 71. 70. 6, 69. 69. 69. 69. 6P. 68. 6q. 67. 65. 0. 47. 70. 7?. 73. 73. 73. 73. 73. 72. 71. 70. 67. 64. 0. 0. 0. 0. 0. 0. 0. 0. 0. 0. 0. 0. 0. 0. 0. 1000'
humidity, and the wave-length of the sound. In this report, the conservative assumption of a dry standard day was used. The attenuations were 3 dB per 1000 feet for the fan noise (due to its high frequency content), 1 dB for the jet, and 1.5 for the flaps.
The time histories of perceived noise are then used to find a Maximum Perceived Noise Level, and an Effective Perceived Noise Level for each ground point, by the methods of Reference 23. The results aim output in a grid format (see Figure 12b), from which the contours of PNL and EPNL can be estimated.
IV. RESULTS AND DISCUSSION
The use of a computer program to design and evaluate the dif-ferent types of aircraft allowed a large number of difdif-ferent wing
loadings and engine types to be investigated for the Externally Blown Flap, the two-stream Augmentor Wing, and the three-stream Augmentor Wing types of STOL transports.
A. PRELIMINARY RESULTS
Some preliminary results covered wing loadings from 60 lb/ft2 2
to 100 lb/ft2. A clear pattern of cost and noise emerged for all types. As shown in Figure 13, both cost and noise were reduced by reduction of the wing loading. For the AW types, this trend
2
was reduced or reversed below 80 lb/ft The trend continued down to below 60 lb/ft2 with the EBF types.
The final results for the AW types, therefore, covered only 2
70 and 80 lb/ft2. The final results for the EBF types covered 60, 70, and 80 lb/ft 2. It was considered outside the scope of this work to examine wing loadings below 60 lb/ft 2, as powered lift becomes unnecessary at lower loadings.
The results shown in Figure 13 are at variance with the results in Reference 6. That study found that the optimum EBF aircraft (AW types were not studied) had a wing loading of about
1.0-. 9-Normalized Cost .8~ Cost costWL=100 .7-AW Design Family 80 C
EBF Design Family
80
70 60
.'8
Normalized Footprint Area, Area/AreaWL-lOO
FIGURE 13. Typical Cost and Noise Trends With Wing Loading. WL=100 90 60 90 1.0
80 lb/ft 2, using military design rules (with no noise constraints). The rules use in the present study'resulted in decreasing costs
for aircraft with decreasing wing loadings, down to, and presum-2
ably beyond, 60 lb/ft2. The use of sophisticated high-lift de-vices permits non-powered-lift STOL operations (in accordance with the rules of section II.C) with wing loadings as high as
2
55 lb/ft The conclusion must therefore be made that low
wing loading STOL aircraft would be both cheaper and less noisy (having no flap-blowing noise) than EBF aircraft. This assumes, of course, that passenger comfort can be maintained at low wing loadings by means of ride-smoothing devices.
B. FINAL RESULTS
The final results for the three different types of aircraft are shown in Figures 14,15, and 16. The horizontal scale on each plot is the area of the 85 PNdB contour for a takeoff and landing operation in acres (note that the scale is logarithmic). The vertical scale is the seat-trip cost at 500 miles in 1967 dollars
(note that the scale is not logarithmic).
The lines labelled "95" in each plot are an attempt to com-pare the noise figures to the single noise rating number that is most often seen - "95 PNdB at 500 feet". If an isotropic source which gives a noise level of 95 PNdB at 500 feet starts at the
$1413 -Direct 12 Seat Trip Cost At 500 Miles 10 $9 80-Seat EBFs C3 U WL=80 /\ A WL=70
a
0 WL=60open Symbols: Moderate Suppression
closed Sytnbols: Maximum Suppression Number by Each Group Refers to
Exhaust Velocity.
1000
85 PNdB Contour Area, Acres
FIGURE 14. Cost and Noise of EBF STOL Designs (80 Seats).
800
800
915
Direct Seat Trip
Cost
At 500 Miles
80-Seat 2-Stream AWs
S 500 700
1300
1100 100 [' E WL=80 0 0 WL=70 A WL=50Open Symbols: Moderate
Suppression Closed Symbols: Maximum
Suppression
Number By Each Group
Refers to Exhaust Velocity
1300
7001 010
95
1000 10000
85 PNdB Contour Area, Acres
$147 13 -Direct 12 -Seat Trip Cost At 500 Miles 11 = 10' $9 *
80-Seat 3-Stream AWs 00-400
1300
Numbers By Each Group Refer
to Exhaust Velocity: First to Flap Nozzle, Second to Bypass
'
N
WL=800 0WL=70
Open Symbols: Moderate
Suppression
Closed Symbols: Maximum Suppression
600
900-600 700-600 1100-600900-800
Sj-1
00-800
r1300-800
"3rd Stream". 10
I. I I1
boo
10085 PNdB Contour Area, Acres
brake release point and climbs away on a 10% gradient, and lands on a 7.5 glide slope putting out half as much noise (92 PNdB), the mythical airplane will have a 85 PNdB contour area of 900 acres. The relation between real designs and this baseline
is affected not only by the relative noise levels at 500 feet, but also the actual flight path, and the actual noise directivity
(the actual desigis are very non-isotropic).
The curves fitted to each plot are hyperbolic; that is, they are of the form
C = C0 + d/(A-A ) (4.1)
where C is the cost, and A is the footprint area. A hyperbolic form implies that the cost increases as the area diminishes. Furthermore, there is a lower asymptote on cost, C0 (no matter how noisy the aircraft, it can cost no less), and an asymptote on area, A (no matter how expensive the aircraft, it can be no quieter). The factor d governs the curvature of the trend curve as it goes from one asymptote to the other.
Thus, the results show, as expected, that quieter aircraft are more expensive aircraft. There are four basic reasons for this.
engines or nacelles has performance and weight penalties as dis-cussed in section III.B.
Second, the noise of any design is strongly dependent on its basic engine cycle. As the engine exhaust velocity is re-duced, resulting in lower noise levels,the required aircraft thrust-to-weight ratio increases. Figure 17 shows a plot of re-quired thrust-to-weight ratios versus exhaust velocity for
the two-stream AW designs. Figure 18 shows a similar plot of EBF designs. As can be seen, the lower the exhaust velocities, the higher the thrust-to-weight ratio becomes. This is mainly due to the effect of the inlet momentum drag terms in the ex= pressions for net horizontal force, as given in section II.B. The lower the exhaust velocity, the higher the momentum drag as a fraction of gross thrust at landing or takeoff speed. This is an important penalty of low exhaust velocity power-plants used for deflected thrust which has not received adequate emphasis.
Third, as the exhaust velocity of the engines is lowered, the net thrust drops off more quickly with speed (this is the phenomenon of the previous paragraph in another guise). When the installed thrust levels are set by landing and takeoff re-quirements, this results in a slower cruise speed, as the de-crease in thrust at high speed more than offsets the inde-crease in thrust referred to above. Slower cruise speeds result in
.5-Aircraft T/W Ratio .4-400 WL=80 WL=7 0 660 800
1000
1200Flap Nozzle Exhaust Velocity, Ft/Sec
FIGURE 17. Required Thrust-to-Weight Ratios, Two-Stream AW Designs. .8-Aircraft Ratio 400 WL=70 WL=60 600
860
Exhaust Velocity, Ft/Sec
FIGURE 18. Required Thrust-to-Weight Ratios, EBF Designs.
__T
1400
1000 1200 1400
.7-longer block times and higher flight crew, maintenance, depreci-ation, and insurance costs.
Fourth, below a certain exhaust velocity, the thrust-to-weight ratios of the power-plants become worse (see Figure 4),
resulting in heavier, more expensive aircraft.
C. TWO-STREAM AUGMENTOR WING DESIGNS
As can be seen, the two-stream AW types do the best in terms of both cost and noise. The EBF types lose out; in noise, be-cause of the difficulty of making quiet flaps, and in cost due to the high thrust-to-weight ratios of the aircraft. The three-stream AW types lose out too; the suppression of fan noise by absorptive linings is not as effective as sonic choking, the sonic inlets enjoy the advantage of an "on-off" capability, and the high momentum drag penalties mean high thrust-to-weight ratios.
Up to a point, the curve of cost versus noise for the two-stream AW designs is surprisingly flat. The aircraft labelled "Q" (for "quiet") is only 8% more expensive than the aircraft labelled "C" (for "cheap"). This result is surprising in view of the fact that the cheap aircraft is still at least 30% more expensive than a conventional (non-STOL) aircraft of the same capacity.
There are some points that must be borne in mind when compar-ing the cheap aircraft and the quiet aircraft. Due to the low
wing loading and low exhaust velocity of the quiet design, the cruise speed is only 445 mph (385 knots); this compares with the cheap designs's cruise speed of 515 mph (450 knots). From the point of view of the ATA Standard Method, this results in a block time penalty of 9 minutes at 500 miles (9.5%). The ATA Method assumes a ground time of fifteen minutes in its block time calculations. STOL operators could hope for better than that, but even if no ground time at all is assumed, the nine minute difference still means only 11%.
Airlines in the "jet age" tend to be prejudiced against slow airplanes, although passengers will apparently accept any-thing without propellors. The quiet design is still faster than the Lockheed 188 Electra, which was turning in short-haul block times comparable to McDonnell-Douglas DC-9s as recently as 1972. It would appear that the airlines could be sold on a slow-but-quiet airplane, if they can indeed be sold on STOL.
Another point is the wing design of the quiet airplane. Its low exhaust velocity flap nozzles require high mass flows, which in turn require large ducts. In order to fit these ducts inside of the wings, they must occupy part of the volume in front of the rear spar, which of course requires that they pass through
-55-this spar in order to reach the nozzles. Structural designers are quite loath to allow anything to penetrate the webs of the wing spars, due to the adverse effects this has on torsional stiffness. (For example, the tradeoff studies in Reference 5 assume that all of the ducts must fit in the space available behind the rear spar; this severely restricts the usable range of flap nozzle pressure ratios.) Thus, although a 25% weight penalty for the wing was assumed, some uncertainty in size and cost must remain. If the penalty were increased to 50%, the gross weight of the aircraft would increase 5%, and the cost by 4%.
Lastly, external fuel tanks are necessary as much of the wing volume is taken up by ducts. Certain airliners have used similar tanks, so their acceptance should pose no problem.
All in all, there are enough uncertainties to influence the cost of the quiet airplane by around 7%; thus the penalty for using the quiet aircraft instead of the cheap aircraft will range from 8 to 15%.
Figure 19 shows the approximate appearance of a quiet design. Figure 20 shows the cheap design for comparison. They look quite similar, due to their identical wing loading.
Wing Loading: 80 lb/ft 2
Gross Weight: 70,000 lbs. Cruise Speed: 445 mph
Sideline Noise: 81 PNdB @ 500 ft.
Flyover Noise: 85 PNdB @ 500 ft.
FIGURE 19. Quiet 80-Seat Augmentor Wing Aircraft.
D. "SILENT" AUGMENTOR WING DESIGNS
Aircraft "S" (for "silent") in Figure 15 was designed after examination of the results shown in the rest of the figure. It is an attempt to meet the stiffest noise requirements which are ever likely to be promulgated for STOL aircraft using 2000 foot strips.
An aircraft landing on the STOL runway of Figure 3 will be at an altitude of 100 feet when it is 500 feet from the end of the primary surface. Aircraft passing overhead at altitudes less than 100 feet will probably influence land use and value, no matter what the noise levels involved. One could guess, then, that if the 85 PNdB contour does not extend more than 500 feet beyond the ends of the runway, then the noise of the aircraft will have no effect on the STOLport cost.
On takeoff, this requires noise levels of 80 to 83 PNdB at 500 feet (flyover) if steep climbouts can be used, resulting in altitudes of 300-400 feet over the 500 foot point. On landing, the 100 foot altitude requires a noise level of 71 PNdB at 500 feet. The corresponding sideline noise levels result in the 85 PNdB contour being only 200 feet from the runway centerline. This will obviously require a very quiet airplane.
It is difficult to estimate the noise levels of very low exhaust velocity augmentor wing systems, as this requires
ex-FIGURE 20. Cheap 80-Seat
Augmentor Wing Aircraft. Wing Loading: 80 lb/ft 2 Gross Weight 69,000 lbs. Cruise Speed: 515 mph Sideline Noise: 102 PNdB @ 500 ft. Flyover Noise: 104 PNdB @ 500 ft. FIGURE 21. "Silent" 80-Seat Augmentor Wing Aircraft. Wing Loading: 50 lb/ft 2 Gross Weight: 86,000 lbs. Cruise Speed: 425 mph Sideline Noise: 75 PNdB @ 500 ft. Flyover Noise: 81 PNdB @ 500 ft.
trapolations of extrapolations, but it appears that an aircraft with a nozzle velocity of 500 ft/sec and a thrust to weight ra-tio adequate enough to climb out very steeply would have a fly-over noise level of about 81 PNdB. A wing loading of 50 lb/ft2
is required, to accomodate the wing ducts, and to allow very low glide slope thrusts and noise levels. The resuting contours should fit inside the 500-foot limit, but the lower wing load-ing, the higher aircraft thrust-to-weight ratio, the lower en-gine thrust-to-weight ratio, and the lower exhaust velocity result in an aircraft with a 23% higher gross weight, a 4% slower cruise speed, and a 25-30% higher DOC when compared to the "quiet" de-sign (a 35-50% higher DOC than the "cheap" dede-sign). The appear-ance of the aircraft is shown in Figure 21.
E. THE EFFECT OF SIZE
When the size of the aircraft (that is, the number of seats) is increased, the resulting aircraft is cheaper to operate per seat, but noiser, due to its higher thrust. When the design evaluations of the two-stream augmentor wing types were repeated for the 50- and 110-seat aircraft, the results were as shown in
Figure 22.
At high noise levels, the size advantage (in DOC per seat)
Be- $13- 12-Direct 11-Seat Trip Cost At 500 Miles 10- 9-$8
o
80 Seat Designs A 110 Seat Designs 00 0 50 Seats 0 0 0 80 SeatsA
110 Seats 100 1000 1000085 PNdB Contour Area, Acres
low certain noise levels, the reverse is true. These crossover noise levels, however, are very low.
F. A COMPARISON WITH THE HELICOPTER
A comparison with the results of a helicopter study (Refer-ence 14) is interesting. Figure 23 shows the costs for 50 seat advanced helicopters and Augmentor Wing STOLs of various degrees
of quietness. The cost derivation for the STOLs has been modi-fied from the ATA Method to a method comparable with the DOC
method used in Reference 14. The labor costs have been increased by 25%, and the ground time was reduced from fifteen to five min-utes (the helicopter costs make no allowance for ground time). Furthermore, a cruise delay time of six minutes was eliminated, leaving a 20 mile terminal maneuver allowance included in the cruise segment of each flight. The sideline noise levels of
the aircraft can be compared directly to each other; however, the footprint areas cannot, due to the helicopters' superior takeoff and landing trajectories. Also, the helicopters were de-signed for a maximum range of only 400 miles.
It is seen that the STOL designs become cheaper at
distan-ces over 200 miles for cirresponding sideline noise levels.
Figure 24 shows a comparison between STOLs and advanced he-licopters of various sizes, all with sideline noise levels in
$15 Direct Seat Trip Cost 5-Augmentor Wing STOLs Advanced
Helicop-Numbers Refer to Sideline
Noise Levels, PNdB @ 500 ft.
75 7 9
74
0 100 200 300 400
Stage Length, Miles
FIGURE 23. Comparison Between Augmentor Wing STOLs and Advanced Helicopters.
the 80 PNdB range at 500 feet. Again the DOCs for the STOLs have been modified from the ATA Method. With these modifications,
the crossover in costwas below 200 miles for all sizes (the crossover in blocktime was at 75 miles).
These comparisons indicate that the market for STOL air-craft would be for the longer short-haul stages, that is, over stage lengths of more than 200 miles. This niche for STOLs can be maintained based on any sideline noise requirement, no matter what the size of the aircraft being operated.
If one makes a more logical comparison on the basis of foot-print areas, the results are much less conclusive, although it becomes reasonably clear that the STOL must suffer. A helicop-ter should be able to takeoff vertically to a height where the noise level on the ground is less than 85 PNdB, and land verti-cally from the same height. Thus the takeoff and landing foot-print would be a circle caused by the liftoff noise. The low noise levels of some of the helicopter designs would result in very small circles.
However, from this point on, the comparison of STOL and helicopter footprints becomes very dependent on other operation-al considerations. For example, the STOL aircraft all take off and land from the same runway, but helicopters might operate
Direct Seat Trip Cost 5-Augmentor Wing S TOLs-*,1 Advanced Heli-
copters-Numbers Refer to Seats
400
Stage Length, Miles
FIGURE 24. Comparison Between Augmentor Wing STOLs and Advanced Helicopters of various Sizes.