HAL Id: hal-00330906
https://hal.archives-ouvertes.fr/hal-00330906
Submitted on 30 May 2005
HAL is a multi-disciplinary open access
archive for the deposit and dissemination of
sci-entific research documents, whether they are
pub-lished or not. The documents may come from
teaching and research institutions in France or
abroad, or from public or private research centers.
L’archive ouverte pluridisciplinaire HAL, est
destinée au dépôt et à la diffusion de documents
scientifiques de niveau recherche, publiés ou non,
émanant des établissements d’enseignement et de
recherche français ou étrangers, des laboratoires
publics ou privés.
Contribution of multi-temporal remote sensing images
to characterize landslide slip surface ? Application to the
La Clapière landslide (France)
Bérangère Casson, Christophe Delacourt, Pascal Allemand
To cite this version:
Bérangère Casson, Christophe Delacourt, Pascal Allemand. Contribution of multi-temporal remote
sensing images to characterize landslide slip surface ? Application to the La Clapière landslide (France).
Natural Hazards and Earth System Science, Copernicus Publications on behalf of the European
Geo-sciences Union, 2005, 5 (3), pp.425-437. �hal-00330906�
SRef-ID: 1684-9981/nhess/2005-5-425 European Geosciences Union
© 2005 Author(s). This work is licensed under a Creative Commons License.
Natural Hazards
and Earth
System Sciences
Contribution of multi-temporal remote sensing images to
characterize landslide slip surface – Application to the
La Clapi`ere landslide (France)
B. Casson, C. Delacourt, and P. Allemand
Laboratoire Sciences de la Terre – UCB and ENS-LYON 1, France
Received: 12 July 2004 – Revised: 13 March 2005 – Accepted: 8 April 2005 – Published: 30 May 2005 Part of Special Issue “Landslides and debris flows: analysis, monitoring, modeling and hazard”
Abstract. Landslide activity is partly controlled by the
ge-ometry of the slip surface. This activity is traduced at the surface by displacements and topographic variations. Conse-quently, multi-temporal remote sensing images can be used in order to characterize the geometry of landslide slip surface and its spatial and temporal evolution. Differential Digital Elevation Models (DEMs) are obtained by subtracting two DEMs of different years. A method of multi-temporal im-ages correlation allows to generate displacement maps that can be interpreted in terms of velocity and direction of move-ments. These data are then used to characterize qualitatively the geometry of the slip surface of the la Clapi`ere landslide (French Southern Alps). Distribution of displacement vec-tors and of topographic variations are in accordance with a curved slip surface, characterizing a preferential rotational behaviour of this landslide. On the other hand, a spatial and temporal evolution of the geometry of the slip surface is pointed out. Indeed, a propagation of the slip surface un-der the Igli`ere bar, in the W part of the landslide, is suspected and can be linked to the acceleration of the landslide in 1987. This study shows the high potential of multi-temporal remote sensing images for slip surface characterization. Although this method could not replace in situ investigations, it can re-ally help to well distribute geophysical profiles or boreholes on unstable areas.
1 Introduction
Landslide activity is controlled by external parameters like precipitations, erosion or run-off and internal parameters, among which the geometry of the slip surface and its
spa-tial and temporal evolution play an important role.
Dis-Correspondence to: B. Casson
placements and vertical topographic variations traduce this activity at the surface. The depth and the geometry of the slip surface are usually measured directly on boreholes (Scullin, 1994) or indirectly by geophysical investigations (Bogoslovski and Ogilvy, 1977; Mauritsch et al., 2000; Israil and Pachauri, 2003). Nevertheless, these techniques which require field operators are often difficult to apply on unstable area. Moreover, they give results limited to the area and to the period of investigation (Maquaire et al., 2001).
An alternative possibility is to use surface data like dis-placement fields and vertical variations of topography to characterize the geometry of the slip surface (Hutchinson, 1983; Bishop, 1999). This has been done using balanced cross sections to evaluate the depth of the slip surface (Ehlert, 1986), from surface displacements and depletion volumes. Nevertheless, these works concern only translational cases (Bishop, 1999).
Surface displacements can be directly measured on the field on few points, using tacheometric techniques or GPS methods (Gili et al., 2000; Malet et al., 2002; Rizzo, 2002; Squarzoni et al., 2005). Despite their high accuracy, these measurements have a low spatial resolution and they require the access to the site. Remote sensing is then a powerful tool for improving the spatial resolution of measurements, with-out in situ investigations. SAR interferometry has pointed out its high potential for detection (Fruneau et al., 1996), kinematic characterization (Berardino et al., 2003; Squar-zoni et al., 2003) and modelling (Fruneau et al., 1996) of landslides. However, these supports exist only since 1991 and geometric and environmental constraints limit their use in mountain context (Hanssen, 2001). Aerial photographs can be used to overcome these problems. These images have a temporal and a spatial resolution adapted to landslide stud-ies. Moreover, these kinds of images are acquired for 50 years. They are currently used to generate Digital Elevation
426 B. Casson et al.: Remote sensing and characterisation of landslide slip surface 18 Fig ur e 1. T he la Clapièr e landslide: ( a) lit holog y and str uct ur e o f t he land slide, ( b) m or pholo g y o f the landslide ( fro m Q uen ot , 2000 ), (c ) EDM of t he t ar g et 10 (fr om Follacci, 1999 ).
Fig. 1. The la Clapi`ere landslide: (a) lithology and structure of the landslide, (b) morphology of the landslide (from Quenot, 2000), (c) EDM
of the target 10 (from Follacci, 1999).
Models (DEMs) and ortho-rectified images, in order to detect and to follow landslide activity (Weber and Herrmann, 2000; Casson et al., 2003; Van Westen and Lulie Getahan, 2003).
This paper presents a methodology of slip surface char-acterization using surface measurements. The processing of surface data generation is also detailed. Then, a qualitative analysis of these multi-temporal remote sensing data is re-alised to characterize the slip surface geometry of the La Clapi`ere landslide (French Southern Alps) and its spatial and temporal evolution.
2 The La Clapi`ere landslide
The La Clapi`ere landslide is located in the French Southern Alps (Fig. 1), downstream from the village of Saint-Etienne-de-Tin´ee, on the boundary of the Mercantour massif. This landslide affects an area of about 100 ha between 1100 and 1800 m of elevation (Fig. 1b). La Clapi`ere is affected by av-erage movements of 1 cm/day since 1982 (Fig. 1c).
The landslide affects the hercynian basement rocks (Fig. 1a) composed mainly by migmatitic gneiss (Follacci et al., 1988b). A subhorizontal level of metadiorite, called “barre d’Igli`ere”, crosses the landslide at an average eleva-tion of 1350 m (Figs. 1a and 1b). All geological units present a hercynian foliation with a near subhorizontal strike at the
surroundings of the landslide and a 10–30◦NE strike within
the landslide (Follacci et al., 1988a; Gunzburger and Lau-monier, 2002). The landslide area is very fractured with three major directions of faults (Guglielmi et al., 2000), which are
N10–30◦E, N90◦E and N110–140◦E (Fig. 1a). A fault with
a N20 direction divides the landslide in two parts by the mid-dle (Fig. 1a).
The landslide is bounded at the top by a 80 m high main scarp divided in two parts, called “lobes” (Follacci, 1987). Two secondary scarps have been developed within the land-slide. One, with a N120 direction, is located at an average el-evation of 1500 m and another one is developed along a N90 fault since 1987, just under the top NW lobe (Fig. 1b). A hectometric landslide superimposed on the major one affects
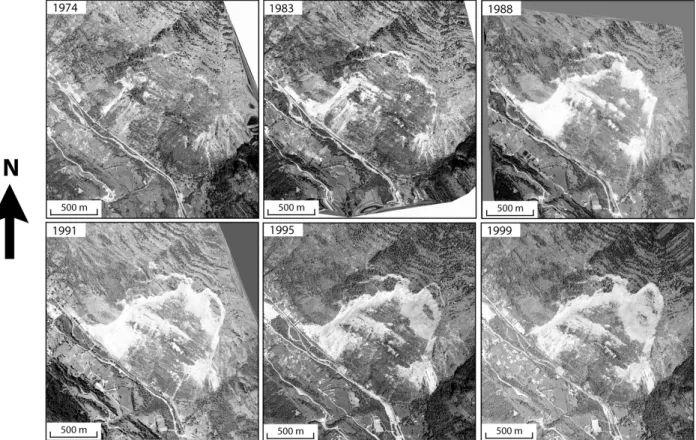
19 Fig ur e 2. Six or tho-re cti fied im ag es o f t he la Clapièr e landslide fo r t he tim e int er val 1974-1999 .
Fig. 2. Six ortho-rectified images of the la Clapi`ere landslide for the time interval 1974–1999.
the upper NE lobe (Fig. 1b). The upper part of the landslide between the headscarp and the “barre d’Igli`ere” has a char-acteristic morphology in decametric steps (Follacci, 1987; Gunzburger, 2001). These structures have a geological ori-gin (Gunzburger, 2001). Morphologic characteristics of the la Clapi`ere landslide are in favour of a rotational movement of this unstable area (Varnes, 1978; Follacci, 1987).
This landslide is probably active for one century. Recent datings even propose an age of about 10 000 years (Bigot-Cormier et al., 2003). First studies of the La Clapi`ere land-slide have been realized in 1977. Electronic Distance Mea-surements (EDM) are regularly acquired since 1982. These data point out velocities of about 1 cm/day. Two accelera-tions have been registered: one during autumn of 1987 with velocities greater than 10 cm/day and one at the beginning of 1997 with velocities greater than 5 cm/day (Follacci, 1999) (Fig. 1c). Moreover, EDM point out a seasonal response of the landslide characterized by an acceleration of move-ments correlated to snow melting (Follacci, 1987; Follacci et al., 1988b) (Fig. 1c). For a few years, EDM are combined with different other investigations: hydro-geological studies (Compagnon et al., 1997; Guglielmi et al. 2000), remote sensing (Fruneau et al., 1996; Serratrice, 2001; Casson et al., 2003; Squarzoni, 2003) and subsurface geophysical in-vestigations (Lebourg et al., 2003). Different types of geo-metrical, mechanical or hydro-mechanical models have been derived from this data set (Fruneau et al., 1996; Soukatchoff and Guglielmi, 2001; Cappa et al., 2004), but actually none
follows the evolution of the slip surface geometry.
EDM have been used by Follacci in 1987 in order to re-alize a conceptual model of landslide activity. In his opin-ion, the La Clapi`ere landslide progressively evolves from (1) an unorganized stage with a discontinue slip surface to (2) a rotational landslide. Furthermore, Follacci (1987) observes different parts within the landslide which belongs to different stages of evolution. These parts are limited by structural or lithologic boundaries, like the N20 central fault or the “barre d’Igli`ere” (Fig. 1a). He points out two areas: the E part of the N20 central fault is characterized by ancient and fast move-ments whereas the W part is affected by more recent and slower displacements. Using these observations and geolog-ical considerations, he suggests that the E part belongs to the rotational stage of the landslide with a continue slip surface from top to bottom of the landslide. On the other hand, the W part of the N20 central fault is associated to the first stage characterized by a discontinue slip surface, which only ex-tends from the top of the landslide to the “barre d’Igli`ere”. The area of the central fault accommodates differential dis-placements.
EDM show that displacement vectors are all parallel and that accelerations are synchronous within the landslide. This suggests a deep movement (Follacci, 1987) of this landslide, evaluated to more than 50 m depth, using the surface of the
landslide of 100 ha and its estimated volume about 50.106m3
428 B. Casson et al.: Remote sensing and characterisation of landslide slip surface
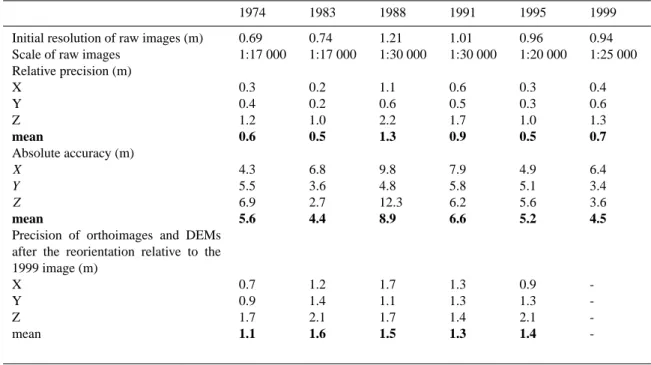
Table 1. Characteristics of raw images, DEMs generated from these images and final reoriented supports.
1974 1983 1988 1991 1995 1999 Initial resolution of raw images (m) 0.69 0.74 1.21 1.01 0.96 0.94 Scale of raw images 1:17 000 1:17 000 1:30 000 1:30 000 1:20 000 1:25 000 Relative precision (m) X Y Z 0.3 0.4 1.2 0.2 0.2 1.0 1.1 0.6 2.2 0.6 0.5 1.7 0.3 0.3 1.0 0.4 0.6 1.3 mean 0.6 0.5 1.3 0.9 0.5 0.7 Absolute accuracy (m) X Y Z 4.3 5.5 6.9 6.8 3.6 2.7 9.8 4.8 12.3 7.9 5.8 6.2 4.9 5.1 5.6 6.4 3.4 3.6 mean 5.6 4.4 8.9 6.6 5.2 4.5
Precision of orthoimages and DEMs after the reorientation relative to the 1999 image (m) X Y Z mean 0.7 0.9 1.7 1.1 1.2 1.4 2.1 1.6 1.7 1.1 1.7 1.5 1.3 1.3 1.4 1.3 0.9 1.3 2.1 1.4 -3 Methodology
Previous studies used displacement maps and differential DEMs derived from optical remote sensing data to monitor landslide activity (Powers et al., 1996; K¨a¨ab, 2002; Mora et al., 2003; Van Westen and Lulie Getahun, 2003; Delacourt et al., 2004). Nevertheless, these data can also be used to char-acterise qualitatively the geometry of landslide slip surface (Hutchinson, 1983; Bishop, 1999). Indeed, distribution of displacement vectors and of vertical topographic variations is function of the slip surface geometry. The study is re-alised in 2D, along longitudinal cross sections of the land-slide, which extend from top to bottom. It is supposed that the landslide behaves as a rigid bloc along each profile. This implies that internal deformation is negligible and that dis-placement velocities are constant from slip surface to topo-graphic surface. These strong hypotheses, which are not al-ways true, will be discussed later. The slip surface charac-terisation only takes into account surface data which repre-sent deep processes. Consequently, displacements and to-pographic variations, registered on scree slopes, and which are related to superficial processes, are not used. First, sur-face data processing is explained. Then, conceptual models, which relate distribution of displacements and of topographic variations to slip surface geometry, are described.
3.1 Data set processing
Six stereoscopic pairs of aerial photographs, acquired above the La Clapi`ere landslide, have been selected from the Institut G´eographique National (IGN) data base for the years 1974, 1983, 1988, 1991, 1995 and 1999 (Fig. 2). These
im-ages cover a period of 25 years with a temporal resolution ranging from 3 to 9 years. The analogical images are scanned in order to obtain a spatial resolution of about 1 m (Table 1). For each year, a DEM and an ortho-rectified image are gen-erated. Then differential DEMs and displacement maps are processed between different years.
3.1.1 DEMs and ortho-rectified images generation
A three step methodology of DEMs generation from stereo-scopic pairs of aerial photographs has been developed (Cas-son et al., 2003; Cas(Cas-son, 2004). First, position and orienta-tion of acquisiorienta-tion cameras are optimized using a least mean square inversion (Kraus and Waldha¨usl, 1994). Secondly, stereoscopic images are correlated using the MEDICIS cor-relator, developed by the Centre National des Etudes Spa-tiales (CNES). This step consists in finding for each point of the first image, the point representing the same object on the second one. Each pair of correlated points is called a pair of homologous points. Finally, DEMs are calculated from camera parameters and homologous point positions. A least mean square inversion is used to improve the intersection of lines of sight of the two cameras (Baratoux et al., 2001; Cas-son et al., 2003). After this step, the distance between the lines of sight of the two cameras has to be null on each DEM point. Consequently, for each DEM point, the residual shift between the lines of sight, along each component X, Y and
Z, is used to calculate precision maps (Casson et al., 2003).
This relative precision is a standard deviation, which is only function of calculation parameters. It shows the capacity of the methodology to reconstruct topography, in function of entered data (Mikhail et al., 2001). This relative precision
Table 2. Characteristics and precisions of differential DEMs (with µ the average and σ the standard deviation of data).
74–83 83–88 88–91 91–95 95–99 % of eliminated points by statistic law (µ±2σ ) 0.368 0.390 1.113 1.133 0.046 VA value for differential DEMs (m) 2.39 2.74 3.96 3.21 2.19
is opposed to the absolute accuracy which depends on ex-ternal data. The absolute accuracy corresponds to the shift between the position of one point in the space, given by the DEM, and its real position (Mikhail et al., 2001). The six pairs of aerial photographs are used to generate six DEMs on the la Clapi`ere landslide. In agreement with the resolution of scanned images, these DEMs are interpolated with a metric resolution (Table 1). The relative precision of the DEMs is less than 1.1 m in planimetry and less than 2.2 m in altime-try. Their mean absolute accuracy is between 4.4 and 8.9 m (Table 1).
An ortho-rectified image is a projection of a raw image in an absolute coordinate system, taking topography into ac-count. In our case, each image point can be associated to an absolute position given by the DEM, in a conic conform pro-jection. The raw image is then resampled in the coordinate system of the DEM. The absolute accuracy of ortho-images is equal to the absolute accuracy of DEMs (Table 1).
Nevertheless, measurements of surface displacements and topographic variations above the la Clapi`ere landslide quire more precise data. Thus, each orthoimage has been re-oriented in the frame of the more recent one. The 1999 image has been chosen as the reference because of its best absolute accuracy (Table 1). The re-orientation uses control points lo-cated on stable areas and uniformly distributed around the landslide (Casson et al., 2003; Casson, 2004). These points are used to calculate the distortion between the reference im-age and the other ones. The components of this geometric transformation are calculated using a least mean square in-version. This transformation is then applied to each DEM point and each ortho-image point. After this reorientation, all DEMs and orthoimages are projected in the same ground co-ordinate system (Fig. 2). The precision of this re-orientation relative to the 1999 image ranges between 0.7 to 2.1 m (Ta-ble 1).
3.1.2 Differential DEMs generation
A differential DEM shows vertical topographic variations on one geographic point, during a defined time interval. For
example on Fig. 3, the differential 1zP2on the position H2
is equal to the difference between the elevation of point P2at
time t2and the elevation of the point located on position H2
at time t1.
After the reorientation step, DEMs are subtracted two by two. A positive value corresponds to an accumulation of ma-terials, a negative one, to depletion and a null one to transfer or to stability. The differences are close to 0 on stable
ar-20
Figure 3. Definition of displacement and of topographic variation, with P1 the point at time t1, P2 the
same point at time t2, H1 the horizontal position of point P1 at time t1, H2 the horizontal position of
point P2 at time t2, Z1 the elevation of point P1 at time t1, Z2 the elevation of point P2 at time t2, Z'1
the elevation of point located on H2 at time t1 and Z'2 the elevation of point located on H1 at time t2.
Fig. 3. Definition of displacement and of topographic variation,
with P1the point at time t1, P2the same point at time t2, H1the
horizontal position of point P1at time t1, H2the horizontal position of point P2at time t2, Z1the elevation of point P1at time t1, Z2the
elevation of point P2at time t2, Z10 the elevation of point located on
H2at time t1and Z20 the elevation of point located on H1at time t2.
eas, outside the landslide. Differential DEMs have been sta-tistically processed in order to eliminate topographic data of very high amplitude. Extreme values, outside of µ±2σ (with
µthe average and σ the standard deviation of data), are
re-moved. More than 99% of points for each differential DEM are retained (Table 2).
Differential DEMs can be represented by maps of 3 colours showing ablation, accumulation and transfer/stable areas (Fig. 4a). In order to generate these maps, the vertical precision VA of each point of differential DEMs is defined. It corresponds to the sum of vertical precision of this point on each DEM. These values are extracted from Z-relative preci-sion maps, associated to each DEM. For a given point, if the absolute value of the differential DEM is larger than VA, the topographic variation is significant. It is plotted in blue if it is positive and in red if it is negative (Fig. 4a). On the opposite, if the absolute value of the differential DEM is lower than VA, it is undetermined and plotted in yellow. In this case, the interpretation depends on the velocity of displacements. Indeed, if no displacement is recorded on undetermined ar-eas, the zones are certainly stable. On the opposite if signif-icant movements are recorded, materials are transferred on this zone, without significant changes in topography. For the la Clapi`ere landslide, during the 25 years of the study, VA values are between 2.19 m and 3.95 m (Table 2).
430 B. Casson et al.: Remote sensing and characterisation of landslide slip surface 21 Fig ur e 4 . Sur face dat a ex tract ed fro m DEM s a nd or thoim ag es o f the la Clapièr e landslide: ( a) dif fe re ntial DE M r epr esent ed by a t hr ee color s m ap fo r t he t im e int er val 1995-1999, ( b) m ap o f displacem ent v elocit ies f or t he tim e int er val 1995-1999, (c ) m ap o f displa cem ent dir ect ions fo r the tim e in te rv al 1995-1999.
Fig. 4. Surface data extracted from DEMs and orthoimages of the la Clapi`ere landslide: (a) differential DEM represented by a three colors
map for the time interval 1995–1999, (b) map of displacement velocities for the time interval 1995–1999, (c) map of displacement directions for the time interval 1995–1999.
3.1.3 Displacement maps generation
Orthoimages and associated DEMs are used to calculate the 3D displacement of each point. The displacement d (Fig. 3) is decomposed in a horizontal displacement dh and a vertical one dz. The horizontal displacement dh is decomposed in two components dx and dy.
The MEDICIS correlator locates two homologous points on two images taken on the same area. Consequently, if two ortho-rectified images of two different dates are correlated, the shift between the position of one point on the reference image and the position of the point representing the same ob-ject on the second image is obtained (Vadon and Massonnet, 2002). These shifts multiplied by the resolution of images, which is of 1 m, give the horizontal displacement of each im-age point during the studied time interval. These kinds of studies have been already realized and validated on glaciers and landslides (K¨a¨ab, 2002; Delacourt et al., 2004). Never-theless, this technique is efficient only if the surface aspect remains stable between the two successive images.
After the correlation phase, the points located outside the landslide have to present a null shift because they are located on stable areas. On the opposite, points located within the
landslide can present a shift different from 0 (Fig. 4b). One DEM is available for each ortho-image of each year. So, the
Z position of each point before and after the displacement,
during a defined time interval, is known. Consequently, as horizontal and vertical components of movement are mea-sured, the 3D displacement of each image point is calculated. Displacements can be interpreted in terms of velocity and direction. Velocities are obtained by dividing the norm of 3D displacement vectors by time (Fig. 4b). The direction of movement is calculated from the components of horizon-tal displacement relative to the North direction. Then, these directions are subtracted to the average direction of the main slope of the landslide. Finally, the shift between the direction of displacement vectors and the direction of the main slope of the landslide is available for each image point (Fig. 4c).
The precision of displacement depends on the relative pre-cision of each DEM, their absolute accuracy, the prepre-cision obtained after the re-orientation step and the precision of the correlation phase. A mathematic formulation of this total precision appears complex. So it was decided to realize a practical evaluation of the final precision of velocity maps. Indeed, stable areas, located outside the landslide, would have a null velocity. Consequently, displacement registered
Table 3. Characteristics and precisions of displacement maps (with µ the average and σ the standard deviation of data).
74–83 83–88 88–91 91–95 95–99 Retained precision in m 4.9 10.4 8.2 13.8 4.9 Retained precision in cm/day 0.15 0.59 0.74 0.96 0.34 % of eliminated points by statistic law (µ±6σ ) 0.7 0.0 0.2 0.03 0.003 % of eliminated points after sorting by sense of
displacements 6.1 9.3 7.0 4.7 5.1
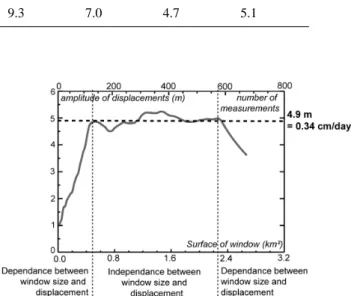
on stable areas could be considered as a good evaluation of the precision of displacement maps. The precision is eval-uated by plotting the average displacement, computed on a sliding window on stable areas, relative to the size of this window (Fig. 5). The average displacement becomes inde-pendent of the size of the window when the size of this win-dow becomes large enough (Fig. 5). Precision values ob-tained by this way are included between 4.9 and 13.8 m, that corresponds to an error bar for velocity maps included be-tween 0.15 and 0.96 cm/day (Table 3). It appears quite im-possible to evaluate quantitatively the precision of direction maps. Indeed, directions of displacements are randomly dis-tributed on stable areas. So it seems that no preferential ar-tificial displacement direction strongly alters the computed directions. Consequently, an area which presents homoge-neous direction values in the landslide can be considered sig-nificant for the interpretation.
Loss of coherence is sometimes observed during the cor-relation phase because of the change in the surface aspect between the acquisitions of the two images. So, some points cannot be correlated. Moreover, some points are correlated even if they do not represent the same object. For example, two different neighbouring trees in a dense forest can be cor-related because of their geometrical similarity. These bad correlated points have to be eliminated from displacement maps. Generally, the correlation quality is controlled by the correlation coefficient. Nevertheless, during multi-temporal correlation, this coefficient can be high even if directions of displacements appear unrealistic relative to the main slope direction of the mountain side. Consequently, it was decided to eliminate these bad correlated points using their sense of displacements. One point, registering a movement larger than the error bar of the amplitude map, but which presents an unrealistic direction of displacement, is then eliminated. It is then represented in white on displacement maps. The amount of removed points after this sorting step is less than 10% (Table 3). A statistic sorting is applied too. It allows to eliminate points which present amplitude of displacement really larger than maximal amplitudes of movements on the landslide. Thus, points with displacement amplitude larger than µ±6σ in absolute (with µ the average and σ the stan-dard deviation of data) are removed. This sorting step pre-serves more than 99% of remaining points (Table 3). Among all data, displacement maps of 1983–1988 and 1991–1995 present the worst quality because of the important changes
22 Figure 5. Evaluation of the precision of amplitudes of displacements, example of 1995 -1999.
Figure 6. Validation of displacement data - Amplitudes of EDM are correlated with amplitudes obtained by images correlation, example of targets 23, 29 and 25.
Fig. 5. Evaluation of the precision of amplitudes of displacements,
example of 1995–1999.
of surface state during these time intervals, due to important scree slope development.
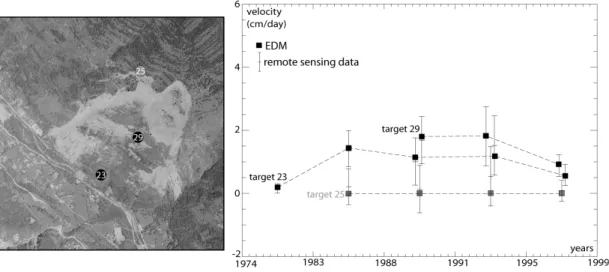
EDM are registered on the la Clapi`ere landslide since 1982 (Follacci, 1999). The distances between targets and theodoliths are available between 1 November 1982 and 6 June 1999 for 13 targets located throughout the landslide. As theodoliths are located in front of the landslide at an elevation around 1360 m and at a distance larger than 1000 m from tar-gets, the registered movements can be compared to horizon-tal displacements measured by image correlation on targets location (Casson, 2004). Figure 6 shows the good correla-tion between amplitude of EDM and amplitude of horizontal displacements calculated using image correlation, both for targets in movements within the landslide (targets no. 23, 29 for example) and for targets located on stable areas (target no. 25 for example) (Delacourt et al., 2004).
3.2 Conceptual models
These surface data can be used to analyse qualitatively the slip surface geometry of landslides, using conceptual mod-els. Two major types of landslide are distinguished accord-ing to the geometry of the slip surface (Varnes, 1978): ro-tational landslides are characterized by a curved slip surface and translational landslides are characterized by a planar or nearly planar slip surface (Figs. 7a and 7b). In this second case, material moves along the planar surface without ro-tation. Nevertheless, the slip surface is often listric at the
432 B. Casson et al.: Remote sensing and characterisation of landslide slip surface
22
Figure 5. Evaluation of the precision of amplitudes of displacements, example of 1995 -1999.Figure 6. Validation of displacement data - Amplitudes of EDM are correlated with amplitudes obtained by images correlation, example of targets 23, 29 and 25.
Fig. 6. Validation of displacement data – Amplitudes of EDM are correlated with amplitudes obtained by image correlation, example of
targets no. 23, 29 and 25.
23 Fig ur e 7 . Concept ual m odels w h ich r elat ed sur face displacem ent s and topo g raphic v ar iat ions to slip sur face g eo m etr y: ( a) t heo re tical distr ibut ion of displacem en t v ect or s in a uni fo rm tr anslat ional landslide, ( b) t heo re tical dist ribut ion o f displacem ent v ect or s in a r ota tiona l landslide, ( c) ( d) re lat io n bet w een r ot at ion an g le and dist ribut ion o f t opo gr aphic v ar iat ions, w ith λ t he char ac te ris tic w av e leng th o f t he t op og raphy and d t he displacem ent v ect or s. A r ota tion w ith a w eak ang le is pr esent ed on ( c) and t he case o f a l ar g e ro ta tion an g le on ( d) .
Fig. 7. Conceptual models which related surface displacements and topographic variations to slip surface geometry: (a) theoretical
distribu-tion of displacement vectors in a uniform transladistribu-tional landslide, (b) theoretical distribudistribu-tion of displacement vectors in a rotadistribu-tional landslide,
(c) (d) relation between rotation angle and distribution of topographic variations, with λ the characteristic wave length of the topography and
d the displacement vectors. A rotation with a weak angle is presented on (c) and the case of a large rotation angle on (d).
top (Fig. 7a) of the landslide (Hutchinson, 1988; Cruden and Varnes, 1996).
Distribution of displacement vectors and of topographic variations is characteristic of the type of landslide (Hutchin-son, 1983). Under the assumptions described in the introduc-tion of part 3, a uniform translaintroduc-tional landslide is character-ized by displacement vectors that are all equal, along a profile crossing the landslide from top to bottom (Fig. 7a). A rota-tional landslide presents for its part a decrease of the ratios of vertical to horizontal displacements, from top to bottom of the landslide (Dikau, 1996) (Fig. 7b). Moreover, if there is no internal deformation and no boundary conditions, the
norm of displacement vectors remains constant from top to bottom of the rotational landslide.
For rotational landslide, distribution of topographic varia-tions is a function of the rotation angle and of the dominant
topographic heterogeneities. For a dominant topographic
wave length of the same order than the amplitude of dis-placements, a weak angle of rotation produces an alterna-tion of positive and negative vertical variaalterna-tions of topogra-phy (Fig. 7c). For large rotation angles, landslide appears divided in three areas: an upper one in depletion, a central one in transfer and a basal one in accumulation (Fig. 7d).
24 Fig ur e 8. Char ac te riz at ion of
the slip sur
face g eo m etr y of t he m ain body of t he La Clapièr e landslide. ( a) Dist ribut ion of t ota l am plit ude o f displacem ent s obser ve d dur ing t he t im e int er val 1974-1983. T he se a m plit udes dec rease fro m to p t o bo tto m o f t he m ain b ody of the landslide. (b ) Dist ribut ion o f r at ios o f v er tical displacem ent s t o hor iz ont al ones obser ve d dur ing t he per iod 1974-1983. T hese ra tios decr ease from top to bo tto m o f t he m ain body o f t he l andslide. ( c) Distr ibut ion of topo g raphic v ar iat ions along t w o pr of iles in t he La Clapièr e landslide fo r th ree tim es in te rv als 1974-1983, 1983-1988 and 1995-1999 . T he c or re lat ion be tw
een local slopes v
ar
iat
ions and Fig. 8. Characterization of the slip surface geometry of the main body of the La Clapi`ere landslide. (a) Distribution of total amplitude of displacements observed during the time interval 1974–1983. These amplitudes decrease from top to bottom of the main body of the landslide.
(b) Distribution of ratios of vertical displacements to horizontal ones observed during the period 1974–1983. These ratios decrease from top
to bottom of the main body of the landslide. (c) Distribution of topographic variations along two profiles in the La Clapi´ere landslide for three times intervals 1974–1983, 1983–1988 and 1995–1999. The correlation between local slopes variations and differential data distribution is only visible for 1974–1983 and 1995–1999. This correlation is lost between 1983 and 1988 (profile 1 presents only an ablation area because it is located in the top part of the landslide). These suggest an increase of the amount of rotation during 1983–1988 followed by a decreasing after 1995.
from top to bottom, due to the decrease of slip surface dip, produce the decrease of total amplitude of displacements from top to bottom of the landslide (Dikau, 1996). More-over, if volume of the landslide remains almost constant, the decrease of displacement amplitude is associated with a de-formation of the bottom of the landslide (Dikau, 1996), im-plying an apparent uplift. This deformation can erase the to-pographic heterogeneities and reduce the area of the transfer zone in the middle of the landslide.
4 Results
Conceptual models are applied to the la Clapi`ere landslide using displacement maps and differential DEMs, of the time interval 1974–1999. This analysis focuses on the main body of the la Clapi`ere landslide, without considering the top su-perimposed landslide. Two major scree slopes can be pointed out on the La Clapi`ere landslide. These scree slopes are not interpreted because they are associated to superficial dis-placements. These scree slopes, located on basal sides of the landslide, are characterized by a loss of coherence on ve-locity maps due to important surface changes between the
successive acquisitions of images. These areas appear in white on displacement maps because of the sorting steps of points. In a first time, the main slip surface geometry of the la Clapi`ere landslide is characterised. Then, its spatial and temporal evolution is discussed.
4.1 Main landslide slip surface
Velocity maps of the la Clapi`ere landslide show clearly that displacement vectors are not all equal on the landslide be-tween 1974 and 1999 (Fig. 8a). It implies that the la Clapi`ere landslide does not present a planar slip surface with a trans-lational behaviour. Indeed, the ratio of vertical component of displacements to horizontal ones decreases from top to bot-tom of the landslide (Fig. 8b). Moreover, total amplitude of displacement decreases from top to bottom of the landslide (Fig. 8a) and an apparent uplift is registered at the base of the landslide. Pre-existing steps are not visible under the Igli`ere bar and the zone in transfer is not very spread. All these ob-servations are characteristic of a non uniform rotational be-haviour of this landslide along a curved slip surface. This is in agreement with some geological and morphologic studies realized on this landslide for 30 years (Follacci, 1987).
434 B. Casson et al.: Remote sensing and characterisation of landslide slip surface
26
Fig. 9. Spatial and temporal evolution of the slip surface geometry of the main body of the la Clapi`ere landslide – the location of the Igli`ere
bar appears in black on each image. Black circles focus on interesting areas. (a) Distribution of velocity of total displacements before 1983 and after 1988. (b) Distribution of direction of displacements before 1983 and after 1988. (c) Distribution of ratio vertical displacements to horizontal ones before 1983 and after 1988.
The comparison between the wave length of the topog-raphy produced by the pre-existing steps and the distribu-tion of differential topography is realized along two profiles which partly cross the landslide (Fig. 8c). An alternation be-tween positive and negative variations of topography of the same wave length as topography is observed between 1974 and 1983 for the two profiles (Fig. 8c). This alternation dis-appears for the interval 1983–1991 whereas the topography produced by the steps is always visible (Fig. 8c). During this period, three zones can be defined within the landslide: a top one in depletion, a central one in transfer and a basal one in accumulation. After 1995, the alternation between pos-itive and negative variations of topography is visible again but only on the profile 2 (Fig. 8c). Steps are no more visible on the topographic profile 1. These observations suggest an increase of the rotation angle between 1983–1991 relative to the period 1974–1983, obviously correlated with the increase of the average velocity during the same period. After 1995, the rotation decreases. The disappearance of steps on the profile 1 can be explained by the development of a scarp in 1987 just above this area. This scarp development has proba-bly generated an intense internal deformation that could have erased the steps.
4.2 Spatial and temporal evolution of the slip surface
As explained in the geological setting, the conceptual model of the La Clapi`ere landslide developed by Follacci (1987), suggests that the slip surface was more extended in the E part than in the W part of the landslide before 1987.
Before 1983, velocity map of the la Clapi`ere landslide shows a stable area at the base of the landslide that is more
extended on the SW side of the landslide than on SE side (Fig. 9a). At the same time, the direction map points out displacements mostly directed in the S direction above the Igli`ere bar in the W part of the landslide (Fig. 9b), at more
than 10◦ degrees from the main slope direction. The
re-maining surface registers displacements mostly directed in the direction of the main slope. So, before 1983, the “barre d’Igli`ere” seems to limit the movements in the W part of the landslide. In the E part, the “barre d’Igli`ere” appears to be involved in the movements. These observations are in agree-ment with Follacci’s model.
After 1988, the stable area of the SW part of the landslide is affected by movement with registered velocities higher than 1.2 cm/day (Fig. 9a). Moreover, from this date, all dis-placements throughout the landslide are homogeneous and directed along the main slope direction (Fig. 9b). So, af-ter 1988, the “barre d’Igli`ere” is not an obstacle to displace-ments anymore in the W part of the landslide.
If it is assumed that velocity is independent of depth and that internal deformation is negligible, the dip of displace-ment vectors is equal to the slope of slip surface. Before 1983, these dips decrease from top to bottom of the landslide (Fig. 9c). This suggests a curved aspect of the slip surface from top to bottom of the landslide, that confirms its rota-tional behaviour. After 1988, the area just above the “barre d’Igli`ere” registers displacement vectors with high dip in the W part of the landslide. This suggests the development of a new slip surface or the propagation of the pre-existing slip surface below the Igli`ere bar.
In conclusion, the “barre d’Igli`ere” bounds the movements in the W part of the landslide before 1983. The slip surface
probably only extends from top to the “barre d’Igli`ere” in this area. Displacements are then controlled by this lithologic unit and by the N20 central fault. After 1988, the bound-ary effect of the “barre d’Igli`ere” disappeared. The “barre d’Igli`ere” is implied in the global movement. The slip sur-face probably extends from top to base of the landslide in the W part of the landslide since this date.
This spatial evolution of the slip surface during time can be linked to the activity peak of the landslide in 1987 (Follacci et al., 1988b; Follacci, 1999). The intensification of movements induced the development of a new scarp in the NW upper part of the landslide. One visible consequence is the stabilization of the NW lobe of the landslide. Moreover, it could have modified the state of stress within the landslide (Follacci et al., 1988b). This change in the state of stress could have induced the evolution of the slip surface geometry in the W part of the landslide.
5 Discussion and conclusion
This paper presents a methodology for extracting surface data from DEMs and orthoimages. Velocity maps, direc-tion maps and differential maps which are generated by this processing allow to monitor landslide activity by measuring surface displacements and topographic variations with a pre-cision of a few meters. Displacement maps have been val-idated using EDM. This method is particularly efficient for monitoring slow landslides characterized by pluri-metric dis-placements per years. Indeed, faster landslides would present important surface changes which would not allow to register surface displacements by image correlation at the time reso-lution of some years. Concerning very slow landslides, our methodology is not enough precise at this date for registering centimetric movements per years. Nevertheless, very sim-ple improvements in the methodology of DEMs generation would enhance the detection threshold. For example, the use of accurate absolute points during the orientation of cameras would produce a real improvement in the final absolute accu-racy of DEMs. On the other hand, if image correlations are not possible because of the changing of surface state, differ-ential topography can be used in order to estimate the inten-sity of movements. Indeed, in this study the variation of the rotation amount is in agreement with variations of velocities of the La Clapi`ere landslide.
In a second time, the potential of these data for slip surface characterization is pointed out. Without denying the neces-sity of geophysical investigations to image slip surface, we have shown that remote sensing could be an alternative and a complementary method to study the internal geometry of landslide. Indeed, the rotational behavior of the La Clapi`ere landslide can be suspected only from surface data, in agree-ment with bibliographic data. Secondly, the spatial and tem-poral evolution of the geometry of the slip surface is pointed out from our data set. A modification in the geometry of the slip surface at the level of the Igli`ere bar after 1988 is pointed out.
This study is realised under very strong assumptions and only in 2D. It implies that the intense fracturation of the area and the possibility for this landslide to behave differently in space are not taking into account. Nevertheless, at first order, displacement data and topographic variations are homoge-neous on the main body of the landslide. Consequently, at the scale of the landslide, this assumption is realistic. We do not take into account deformation and 3D effect. Nev-ertheless, a westward propagation of deformation is neces-sary to mechanically explain the evolution of the slip sur-face, proposed in this paper. Consequently, despite our hy-pothesis, the methodology allows to suspect some large het-erogeneities in the slip surface geometry for the La Clapi`ere landslide. A study at lower spatial scale would have to take into account some mechanical considerations as the deforma-bility in order to explain the evolution of the slip surface, presented in this paper.
One major perspective of this study is to propose a sim-ple methodology in order to help in situ investigations of the subsurface. For example, suspicions of large heterogeneities in slip surface geometry can be used in order to well dis-tribute geophysical profiles or boreholes. Moreover, a quan-titative characterization of the slip surface is possible by de-veloping simple geometric models to image the slip surface and to evaluate its depth. Finally, other sites, with faster or lower displacements, must be tested in order to perform our methodology, particularly by improving the resolution of measurements.
Acknowledgements. This work is financially supported by CNES
(Centre National des Etudes Spatiales), the IMAGE SARL com-pany and the French INSU SAMOA project (French Ministry of Research). We acknowledge too Y. Guglielmi and the CETE (Centre des Etudes Techniques de l’Equipement) for providing EDM of the La Clapi`ere landslide.
Edited by: M. Jaboyedoff
Reviewed by: G. B. Crosta, Y. Guglielmi, and T. Lebourg
References
Baratoux, D., Delacourt, C., and Allemand, P.: High-resolution digital elevation models derived from Viking Orbiter images: Method and comparison with Mars Orbiter Laser Altimeter Data, J. Geophys. Res., 106, 32 927–32 941, 2001.
Berardino, P., Costantini, M., Franceschetti, G., Iodice, A., Pietran-era, L., and Rizzo, V.: Use of differential SAR interferometry in monitoring and modelling large slope instability at Maratea (Basilicata, Italy), Engineering Geology, 68, 31–51, 2003. Bigot-Cormier, F., Braucher, R., Guglielmi, Y., Bourl`es, D.L.,
Dubar, M. and Stephan, J.F.: Chronological constrains of the la Clapi`ere landslide (44◦15 N, 6◦56 E, France): geomorphology and cosmonucleides approaches, AGU-EGS-EGU First Joint As-sembly, Nice, 2003.
Bishop, K. M.: Determination of Translational Landslide Slip Sur-face Depth Using Balanced Cross Sections, Environmental & Engineering Geoscience, 2, 147–156, 1999.
Bogoslovski, V. A. and Ogilvy, A. A.: Geophysical methods for the investigation of landslides, Geophysics, 42, 3, 562–571, 1977.
436 B. Casson et al.: Remote sensing and characterisation of landslide slip surface
Cappa, F. Guglielmi, Y., Soukatchoff, V. M., Mudry, J., Bertrand, C., and Charmoille, A.: Hydromechanical modeling of a large moving rock slope inferred from slope levelling to spring long-term hydrochemical monitoring: example of the La Clapi`ere landslide (Southern Alps, France), J. Hydrol., 291, 67–90, 2004. Casson, B. : Apports de l’imagerie optique haute resolution pour l’´etude 3D des glissements de terrain, Universit´e Claude Bernard Lyon 1, 277, 2004.
Casson, B., Delacourt, C., Baratoux, D., and Allemand, P.: Sev-enteen years of the ”La Clapi`ere landslide evolution analysed from ortho-rectified aerial photographs, Engineering Geology, 68, 123–139, 2003.
Compagnon, F., Guglielmi, Y., Mudry, J., Follacci, J.-P., and Ivaldi, J.-P.: Chemical and isotopic natural tracing of seepage waters in an important landslide: example from La Clapi`ere landslide (Alpes-Maritimes, France), C. R. Acad. Sci. Paris, Earth & Plan-etary Sciences, 325, 565–570, 1997.
Cruden, D. M. and Varnes, D. J.: Landslide types and processes, in: Landslides: Investigation and Mitigation, edited by: Turner, A. K. and Schuster, R. L., Transportation Research Board, Special Report, 247, 36–75, 1996.
Delacourt, C., Allemand, P., Casson, B., and Vadon, H.: Veloc-ity field of the “La Clapi`ere” landslide measured by the correla-tion of aerial and QuickBird images, Geophys. Res. Lett., 31, 15, L15619, doi: 10.1029/2004GL020193, 2004.
Dikau, R., Brunsden, D., Schrott, L., and Ibsen, M.-L.: Landslide recognition: Identification, Movement and Causes, John Wiley and Sons Ltd, West Sussex, UK, 251, 1996.
Ehlert, K. W.: Origin of the mile-long valley located northerly of the ancient Portuguese Bend landslide, Paolo Verdes Peninsula, southern California, in: Landslides and Landslides Mitigation in Southern California, edited by: Ehlig, P. L., Guidebook and Vol-ume: Cordilleran Section of the Geological Society of America, 167–172, 1986.
Follacci, J.-P.: Les mouvements du versant de la Clapi`ere `a Saint-Etienne-de-Tin´ee (Alpes-maritimes), Bulletin de liaison du labo-ratoire des Ponts et Chauss´ees, 150–151, 39–54, 1987.
Follacci, J.-P.: Seize ans de surveillance du glissement de la Clapi`ere (Alpes-Maritimes), Bulletin des laboratoires des Ponts et Chauss´ees, 220, 35–51, 1999.
Follacci, J.-P., Guardia, P., and Ivaldi, J.-P.: Geodynamic framework of la Clapi`ere landslide (Maritime Alps, France), 5th Symposium international sur les glissements de terrain, 1323–1327, 1988a. Follacci, J.-P., Gastaud, J.-P., and Durville, J.-L.: Le point sur
l’´evolution des d´eplacements dans le glissement de la Clapi`ere (Alpes-Maritimes), Bulletin de liaison du laboratoire des Ponts et Chauss´ees, 158, 107–109, 1988b.
Fruneau, B., Achache, J., and Delacourt, C.: Observation and mod-elling of the Saint-Etienne-de-Tin´ee landslide using SAR inter-ferometry, Tectonophysics, 265, 181–190, 1996.
Gili, J. A., Corominas, J., and Rius, J.: Using Global Positioning System techniques in landslide monitoring, Engineering Geol-ogy, 55, 167—192, 2000.
Guglielmi, Y., Bertrand, C., Compagnon, F., Follacci, J.-P., and Mudry, J.: Acquisition of water chemistry in a mobile fissured basement massif: its role in the hydrogeological knowledge of the La Clapi`ere landslide (Mercantour massif, southern Alps, France), J. Hydrol, 229, 138–148, 2000.
Gunzburger, Y.: Apport de l’analyse de la fracturation et de la mod´elisation num´erique `a l’´etude du versant instable de La Clapi`ere (Saint-Etienne-de-Tin´ee, Alpes-Maritimes), rapport DEA PAE3S, Laboratoire Environnement, G´eom´ecanique,
Ou-vrages (LAEGO) – Ecole nationale Sup´erieure des mines de Nancy, 2001.
Gunzburger, Y. and Laumonier, B.: Origine tectonique du pli supportant le glissement de terrain de la Clapi`ere (Nord-Ouest du massif de l’Argentera-Mercantour, Alpes du Sud, France) d’apr`es l’analyse de la fracturation, C. R. G´eosciences, 334, 415– 422, 2002.
Hanssen, R. F.: Radar Interferometry: Data Interpretation and Error Analysis, Kluwer Academic Publishers, Dordrecht, 328, 2001. Hutchinson, J. N.: Methods of locating slip surfaces in landslides,
Bulletin of the Association of Engineering Geologists, 20, 235– 252, 1983.
Hutchinson, J. N.: Morphological and geotechnical parameters of landslides in relation to geology and hydrology, general report, in: Landslides, edited by: Bonnard, C., Proceedings of the 5th In-ternational Symposium on Landslides, Rotterdam, Netherlands, 1, 3–35, 1988.
Israil, M. and Pachauri, A. K.: Geophysical characterization of a landslide site in the Himalayan foothill region, Journal of Asian Earth Sciences, 22, 253–263, 2003.
K¨a¨ab, A.: Monitoring high-mountain terrain deformation from re-peated air- and spaceborne optical data: examples using digital aerial imagery and ASTER data, bISPRS Journal of Photogram-metry & Remote Sensing, 57, 39–52, 2002.
Kraus, K. and Waldh¨ausl, P.: Photogrammetry, Fundamentals and Standard Processes, Herm`es editor, Paris, 407, 1994.
Lebourg, T., Tric, E., Guglielmi, Y., Cappa, F., Charmoille, A., and Bouissou, S.: Geophysical survey to understand failure mech-anisms involved on Deep Seated Landslides, Geophysical Re-search Abstracts, European Geophysical Society, EGS-AGU-EUG Joint Assembly, Nice, 5, 01043, 2003.
Malet, J.-P., Maquaire, O., and Calais, E.: The use of Global Po-sitionning System techniques for the continuous monitoring of landslides: application to the Super-Sauze earthflow (Alpes-de-Haute-Provence, France), Geomorphology, 43, 33-54, 2002. Maquaire, O., Flageollet, J.-C., Malet, J.-P., Schumtz, M. , Weber,
D. , Klotz, S., Albouy, Y., Descloˆıtres, M., Dietrich, M., Gu´erin, R. and, Schott, J.J.: A multidisciplinary study for the knowl-edge the Super-sauze earthflow in Callovian-Oxfordian black marls ( Super-Sauze, Alpes-de-Hautes-Provence, France), Revue franc¸aise de g´eotechnique, 95–96, 15–32, 2001
Mauritsch, H. J., Seiberl, W., Arndt, R., R¨omer, A., Schneider-bauer, K., and Sendlhofer, G.: Geophysical investigations of large lanslides in the Carnic Region of southern Austria, Engi-neering Geology, 56, 373–388, 2000.
Mikhail, E., Bethel, J. S., and McGlone, J. C.: Introduction to Mod-ern Photogrammetry, Hardcover edition, New-York, 479, 2001 Mora, P., Baldi, P., Casula, G., Fabris, M., Ghirotti, M., Mazzini,
E., and Pesci, A.: Global Positioning Systems and digital pho-togrammetry for the monitoring of mass movements: application to the Ca’ di Malta landslide (northern Apennines, Italy), Engi-neering Geology, 68, 103–121, 2003.
Powers, P.S., Chiarle M., and Savage, W. Z.: A Digital Photogram-metric method for measuring horizontal surficial movements on the Slumgullion Earthflow, Hinsdale County, Colorado, Comput-ers & Geosciences, 22, 6, 651–663, 1996
Quenot, X: Etude du glissement de La Clapi`ere, mod´elisation du ph´enom`ene de rupture, rapport DEA PAE3S, Laboratoire En-vironnement, G´eom´ecanique, Ouvrages (LAEGO) – Ecole na-tionale Sup´erieure des mines de Nancy, 2000.
Rizzo, V.: GPS monitoring and new data on slope movements in the Maratea Valley (Potenza, Basilicata), Phys. Chem. Earth, 27,
1535–1544, 2002.
Scullin, C. M.: Subsurface exploration using bucket auger borings and down-hole geologic inspection, Bulletin of Engineering Ge-ology, 31, 91–105, 1994.
Serratrice, J.-F.: Glissement de la Clapi`ere. Comparaison des MNTs de 1970 `a 1997, Journ´ees de m´ecanique des Sols et des Roches des LPC, Laboratoires des Ponts et Chauss´ees, Nancy, 2001. Soukatchoff, V. M. and Guglielmi, Y.: Modeling by distinct
ele-ments of gravitational toppling mechanism. Application to the modeling of the landslide of la Clapi`ere (Saint-Etienne-de-Tin´ee, Alpes-Maritimes). Revue franc¸aise de g´eotechnique, 95– 96, 133–142, 2001.
Squarzoni, C. : Mesure des champs de d´eplacement et mod´elisation num´erique des glissements de terrain, th`ese de doctorat, Univer-sit´e Claude Bernard Lyon 1, 213, 2003.
Squarzoni, C., Delacourt, C., and Allemand, P.: Nine years of spa-tial and temporal evolution of the La Valette landslide observed by SAR interferometry, Engineering Geology, 68, 53–66, 2003.
Squarzoni, C., Delacourt, C., and Allemand, P.: Differential single-frequency GPS monitoring of the la Valette landslide (French Alps), Engineering Geology, 2005.
Vadon, H. and Massonnet, P.: Earthquake displacement fields mapped by very precise correlation, Complementarity with radar interferometry, IGARSS proc, 2002.
Van Westen, C. J., and Getahun, F. L.: Analysing the evolution of the Tessina landslide using aerial photographs and digital eleva-tion models, Geomorphology, 1347, 1–13, 2003.
Varnes, D. J.: Slope movements: type and processes, in: Landslides Analysis Control, edited by: Schuster, R. L. and Krisek, R. J., Transp. Res. Board., Special Report, 176, 11–33, 1978. Weber, D. and Herrmann, A.: Contribution de la photogramm´etrie
num´erique `a l’´etude spatio-temporelle de versants instables: l’exemple du glissement de terrain de Super-Sauze (Alpes-de-Hautes-Provence, France), Bulletin de la Soci´et´e G´eologique de France, 171, 6, 637–648, 2000.