HAL Id: hal-01685697
https://hal-univ-rennes1.archives-ouvertes.fr/hal-01685697
Submitted on 27 Apr 2018
HAL is a multi-disciplinary open access
archive for the deposit and dissemination of
sci-entific research documents, whether they are
pub-lished or not. The documents may come from
teaching and research institutions in France or
abroad, or from public or private research centers.
L’archive ouverte pluridisciplinaire HAL, est
destinée au dépôt et à la diffusion de documents
scientifiques de niveau recherche, publiés ou non,
émanant des établissements d’enseignement et de
recherche français ou étrangers, des laboratoires
publics ou privés.
Rotational spectrum of methoxyamine up to 480 GHz: a
laboratory study and astronomical search
L. Kolesnikova, B. Tercero, E. R. Alonso, J. -C. Guillemin, J. Cernicharo, J.
L. Alonso
To cite this version:
L. Kolesnikova, B. Tercero, E. R. Alonso, J. -C. Guillemin, J. Cernicharo, et al.. Rotational spectrum
of methoxyamine up to 480 GHz: a laboratory study and astronomical search. Astronomy and
Astro-physics - A&A, EDP Sciences, 2018, 609, pp.A24. �10.1051/0004-6361/201730744�. �hal-01685697�
DOI:10.1051/0004-6361/201730744 c ESO 2017
Astronomy
&
Astrophysics
Rotational spectrum of methoxyamine up to 480 GHz: a laboratory
study and astronomical search
?
L. Kolesniková
1, B. Tercero
2, E. R. Alonso
1, J.-C. Guillemin
3, J. Cernicharo
2, and J. L. Alonso
11 Grupo de Espectroscopia Molecular (GEM), Edificio Quifima, Área de Química-Física, Laboratorios de Espectroscopia y
Bioespectroscopia, Parque Científico UVa, Unidad Asociada CSIC, Universidad de Valladolid, 47011 Valladolid, Spain e-mail: lucie.kolesnikova@uva.es
2 Instituto de Ciencia de Materiales de Madrid, CSIC, C/ Sor Juana Inés de la Cruz 3, 28049 Cantoblanco, Spain 3 Institut des Sciences Chimiques de Rennes, École Nationale Supérieure de Chimie de Rennes, CNRS, UMR 6226,
11 Allée de Beaulieu, CS 50837, 35708 Rennes Cedex 7, France Received 7 March 2017/ Accepted 26 September 2017
ABSTRACT
Aims.Methoxyamine is a potential interstellar amine that has been predicted by gas-grain chemical models for the formation of complex molecules. The aim of this work is to provide direct experimental frequencies of its ground-vibrational state in the millimeter-and submillimeter-wave regions to achieve its detection in the interstellar medium.
Methods.Methoxyamine was chemically liberated from its hydrochloride salt, and its rotational spectrum was recorded at room tem-perature from 75 to 480 GHz using the millimeter-wave spectrometer in Valladolid. Many observed transitions revealed A−E splitting caused by the internal rotation of the methyl group, which had to be treated with specific internal rotation codes.
Results.Over 400 lines were newly assigned for the most stable conformer of methoxyamine, and a precise set of spectroscopic con-stants was obtained. Spectral features of methoxyamine were then searched for in the Orion KL, Sgr B2, B1-b, and TMC-1 molecular clouds. Upper limits to the column density of methoxyamine were derived.
Key words. astrochemistry – ISM: molecules – line: identification – astronomical databases: miscellaneous
1. Introduction
Molecular line surveys of massive star-forming regions such as the Orion KL hot core or the Galactic-center hot cores Sgr B2(N) and (M) have shown very complex chemistry through the detection of a large variety of molecules (Cernicharo et al. 2016; Belloche et al. 2013). Of these molecules, amines have received particular attention because they participate in the synthesis of amino acids, the basic units of proteins. Al-though the original interstellar detection of glycine (Kuan et al. 2003), the simplest amino acid, has been called into doubt (Snyder et al. 2005;Jones et al. 2007;Cunningham et al. 2007), the discovery of glycine in dust samples from comet Wild 2 (Elsila et al. 2009) and in the coma of 67P /Churyumov-Gerasimenko (Altwegg et al. 2016) shows that these types of biomolecules can be formed under cosmic conditions. In addi-tion, several laboratory experiments of the interstellar icy grains analogs have demonstrated that formation of diverse amines and amino acids in the interstellar medium (ISM) is possible (Bernstein et al. 2002;Caro et al. 2002;Zheng & Kaiser 2010;
Kim & Kaiser 2011). Spectroscopic characterization and subse-quent search for chemically similar species or their possible pre-cursors thus create an important target for astrochemistry.
To the best of our knowledge, only a few molecules con-taining the −NH2 group have been confidently detected in the
ISM: formamide (NH2CHO; Rubin et al. 1971), methylamine
? Table 3 is only available at the CDS via anonymous ftp to
cdsarc.u-strasbg.fr (130.79.128.5) or via
http://cdsarc.u-strasbg.fr/viz-bin/qcat?J/A+A/609/A24
(CH3NH2; Kaifu et al. 1974; Fourikis et al. 1974), cyanamide
(NH2CN; Turner et al. 1975), acetamide (CH3CONH2; Hollis et al. 2006), and aminoacetonitrile (NH2CH2CN; Belloche et al. 2008). Urea ((NH2)2CO), a molecule with two
−NH2groups, has been detected only tentatively (Remijan et al. 2014). Of these detected molecules, only two belong to the category of amines; nevertheless, the gas-grain chemical model for the formation of complex molecules predicts that more interstellar amines, such as methoxyamine (CH3ONH2),
hy-droxylamine (NH2OH) or hydroxymethylamine (HOCH2NH2),
can be generated with significant abundances (Garrod et al. 2008). The interstellar formation of methoxyamine is proposed through a direct reaction between CH3O and NH2 radicals on
the grains at temperatures around 50 K (Garrod et al. 2008). It is predicted to remain on the grains until the temperature of ∼100 K is reached, when it starts to desorb into the gas phase. The peak gas-phase abundance of methoxyamine in the star-forming regions is then predicted at the approximate temperature of 120 K (Garrod et al. 2008).
While hydroxylamine has been actively searched for toward several interstellar sources (Pulliam et al. 2012; McGuire et al. 2015), no such trials have been conducted for methoxyamine, probably because we have only insufficient laboratory informa-tion. The most stable conformation of methoxyamine has the −NH2group in the trans-position with respect to the −CH3group
(see Fig.1) and was studied in the gas phase from 8 to 39.5 GHz by Stark-modulation spectroscopy (Fong et al. 1974). Since the rotational constants were obtained from the least-squares fit of four hyperfine-free a-type R-branch transitions with J00 and
A&A 609, A24 (2018)
Fig. 1.Equilibrium Cssymmetry structure of the most stable form of
methoxyamine.
K00a ≤ 1, they do not provide accurate predictions for the
ro-tational spectrum at higher J and Ka values. At the 67%
con-fidence level, uncertainties of up to 3, 8, and 13 MHz can be estimated for a-type R-branch transitions with J00 = 6, 12, and 18, respectively. These transitions at the temperature of 120 K fall exactly into the range of millimeter-wave surveys that are provided by several astrophysical instruments, as shown in Fig.2, and with these uncertainties, it is not possible to confi-dently search for methoxyamine. Lack of the accurate laboratory millimeter-wave data thus prompted new spectroscopic studies of methoxyamine over the frequency range from 75 to 480 GHz. More than 400 spectral features were newly assigned, which sig-nificantly extended the range of J and Kaquantum numbers, and
the features were used to search for methoxyamine in Orion KL and Sgr B2 molecular clouds.
2. Experimental details
Methoxyamine is a colorless liquid with a boiling point at 48.1◦C (Bissot et al. 1957), and it was synthesized by reaction of liquid 1,8-diazabicyclo[5.4.0]undec-7-ene injected in excess (1.5 equivalent) through a septum in a two-necked flask contain-ing solid methoxyamine hydrochloride and fitted on a vacuum line. The reaction product was collected in a U-tube trap cooled by liquid nitrogen and was used without any further purification. Methoxyamine was thus obtained in a 70% yield.
The room-temperature rotational spectrum was measured from 75 to 480 GHz using the millimeter-wave spectrometer at the University of Valladolid, which generates the millimeter-wave radiation by multiplying the fundamental synthesizer fre-quency (≤20 GHz) by amplifier-multiplier chains (multiplication factors of 6, 9, 12, 18, and 24 in this case). A detailed description of the experimental setup has been given elsewhere (Daly et al. 2014). The synthesizer output was frequency modulated at a modulation frequency of 10.2 kHz and a modulation depth of between 10 and 30 kHz. After passing the radiation through the free-space cell (see the single- and double-pass configurations in
Daly et al. 2014), the signal was detected by zero-bias detectors and was demodulated by a lock-in amplifier tuned to twice the modulation frequency. This demodulation process gives rise to a shape of the lines that approximates the second derivative of a Gaussian function. The experimental uncertainty of the isolated symmetric lines is estimated to be better than 50 kHz.
Fig. 2.Predicted rotational spectrum of methoxyamine at the
temper-ature of 120 K and its overlap with approximate frequency coverage of several astrophysical facilities (IRAM: Institut de Radioastronomie Millimétrique; HERSCHEL/HIFI: Herschel-Heterodyne Instrument for the Far-Infrared; GBT: Green Bank Telescope; APEX: Atacama Pathfinder Experiment telescope; ALMA: Atacama Large Millime-ter/submillimeter Array; ARO: Arizona Radio Observatory; JCMT: James Clerk MaxwellTelescope; CARMA: Combined Array for Re-search in Millimeter-wave Astronomy). The frequency region studied in this work is highlighted in gray.
3. Rotational spectra analysis
Supporting ab initio calculations were performed at the begin-ning of the analysis using the Gaussian09 package (Frisch et al. 2009). The Møller–Plesset second-order method (MP2) and the aug-cc-pVTZ basis set were used to geometrically optimize the structure of methoxyamine, to estimate electric dipole moment components along the principal axis, and to obtain the infor-mation on equilibrium quartic centrifugal distortion constants. Methoxyamine possesses a plane of symmetry, and its optimized geometry is illustrated in Fig.1(a similar geometry has been cal-culated byHays & Widicus Weaver 2013). Equilibrium spectro-scopic constants are given in the last column of Table1. The cal-culated dipole moment components of |µa|= 0.5 D, |µb|= 0.1 D,
and |µc|= 0.0 D are in agreement with the fact that only a-type
transitions were observed in the previous microwave work of
Fong et al.(1974).
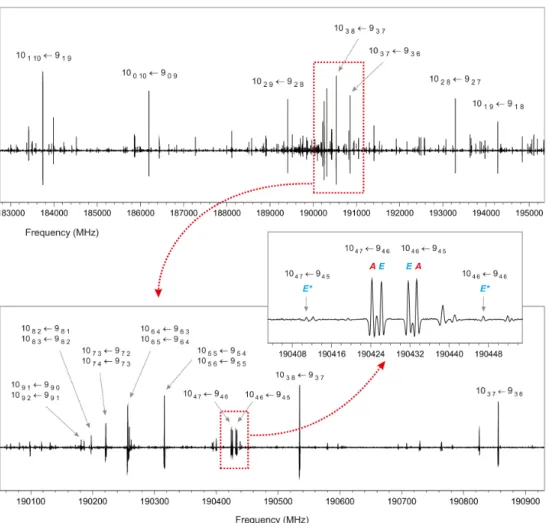
Groups of a-type R-branch transitions repeating approxi-mately every 19 GHz were easily identified in the broadband rotational spectrum. Figure 3 shows one of these groups for J0 ← J00 = 10 ← 9 with typical arrangement of individ-ual Ka transitions common for a near-prolate asymmetric top
(κ = −0.93 in this case). A few a-type transitions with Ka = 1,
3, 4, 5, and 6 were found as doublets situated closely around the semi-rigid rotor pattern. This doublet structure originates from internal rotation of the methyl group and agrees with the rela-tively high barrier to internal rotation of V3 = 873 ± 15 cm−1
determined byFong et al.(1974). After we assigned the a-type transitions, we attempted to locate b-type transitions, although the value of µb predicted by ab initio calculations is very low.
Surprisingly, many b-type R-branch and Q-branch transitions were successfully identified. While only a few a-type transitions were found to be subject to the A−E splitting, almost all b-type transitions appeared as doublets, and the separation of the two lines of the doublets was less than 10 MHz. Additionally, weak forbidden x-type and c-type transitions between the E-levels (Woods 1966), which borrow intensity from allowed a-type and b-type transitions, respectively, could occasionally be observed
Fig. 3.Portion of the room-temperature millimeter-wave spectrum of methoxyamine showing a group of a-type R-branch transitions for J0 ←
J00= 10 ← 9. The asymmetry splitting for the K
a = 1 transitions in this case reaches almost 11 GHz and decreases rapidly with increasing Ka
until it is completely unresolved for Ka ≥ 5. Small internal rotation A−E splitting can be seen for two Ka = 4 rotational transitions. Forbidden
x-type transitions (∆Ka = 0, ±2, ..., ∆Kc= 0, ±2, ...) that gain intensity through the so-called intensity borrowing from allowed a-type transitions
between the same pairs of levels are situated outside the A lines and are labeled with an E∗.
(see the middle part of Fig.3) in situations where the asymme-try splitting became comparable in magnitude with the internal rotation splitting (Herschbach & Swalen 1958; Plummer et al. 1987). More than 400 distinct frequency lines were finally as-signed to the ground torsional state of methoxyamine. More than 100 lines correspond to A-symmetry species, more than 100 lines to E-symmetry species, and over 200 lines reveal unresolved A−E splitting. The14N nuclear quadrupole hyperfine structure could be partly resolved for transitions where the value of Ka
ap-proaches the value of J and corresponding transitions were not taken into consideration. These transitions are expected to be weak and are not interesting for a possible detection in the ISM. Initially, A and E transitions were analyzed separately using the SPFIT/SPCAT programs (Pickett 1991). The effective rota-tional and centrifugal distortion constants for the A sublevels were obtained by fitting the standard Watson S -reduced Hamiltonian in Ir representation (Watson 1977). In determin-ing the E sublevel constants, Watson’s semirigid Hamiltonian was extended by the linear terms DaJaand DbJb(Lin & Swalen 1959;Demaison et al. 2010). Finally, only Daparameter and its
centrifugal distortion corrections were determinable. The results of both fits are collected in the first two columns of Table1. The same sets of A and E transitions were subsequently fitted using the XIAM program (Hartwig & Dreizler 1996) in order to obtain the barrier to the internal rotation V3 of the methyl group. As
shown in Table1, its value compares well with that from the mi-crowave study ofFong et al.(1974). Although the effective fits for the two internal rotation sublevels as well as the XIAM fit are able to reproduce the A−E split transitions near the experimental accuracy, it has to be noted that around 50% from the observed lines were not included in these fits because of the unresolved A−Esplitting. Therefore, another fit using the ERHAM program (Groner 1997), which allows proper weighting of blended transi-tions, was performed in this work. In this way, it was possible to encompass all the measured a-type transitions with J00 = 3−24
and Ka00 = 0−13 and b-type transitions with J00 = 4−35 and K00
a = 0−5. This coverage of the rotational quantum numbers
ex-tends well beyond the absorption maximum at 120 K (see Fig.2), so that the lines most likely to be detected toward the interstellar clouds are now well characterized. Table1presents the resulting set of 18 adjusted spectroscopic parameters, while the experi-mental frequencies are collected in Table 3. Among the floated parameters are rotational constants, centrifugal distortion con-stants up to the sixth order, internal rotation parameters ρ and β, and the first energy tunneling parameter ε1. Because about 50%
of the assigned lines belong to the b-type transitions, which were not found in the previous work ofFong et al.(1974), the value of the A rotational constant has been significantly improved (see Table1). The derived spectroscopic constants are in good agree-ment with those predicted by ab initio calculations.
A&A 609, A24 (2018) Table 1. Ground-state spectroscopic constants of methoxyamine.
SPFIT XIAM ERHAM
Aspeciesa Especiesa A+ Eb A+ Ec Fong et al.(1974) Ab initiod
A/ MHz 42 487.2256 (67)e 42 485.5971 (51) 42 486.1426 (34) 42 486.1402 (30) 42 488 (150) 42 457 B/ MHz 10 049.6972 (13) 10 049.6652 (11) 10 051.6212 (33) 10 049.67650 (39) 10 049.59 (3) 10 137 C/ MHz 8962.8910 (14) 8962.8895 (12) 8960.9454 (33) 8962.89087 (32) 8962.85 (3) 9038 DJ/ kHz 9.7862 (55) 9.7854 (48) 9.7862 (25) 9.78791 (72) ... 9.72 DJK/ kHz 3.575 (20) 1.967 (17) 2.492 (10) 2.4821 (46) ... 2.66 DK/ kHz 471.46 (38) 443.32 (29) 452.94 (18) 452.89 (14) ... 443.97 d1/ kHz −1.5834 (15) −1.5876 (11) −1.59121 (76) −1.58560 (41) ... −1.57 d2/ kHz 0.33027 (33) 0.33762 (29) 0.33992 (19) 0.33504 (12) ... 0.34 HJ/ Hz 0.0200 (78) 0.0168 (67) 0.0178 (40) 0.02053 (69) ... ... HJK/ Hz −0.163 (35) −0.132 (26) −0.155 (17) −0.1751 (35) ... ... HK J/ Hz 1.88 (88) −17.77 (70) −11.23 (43) −11.001 (27) ... ... HK/ Hz 124.4 (92) −19.9 (73) 32.1(44) 29.4 (23) ... ... h1/ Hz 0.0030 (15) 0.0091 (11) 0.00622 (74) 0.00572 (35) ... ... h2/ Hz −0.0039 (11) −0.00786 (87) −0.00625 (55) −0.00571(15) ... ... h3/ Hz −0.00153 (33) −0.00181 (26) −0.00191 (17) −0.001988 (34) ... ... Da/ MHz ... −4.074 (35) ... ... ... ... DJ a/ MHz ... 0.001595 (56) ... ... ... ... DK a / MHz ... 0.1711 (27) ... ... ... ... DKK a / MHz ... −0.002096 (61) ... ... ... ... ρ / Unitless ... ... 0.23864 (19) 0.23869 (15) ... 0.23 β /◦ ... ... 8.256 (13) 8.322 (12) ... 9.5 ε1/ MHz ... ... ... −4.7796 (53) ... ... V3/ cm−1 ... ... 855.66 (52) ... 873 (15)f ... σfitgkHz 49 35 33 46 ... ... Nh 119 108 227 434 4 ...
Notes. (a)These constants are contaminated by contribution of the internal rotation. Unperturbed values that can be compared with those from
the global A+ E fits or from ab initio calculations can be obtained, for example, using the approximate expression (XA+ 2XE)/3 (Gordy & Cook 1984), where X substitutes the rotational and centrifugal distortion constants.(b)Additionally derived internal rotation parameters: angles between
the internal rotation axis i and the principal axis∠(i, a) = 31.522 (42)◦
,∠(i, b) = 58.478 (42)◦
,∠(i, c) = 90◦
(fixed value), moment of inertia of the methyl top Iα= 3.2956 (40) uÅ2.(c)Additionally derived internal rotation parameters: torsional energy difference ∆E
E−A= 14.339 (16) MHz,
∠(i, a) = 31.735 (38)◦
,∠(i, b) = 58.265 (38)◦
,∠(i, c) = 90◦
(fixed value), Iα= 3.3032 (18) uÅ2, reduced rotational constant F= 6.5347 (27) cm−1. (d)Equilibrium values at the MP2/aug-cc-pVTZ level of the theory.(e)The numbers in parentheses are 1σ uncertainties (67% confidence level)
in units of the last decimal digit.( f )Average value obtained from three isotopic species.(g)Root mean square deviation of the fit.(h)Number of
distinct frequency-fitted lines.
4. Radioastronomical observations
Methoxyamine is a complex organic molecule (COM; carbon-based molecular species with more than six atoms, see, e.g.,
Herbst & van Dishoeck 2009) containing hydrogen, carbon, oxygen, and nitrogen together. COMs have mostly been de-tected toward hot cores of high-mass star-forming regions (Belloche et al. 2009, 2014; Tercero et al. 2013, 2015) and the inner regions of low-mass protostars, that is, of hot corinos (Cazaux et al. 2003; Jørgensen et al. 2016). Neverthe-less, N-bearing compounds are typically found in the for-mer regions, whereas hot corinos are richer in O-bearing molecules like methyl formate (CH3OCOH). Three COMs
have been identified in the ISM so far that contain H, C, O, and N: NH2CHO, CH3NCO, and CH3CONH2 (see, e.g.,
the CDMS database1). Although formamide (NH
2CHO) and
methyl isocyanate (CH3NCO) have both been detected in hot
corinos (Martín-Doménech et al. 2017; Ligterink et al. 2017;
Coutens et al. 2016), these three species together have only been detected in the hot core of Sgr B2 at the Galac-tic center (Rubin et al. 1971; Halfen et al. 2015; Hollis et al. 2006; Belloche et al. 2017) and in Orion KL (Turner 1991;
Motiyenko et al. 2012; Cernicharo et al. 2016), the nearest hot core at 414 ± 7 pc (Menten et al. 2007). In addition, CH3NHCHO has recently been tentatively detected in Sgr B2
1 https://www.astro.uni-koeln.de/cdms/molecules
(Belloche et al. 2017). On the other hand, another possible re-lated species of methoxyamine, methylamine CH3NH2, has been
detected in the two high-mass star-forming regions mentioned above (Kaifu et al. 1974;Cernicharo et al. 2016). Therefore, we focused the search for CH3ONH2 toward these high-mass
star-forming regions.
Orion KL: two sets of data were used to seek for methoxyamine in this region. On the one hand, we explored the wide frequency band (80−306 GHz) of the IRAM 30 m survey of Orion KL (Tercero et al. 2010,2015). On the other hand, we focused the search on different positions of this complex source using the ALMA Science Verification (SV) data that cover frequencies be-tween 213.7 and 246.6 GHz.Cernicharo et al. (2016) provided the spatial distribution of several molecular species in the source. The rather similar spatial distribution of the three more abundant species containing N, O, H, and C simultaneously is remarkable: HNCO, NH2CHO, and CH3NCO. Moreover, these authors
pro-vided column densities for CH3NH2 and CH3CONH2. To
de-termine the suitable position within the source for the search for methoxyamine, we created maps of the spatial distribution of methylamine using two lines that were free of blending that arise in the ALMA SV band (see Fig. 4). Unfortunately, this was not possible for acetamide, CH3CONH2, because of the
large uncertainty of the rest frequencies at the ALMA SV fre-quency range (see Halfen et al. 2011, and references therein).
Fig. 4. Spatial distribution of CH3NH2 in Orion KL. The data
are from ALMA SV observations. The interval of contours in black is 0.03 Jy beam−1km s−1, and the minimum contour is
0.03 Jy beam−1km s−1. Negative flux is represented by the blue dashed
contours: the minimum contour is −0.05 Jy beam−1km s−1and the
in-terval is −0.03 Jy beam−1km s−1. The cyan ellipse in the top left corner
of the maps represents the synthetic beam. The black triangle shows source I, the black circle shows source n, the cross represents the com-pact ridge, and the cyan unfilled square and triangle indicate Positions A and B (see Sect.4).
The main emission peaks for all the species discussed above co-incide with a component in the middle of the hot core clumpy structure (see, e.g., Favre et al. 2011b;Tercero et al. 2015) and the millimeter continuum source MM4 (Wu et al. 2014). These positions are described inCernicharo et al.(2016) as positions A and B. We therefore concentrated on these two components and on the compact ridge (rich in CH3−O bearing molecules, see,
e.g., Favre et al. 2011a; Brouillet et al. 2013; López et al., in prep.). We used MADEX (Cernicharo 2012) to implement the spectroscopy of CH3ONH2 provided in the Col. 4 of Table 1
and to derive the synthetic spectrum according to the physical parameters shown in Table2. We did not detect methoxyamine above the detection limit of the data, hence only upper limits to the column density could be derived.
Sgr B2: we also searched for CH3ONH2 in public data
avail-able for Sgr B2. We did not find this species above the detection limit of the data, either in the PRIMOS survey2
(Neill et al. 2012) or in the IRAM 30 m data at 3 mm pro-vided by Belloche et al.(2013). To estimate upper limits to
2 The 100 m Green Bank Telescope (GBT) PRebiotic Interstellar
MOlecule Survey (PRIMOS) covers a frequency band between 7 and 50 GHz. Access to the entire PRIMOS data set, specifics on the observ-ing strategy, and overall frequency coverage information is available at
http://www.cv.nrao.edu/~aremijan/PRIMOS/
Fig. 5.Lines partially free of blending of CH3ONH2 in Sgr B2(N) at
3 mm. The observed data (black histogram spectrum) and total model of the source (green curve) are taken fromBelloche et al.(2013). The synthetic spectrum for methoxyamine corresponding to the upper limit reported in Table2is given by the red line. A vLSR of+64.0 km s−1 is
assumed.
the CH3ONH2 column density in the region, we adopted the
physical parameters derived by Belloche et al. (2013) for for-mamide (see Table2). Figure5 shows the model provided by MADEX (red line) together with the IRAM 30 m data of
A&A 609, A24 (2018) Table 2. Physical parameters of the considered cloud cores.
Source Coordinates HPBW† Frequencies†† vLSR ∆vFWHM dsou Trot N(CH3ONH2)
J2000.0 (00) GHz (km s−1) (km s−1) (00) (K) ×1015(cm−2) Orion KL α = 5h35m14.s5 30–8 80–307 8.0 3.0 10 150 ≤(1.0 ± 0.3) (IRAM 30 m) δ = −05◦22030.000 Orion KL α = 05h35m14.s5 ∼1.9 × 1.4 213.7–246.7 8.0 3.0 3.0 150 ≤(3.0 ± 1.0) (ALMA SV) δ = −05◦22032.005 Hot core Orion KL α = 05h35m14.s1 ∼1.9 × 1.4 213.7–246.7 7.5 2.0 3.0 100 ≤(2.0 ± 0.6) (ALMA SV) δ = −05◦22036.009 Compact ridge Orion KL α = 05h35m14.s2 ∼1.9 × 1.4 213.7–246.7 8.0 3.0 3.0 150 ≤(2.0 ± 0.6) (ALMA SV) δ = −05◦22031.001 5.0 3.0 3.0 150 ≤(2.0 ± 0.6) MM4 Sgr B2 (IRAM 30 m) 30–21 80–115.5 63 7.0 2.4 180 ≤(1000 ± 60) α = 17h47m20.s0 73 7.0 1.4 180 ≤(1000 ± 60) δ = −28◦22019.000 83 8.0 60 2.7 ≤(2.0 ± 0.6) (GBT 100 m) 80–15 7–50 α = 17h47m19.s8 δ = −28◦22017.000 B1-b α = 03h33m20.s8 30–21 80–115.5 6.7 0.7 60 12 ≤(0.0020 ± 0.0006) (IRAM 30 m) δ = 31◦07034.000 TMC-1 α = 04h41m41.s88 30–21 80–115.5 6.0 0.7 60 10 ≤(0.0020 ± 0.0006) (IRAM 30 m) δ = 25◦41027.000
Notes.(†)Half-power beam width (HPBW) for observations with single-dish telescopes (IRAM 30 m and GBT 100 m) and synthetic beam for the
ALMA SV observations.(††)Range of frequencies considered in the analysis.
Sgr B2(N). Interestingly, this model is consistent with the lack of methoxyamine lines above the detection limit of the PRIMOS data.
Although we cannot claim detection, some U lines that are partially free of blending in the 30 m data agree with the modeled spectrum of this species. In addition, according to this model, we did not find missing lines. Nevertheless, this is not a strong constraint because most of the CH3ONH2lines are fully blended
with more abundant species in these data.
Finally, we used the data presented in Cernicharo et al.
(2012) to derived upper limits to the methoxyamine column den-sity in dark clouds and at different evolutionary stages (B1-b and TMC-1 clouds; see Table2).
5. Discussion
To compare the results for the search for methoxyamine to the chemical model predictions provided byGarrod et al.(2008), we derived upper limits to the molecular abundance of this species in the hot core of Orion KL and Sgr B2(N).
Tercero et al. (2010) obtained a source-averaged N(H2) of
4.2 × 1023cm−2 for the hot core of Orion KL by means of the
C18O column density, assuming that the CO/H
2abundance ratio
is roughly constant (2 × 10⁻⁴ in warm regions) and adopting a source diameter of 1000for the hot core. To obtain a value for the
molecular abundance, we also have to assume that the H2column
density spatially coincides with the emission from the species considered. We derived an upper limit to the CH3ONH2
abun-dance of 2 × 10⁻⁹ using the upper limit for the column density obtained for Orion KL with the IRAM 30 m data. A large uncer-tainty should be associated with this value (at least a factor of 2) because of the mentioned assumptions.
On the other hand,Belloche et al.(2008) derived an N(H2)
of 1.3 × 1025cm−2in the inner region (200) of Sgr B2(N) using
the continuum emission detected with the Plateau de Bure Interferometer (PdBI) and assuming that this continuum emis-sion at 3.7 mm is dominated by thermal dust emisemis-sion (optically thin and a dust temperature of 100 K). Further assumptions re-lated to the dust mass opacity and the dust emissivity exponent have to be made to obtain this N(H2) value (seeBelloche et al. 2008, for details). We derive an upper limit to the CH3ONH2
abundance of (7−8) × 10−8 using the upper limit for the
col-umn density obtained for the 63 km s−1component of Sgr B2(N). Once again, an uncertainty of at least a factor of 2 is associated with this value (Belloche et al. 2008).
LikeGarrod et al.(2008), we note a reasonable match in the comparison of the derived upper limit abundances (and the as-sumed rotational temperatures) and the results of the “reduced ice composition” chemical model provided by these authors. In this model, the initial ice composition (standard) was adjusted to agree with infrared observations of protostellar envelopes, reducing the amount of the ices available for primary-radical production (seeGarrod et al. 2008, for details). Abundances of methoxyamine in the fast (5 × 10⁴ yr) and slow (1 × 10⁶yr) warm-up timescales are 3.7 × 10⁻⁹ and 6.4 × 10⁻⁸, respectively (the rotational temperature derived is around 120 K in both mod-els). These timescales are identified with high- and low-mass star formation, respectively (Garrod et al. 2008). It is worth noting thatAikawa et al.(2008) proposed a different relation between mass and warm-up timescale. They suggested that the warm-up timescale is dependent on the ratio of the size of the warm re-gion to the infall speed, rather than on the overall speed of star formation. The abundances predicted by the model are on the same order (within the uncertainties) as the upper limits derived observationally. However, because we study two high-mass star-forming regions, these differences may indicate different initial ice compositions and/or evolutionary stages.
To check these results and to avoid the large uncertainties introduced by the estimation of the CH3ONH2 abundances, we
also compared the observed and predicted NH2CHO/CH3ONH2
abundance ratios. The NH2CHO column density has been
de-rived byMotiyenko et al.(2012) andBelloche et al.(2013) for Orion KL and Sgr B2, respectively, using similar physical pa-rameters and the same observational data (IRAM 30 m data) as those used in this work to derive the CH3ONH2column density.
The derived lower limit ratios are ≥0.6 and ≥1.35 for Orion KL and the 63 km s−1 component of Sgr B2. The predicted results provided by the “reduced ice composition” chemical model of
Garrod et al.(2008) are 27, 12, and 2 for the fast, medium, and slow warm-up timescales. The predictions of all three models are consistent with the derived lower limit ratios. Hence, by means of these ratios and according to this model, we cannot constraint the relation between mass and warm-up timescale.
6. Conclusion
The rotational spectrum of methoxyamine has been recorded from 75 to 480 GHz and over 400 lines were newly assigned for the most stable conformer. Methoxyamine has not been identi-fied above the detection limit of various sets of data of the well-known high-mass star-forming regions Orion KL and Sgr B2. Nevertheless, the upper limits to the methoxyamine abundance in these regions agree with the CH3ONH2 abundances derived
in chemical models. This suggests a possible positive detection of methoxyamine in the near future using high-sensitivity data of hot cores and hot corinos and the accurate spectroscopic data of this work.
Acknowledgements. This paper makes use of the following ALMA data: ADS/JAO.ALMA#2011.0.00009.SV. ALMA is a partnership of ESO (represent-ing its member states), NSF (USA), and NINS (Japan) with NRC (Canada), NSC, and ASIAA (Taiwan), and KASI (Republic of Korea), in cooperation with the Republic of Chile. The Joint ALMA Observatory is operated by ESO, AUI/NRAO, and NAOJ. This work was also based on observations carried out with the IRAM 30-m telescope. IRAM is supported by INSU/CNRS (France), MPG (Germany), and IGN (Spain). The research leading to these results has re-ceived funding from the European Research Council under the European Union’s Seventh Framework Programme (FP/2007–2013)/ERC-2013-SyG, Grant Agree-ment No. 610256 NANOCOSMOS, Ministerio de Ciencia e Innovación (Grants CTQ2013-40717-P, AYA2012-32032, and Consolider-Ingenio 2010 CSD2009-00038 program “ASTROMOL”) and Junta de Castilla y León (Grants VA070A08 and VA175U13). J.-C.G. and J.C. thank the ANR-13-BS05-0008 IMOLABS. J.-C.G. thanks the Program PCMI (INSU-CNRS) and the Centre National d’Études Spatiales (CNES) for funding support. E.R.A. thanks the Ministerio de Ciencia e Innovación for FPI grant (BES-2014-067776).
References
Aikawa, Y., Wakelam, V., Garrod, R. T., & Herbst, E. 2008,ApJ, 674, 984
Altwegg, K., Balsiger, H., Bar-Nun, A., et al. 2016, Sci. Adv., 2 Belloche, A., Menten, K. M., Comito, C., et al. 2008,A&A, 482, 179
Belloche, A., Garrod, R. T., Müller, H. S. P., et al. 2009,A&A, 499, 215
Belloche, A., Müller, H. S. P., Menten, K. M., Schilke, P., & Comito, C. 2013,
A&A, 559, A47
Belloche, A., Garrod, R. T., Müller, H. S. P., & Menten, K. M. 2014,Science, 345, 1584
Belloche, A., Meshcheryakov, A. A., Garrod, R. T., et al. 2017,A&A, 601, A49
Bernstein, M. P., Dworkin, J. P., Sandford, S. A., Cooper, G. W., & Allamandola, L. J. 2002,Nature, 416, 401
Bissot, T. C., Parry, R. W., & Campbell, D. H. 1957,J. Am. Chem. Soc., 79, 796
Brouillet, N., Despois, D., Baudry, A., et al. 2013,A&A, 550, A46
Caro, G. M., Meierhenrich, U., Schutte, W., et al. 2002,Nature, 416, 403
Cazaux, S., Tielens, A. G. G. M., Ceccarelli, C., et al. 2003,ApJ, 593, L51
Cernicharo, J. 2012, in ECLA-2011: Proc. of the European Conf. on Laboratory Astrophysics, Laboratory Astrophysics and Astrochemistry in the Herschel/ALMA Era, 58, 251
Cernicharo, J., Marcelino, N., Roueff, E., et al. 2012,ApJ, 759, L43
Cernicharo, J., Kisiel, Z., Tercero, B., et al. 2016,A&A, 587, L4
Coutens, A., Jørgensen, J. K., van der Wiel, M. H. D., et al. 2016,A&A, 590, L6
Cunningham, M. R., Jones, P. A., Godfrey, P. D., et al. 2007,MNRAS, 376, 1201
Daly, A., Kolesniková, L., Mata, S., & Alonso, J. 2014,J. Mol. Spectr., 306, 11
Demaison, J., Margulès, L., Kleiner, I., & Császár, A. 2010,J. Mol. Spectr., 259, 70
Elsila, J. E., Glavin, D. P., & Dworkin, J. P. 2009,Meteor. Planet. Sci., 44, 1323
Favre, C., Despois, D., Brouillet, N., et al. 2011a,A&A, 532, A32
Favre, C., Wootten, H. A., Remijan, A. J., et al. 2011b,ApJ, 739, L12
Fong, M. Y., Johnson, L. J., & Harmony, M. D. 1974,J. Mol. Spectr., 53, 45
Fourikis, N., Takagi, K., & Morimoto, M. 1974,ApJ, 191, L139
Frisch, M. J., Trucks, G. W., Schlegel, H. B., et al. 2009, Gaussian 09 Revision E.01 (Wallingford CT: Gaussian Inc.)
Garrod, R. T., Weaver, S. L. W., & Herbst, E. 2008,ApJ, 682, 283
Gordy, W., & Cook, R. L. 1984, Microwave molecular spectra (New York: Wiley Interscience)
Groner, P. 1997,J. Chem. Phys., 107, 4483
Halfen, D. T., Ilyushin, V., & Ziurys, L. M. 2011,ApJ, 743, 60
Halfen, D. T., Ilyushin, V. V., & Ziurys, L. M. 2015,ApJ, 812, L5
Hartwig, H., & Dreizler, H. 1996,Z. Naturforsch. A, 51, 923
Hays, B. M., & Widicus Weaver, S. L. 2013,J. Phys. Chem. A, 117, 7142
Herbst, E., & van Dishoeck, E. F. 2009,Ann. Rev. Astron. Astr., 47, 427
Herschbach, D. R., & Swalen, J. D. 1958,J. Chem. Phys., 29, 761
Hollis, J. M., Lovas, F. J., Remijan, A. J., et al. 2006,ApJ, 643, L25
Jones, P. A., Cunningham, M. R., Godfrey, P. D., & Cragg, D. M. 2007,MNRAS, 374, 579
Jørgensen, J. K., van der Wiel, M. H. D., Coutens, A., et al. 2016,A&A, 595, A117
Kaifu, N., Morimoto, M., Nagane, K., et al. 1974,ApJ, 191, L135
Kim, Y. S., & Kaiser, R. I. 2011,ApJ, 729, 68
Kuan, Y.-J., Charnley, S. B., Huang, H.-C., Tseng, W.-L., & Kisiel, Z. 2003,ApJ, 593, 848
Ligterink, N. F. W., Coutens, A., Kofman, V., et al. 2017,MNRAS, 469, 2219
Lin, C. C., & Swalen, J. D. 1959,Rev. Mod. Phys., 31, 841
Martín-Doménech, R., Rivilla, V. M., Jiménez-Serra, I., et al. 2017,MNRAS, 469, 2230
McGuire, B. A., Carroll, P. B., Dollhopf, N. M., et al. 2015,ApJ, 812, 76
Menten, K. M., Reid, M. J., Forbrich, J., & Brunthaler, A. 2007,A&A, 474, 515
Motiyenko, R. A., Tercero, B., Cernicharo, J., & Margulès, L. 2012,A&A, 548, A71
Neill, J. L., Muckle, M. T., Zaleski, D. P., et al. 2012,ApJ, 755, 153
Pickett, H. M. 1991,J. Mol. Spectr., 148, 371
Plummer, G. M., Herbst, E., & De Lucia, F. C. 1987,ApJ, 318, 873
Pulliam, R. L., McGuire, B. A., & Remijan, A. J. 2012,ApJ, 751, 1
Remijan, A. J., Snyder, L. E., McGuire, B. A., et al. 2014,ApJ, 783, 77
Rubin, R., G.W. Swenson, J., Benson, R., Tigelaar, H., & Flygare, W. 1971,ApJ, 169, L39
Snyder, L. E., Lovas, F. J., Hollis, J. M., et al. 2005,ApJ, 619, 914
Tercero, B., Cernicharo, J., Pardo, J. R., & Goicoechea, J. R. 2010,A&A, 517, A96
Tercero, B., Kleiner, I., Cernicharo, J., et al. 2013,ApJ, 770, L13
Tercero, B., Cernicharo, J., López, A., et al. 2015,A&A, 582, L1
Turner, B. E. 1991,ApJS, 76, 617
Turner, B., Liszt, H., Kaifu, N., & Kisliakov, A. 1975,ApJ, 201, L149
Watson, J. K. G. 1977, in Vibrational Spectra and Structure, ed. J. R. Durig (Amsterdam: Elsevier), 6, 1
Woods, R. 1966,J. Mol. Spectr., 21, 4
Wu, Y., Liu, T., & Qin, S.-L. 2014,ApJ, 791, 123