HAL Id: insu-00661379
https://hal-insu.archives-ouvertes.fr/insu-00661379
Submitted on 4 Apr 2012HAL is a multi-disciplinary open access
archive for the deposit and dissemination of sci-entific research documents, whether they are pub-lished or not. The documents may come from teaching and research institutions in France or abroad, or from public or private research centers.
L’archive ouverte pluridisciplinaire HAL, est destinée au dépôt et à la diffusion de documents scientifiques de niveau recherche, publiés ou non, émanant des établissements d’enseignement et de recherche français ou étrangers, des laboratoires publics ou privés.
Nitrate and sulphate dynamics in peat subjected to
different hydrological conditions: Batch experiments and
field comparison
Nolwenn Bougon, Chrystelle Auterives, Luc Aquilina, Pierre Marmonier, Jo
Deridder, Philippe Vandenkoornhuyse
To cite this version:
Nolwenn Bougon, Chrystelle Auterives, Luc Aquilina, Pierre Marmonier, Jo Deridder, et al.. Ni-trate and sulphate dynamics in peat subjected to different hydrological conditions: Batch ex-periments and field comparison. Journal of Hydrology, Elsevier, 2011, 411 (1-2), pp.12-24. �10.1016/j.jhydrol.2011.08.019�. �insu-00661379�
Nitrate and sulphate dynamics in peat subjected to different
hydrological conditions: Batch experiments and field comparison
N. Bougona b c 1 C. Auterivesa 3 L. Aquilinaa c, P. Marmonierb 2 Jo Derrider a c P. Vandenkoornhuyseb c aUniversité Rennes 1-CNRS, CAREN Research Federation – UMR 6118 Géosciences, Campus de Beaulieu, Avenue Leclerc, Rennes, France
b
Université Rennes 1-CNRS, CAREN Research Federation – UMR 6553 EcoBio, Campus de Beaulieu, Avenue Leclerc, Rennes, France
c
Université Européenne de Bretagne, European University of Brittany (UEB), France
Summary
Conservation of ecosystems that depend on water management and water quality has to be considered. We combined a field monitoring and batch experiments to better understand the impact of hydrological perturbations on peatland functioning. Factors influencing the dynamics of nitrate and sulphate concentration observed in two sites with different hydrological conditions in a south Normandy peatland were determined through the comparison of field and lab experiment. The effects of nitrate input, and oxic or anoxic conditions on nitrate and sulphate concentrations were investigated in bioreactors, using peat samples from field sites influenced by different hydrologic regimes. In this experiment, peat samples were subjected to similar conditions to address the effects of and O2
concentrations (chemical effects), and the effect of hydrologic regimes and peat soil moisture (physical effects) on nitrate and sulphate dynamics.
Cl−, and were monitored for 215 h. Nitrate was significantly reduced in most experiments. A complete nitrate reduction after 215 h in soil under anoxic conditions was observed. A denitrification process was also found under aerobic conditions depending on the peat site sampling, i.e. depending on the hydrological conditions. This process was interpreted as a heterotrophic denitrification. Sulphate monitoring revealed that 400 mg L−1 were
produced in peat from the peat site with high hydrologic fluxes under aerobic conditions. Clear differences in chloride concentration (deviance analysis, P < 0.05), sulphate concentration and nitrate consumption dynamics (deviance analysis, P < 0.0001) were observed, for similar experimental chemical conditions, between the samples from the two peat sites. These differences were related to the field chemical variations observed and they indicate that part of the field nitrate and sulphate dynamics is linked to different bacterial activity and not only to nutrient fluxes variations.
Keywords : Hydrological flowpaths; Microbial activity; Nitrate reduction; Peat
1. Introduction
As they slowly accumulate, peatlands provide an interesting support to past climate and vegetation investigations (e.g. [Barber, 1993], [Charman, 2002] and [Charman et al., 2009]). They constitute outstanding natural environments which ensure various hydrological and biogeochemical functions as well as biodiversity conservation ( [Mitsch and Gosselink, 2000], [Bullock and Acreman, 2003], [Chapman et al., 2003] and [Minayeva et al., 2008]). Despite their ecological interest, many of these areas have been ruined or/and damaged to industrials (e.g. peat mining) or agricultural (e.g. drainage) purposes. A loss of fifty percent of the French peatlands has been estimated since the middle of the 21st century. Such practices lead to hydrological disturbance and can have a severe impact on peatland regarding biological and biogeochemical functioning ( [Price and Waddington, 2000], [Chapman et al.,
2003] and [Littlewood et al., 2010]). This may be important on a global scale since it can affect on the key role of peatland as a carbon sink. Effects can also be observed on a more local scale by modifying their self-purifying properties and by inducing impairment on groundwater quality. Peatlands are particularly sensitive to hydrological variations. However, the long-term evolution of biogeochemical functioning of peatlands related to hydrological variations is not well known (Knieß et al., 2010). To assess the vulnerability of such wetlands, in particular in the context of climate change, the effects of hydrological fluctuations on the biogeochemical processes occurring in these environments need to be more thoroughly understood.
Relationships between chemical conditions, microbial processes and physical parameters such as water fluxes have been addressed only from the first decade of the 21st century (e.g.
[Chapelle, 2000], [Clément et al., 2002], [Clément et al., 2003], [Ginn et al.,
2002] and [Vidon and Hill, 2004]). Such parameters are related to landscape physical structure and appear to be determinant in controlling the spatial variability of these
biogeochemical processes ( [Burt and Pinay, 2005], [Clément et al., 2002], [Clément et al., 2003], [Duval and Hill, 2007], [Fink and Mitsch, 2007], [Hedin et al., 1998], [Hill et al., 2000], [Packman et al., 2004] and [Sabater et al., 2003]). Several hydrological models have been proposed focusing on the prediction of microbial transport and the effect of microbial mats on water fluxes in natural porous and high nutrient media (e.g. [Ginn et al., 2002], [Harvey et al., 1993], [Murphy and Ginn, 2000] and [Rockhold et al., 2004]). However, few studies deal with unsaturated or variably saturated systems (Rockhold et al., 2004). Field studies on experimental (Phipps and Crumpton, 1994) and natural wetlands (Day and
Megonigal, 1993) or associated to model analyses (Spieles and Mitsch, 1999) highlighted the impact of hydrologic loads. For example, nitrate removal rates are shown to be influenced by high frequency water level variations relative to long term flooding conditions ( [Ishida et al., 2006] and [Tanner et al., 1999]). Thus water level provides limited information on
biogeochemical processes and a proper detection of the water fluxes is necessary. To date, the effect of water fluxes on biological and biochemical activities, has not been simultaneously addressed in both laboratory and field comprehensive studies. Hydrological conditions may influence biogeochemical cycles through the availability of resources (oxygen, nutrients…). However, it may also directly influence the element dynamics through the modification of the peat reactivity i.e. the microbial activities and the peat structure. Such modification could be particularly sensitive after a long-term modification of water fluxes and may have thorough implications for wetlands evolution in the context of climate change. The aim of our work is
thus to measure the sensitivity of biogeochemical cycles to different hydrological conditions (soil moisture and water fluxes) by: (i) a field study, (ii) a laboratory experiment investigating biogeochemical processes, and (iii) a microbial diversity analysis. The microbial diversity analysis has been described previously in Bougon et al., 2009 and major conclusions will be only summarized in the discussion. This paper focuses on the chemical results of both field and laboratory experiments. The field study was conducted in a peatland in western France (Auterives et al., 2011). It was intended to distinguish the influence of hydrological conditions on biogeochemical functioning through the investigation of two sites: (i) a reference site and (ii) a site affected by pumping in the underneath aquifer which induced important river-water fluxes. A focus on the chemistry in the two sites (on a 2 year monitoring) showed that
sulphates and nitrates are good indicators of chemical changes related to hydrological fluxes. An experimental approach was then used to understand the field observations, as regards nitrate and sulphate changes, and to isolate the physical and chemical factors which might influence the nutrient dynamic trends.
This paper tries to distinguish between physical effects induced by hydrological conditions (peat saturation, water fluxes) and chemical conditions (nutrient and oxygen availability) on nitrate and sulphate dynamics. Based on the field hydrological monitoring: (1) Peat samples from the two investigated sites were selected along a soil transect going from the stream to one hundred meters inside the peatland. (2) These peat samples were water-saturated and were incubated under different chemical conditions (oxygen or oxygen-free and nitrate addition). (3) To distinguish between biotic and abiotic processes a set of sterilized sub-samples was also analyzed. (4) The modifications of nitrate and sulphate concentrations were measured after 50 and 215 h. This experimental strategy allowed us to evaluate the effect of field hydrology on peat reactivity (using peat samples from different sampling points under different water fluxes) and the implication of biological or non-biological processes in nutrient changes. Finally, the major biochemical trends observed in the field for nitrate and sulphate were compared to the laboratory observations in order to investigate the potential effect of long-term hydrological variations.
2. Material and methods
2.1. Field site
2.1.1. Geological and hydrological settings
The peatland site, which developed after the last glacial period, is located in south Normandy, 49°15′N, 1°20′W, in the ‘Marais du Cotentin et du Bessin’ regional natural park. Peat
thickness varies from 1 m close to the stream to 7 m in the center of the peatland. It is mainly covered by herbaceous plant communities. Along the main streams there are regular
exchanges between the peatland and the drainage network which consists of several rivers either within or bordering the peatland. The peatlands overlie a clay-rich layer (1.5–6.0 m) which corresponds to the bottom of free aquifer forming the peaty wetland. The underneath aquifer consists of a sandy formation (Mio-Pliocene) filling an on average 80 m thick graben. This sand aquifer is highly permeable and the basin is pumped to supply drinking water. In order to investigate the sensitivity of wetlands to both climatic and anthropogenic
influences, the monitoring of groundwater levels and stream water levels and water chemical campaigns were carried out from 2003 to 2005. Hydrological or hydrochemical results and methodology have been widely described in Auterives (2007) and Auterives et al. (2011).
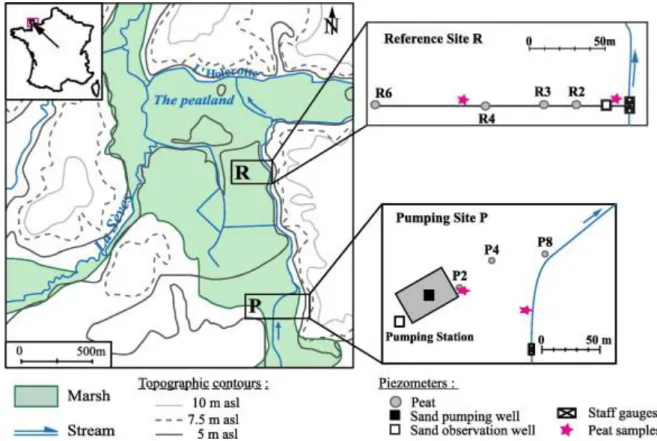
Two study sites were set up (Fig. 1). The first is under the influence of a pumping station (water extraction from sand aquifer) (site P). The second is located one kilometer
downstream, beyond the zone of influence of the pumping station and was used as a reference site (site R). Indeed, the capture zone of the extraction well does not extend farther than 150 m downstream from the pumping area (Vernoux et al., 2000).
The hydrological fluxes in the two sites were determined by monitoring: (1) the stream level by staff gauges, (2) the groundwater levels in the wetland with PVC piezometers which were set up at different depths (1.5–5 m) along a stream-peat transect, (3) the clay-rich layer at the base of the peat, (4) the deep aquifer level in a well at both sites. In both sites, the peatland is monitored along a transect going from the stream (R2/P8) to the inner part of the peatland (R6/P2). In pumping site P, piezometer P2 is close to the pumping station. The peatland hydrology is mainly dominated by the exchanges between the peat and the main streams. The hydrogeological conditions exhibited by the two sites are clearly distinct (Fig. 2).
2.1.2. Field chemical monitoring
Water chemical campaigns were carried out every 2 months from 2003 to 2005 (Auterives, 2007). Peat groundwater was collected from the PVC pipes. Physico-chemical parameters (pH, Eh, T °C) were measured on site with a field multiparameter WTW P4. Water was sampled, filtered (0.22 μm cellulose acetate filter capsule Sartorius) and analyzed for Cl−,
, and through ion chromatography Dionex DX-120 in the Geosciences chemical laboratory with an uncertainty below 5%. Dissolved organic carbon content (DOC) was analyzed on a Shimadzu 5000 TOC analyzer with an uncertainty of 5% and a detection limit of 0.08 mg L−1.
2.2. Laboratory experiments
Peat samples from the two P and R sites were collected at a depth ranging from 50 to 80 cm with an auger in March 2004. The samples were collected at 2 locations in each site, close to (2 m) and distant from (100 m) the stream (Fig. 1). The soil samples were stored at 4 °C for 2 days before the experiment and two kinds of hydrologic conditions were tested: (1) the importance of stream influence on the peat at large scale (comparison of pumping site P and reference site R), and (2) the differences in moisture conditions (rewetting/drying frequency and duration i.e. close and distant to the stream).
2.2.1. Peat sample characteristics
During sampling, large roots were removed and the soil was homogenized but not sieved in order to preserve the soil microbial heterogeneity. pH was determined by AFNOR NF X 31-103 method (Table 1). C–N–S–O values were obtained with a CHNSO EA1108 Carlo-Erba apparatus.
2.2.2. Experimental procedure
After a 25 h equilibration period, changes in nitrate and sulphate concentrations were
monitored for 215 h under: (i) high and low nitrate input, (ii) oxic and anoxic conditions and (iii) biotic and abiotic control. Thirty grams of wet soil was placed in serum flasks containing 100 ml of synthetic solution (40 mg L−1 of Cl− as NaCl). Stream water was not used directly
because of potential microbial contamination. A synthetic solution similar to the stream water in terms of ionic strength was used. No nitrate was added to the low nitrate samples. High nitrate concentrations were obtained by adding 30 mg L−1 of (as NaNO3). The
incubation conditions were either oxic (in an oxygen atmosphere) or anoxic (under a N2
atmosphere). Anaerobic conditions were ensured by flushing the ambient air in flasks three times with N2. The flasks were shaken continuously throughout the experiment to ensure
moderate homogeneity. One hour before sampling, the flasks were stirred to homogenize the water content and then left still for the particles to settle. Abiotic controls consisted of sterilized peat samples in which the bacterial enzymes had been metabolically inhibited by gamma ray irradiation so that the soil physical structure remained unaltered. Ionization, involving a 60 kGray or 6 mrads treatment, was carried out at the ‘Commissariat à l’Energie Atomique’ (CEA, Cadarache). All abiotic control samples were subjected to the same procedures as the other sample series. Potential variability related to peat heterogeneity was taken into account by performing triplicates for each experimental condition (nitrate addition, oxic or anoxic, sterilized…). All figures and tables from the batch experiment indicate the mean of the triplicate value and its standard error.
2.2.3. Chemical analyses
Nitrate, chloride and sulphate concentrations increased slightly in each bioreactor over 25 h after water saturation at the beginning of the experiment. Variation was related to soil pore water and added water equilibration (solubilization effect). As the variations in nitrate and sulphate concentration were concomitant with those of chloride and as no dissolved organic carbon was noticed, biogeochemical mechanisms could be ruled out. This equilibration stage was therefore ignored in the following kinetic analyses.
Five milliliter of solution was sampled from the flasks after 50 and 215 h of incubation 3 mL, filtered through 0.22 μm cellulose-acetate filters (Sartorius Minisart) were analyzed for major anions (Cl−, and ) by ion chromatography at the Caren-Geosciences Rennes laboratory. The remaining 2 mL were used to determine microbial diversity (Bougon et al., 2009). Physico-chemical parameters were measured at the end of each experiment. pH was measured with a precision of +/−0.05 unit using a Sentix 50 electrode, calibrated with WTW standard solutions of known pH (4.01 and 7.00 at 25 °C). Redox potential was determined using a platinum electrode (Mettler Pt 4805).
The different experiments presented various concentrations after the equilibration phase. Thus, the variation of concentration is presented as the ratio to ‘zero’ concentration (Δ = Ct/C0
in%, with C0 the concentration at t0 the beginning of the experiment after the equilibration
phase) in all the figures to allow the batch experiments comparison.
2.2.4. Statistical analysis
The chloride, nitrate and sulphate concentrations for each site (site R and site P, near to and distant to the stream), for each set of conditions (added or not, oxic or anoxic), and for each time point (t0, t50 and t215 hours), were log-transformed because the family-wise errors
rate in the dataset followed a Poisson distribution. The resulting data set was analyzed using a Generalized Linear Model (GLM) implemented in R. A deviance analysis (effect on GLM when one term was removed) was performed to test (i) differences between the sites for each variable (Cl−, and concentrations) at each time; (ii) the possible effect of
addition on the other variables, and (iii) the effect of oxic and anoxic conditions on the measured parameters. Statistical analyses were performed using the chi-square test. When a term was significant, the contrasts (mean comparisons), i.e. interaction terms were subjected to z coefficient tests. This was feasible despite the normally asymptotic distribution of the beta coefficients. The significance of the results was confirmed by applying a Bonferroni
correction. All these analyses were implemented using R (R Project for Statistical Computing, 2003). No nitrate variation was observed during the experiments in the batches without nitrate addition. These experiments will not be presented for clarity.
3. Results
3.1. Hydrogeological setting
This section sums up the main results of the hydrological functioning of the peatland
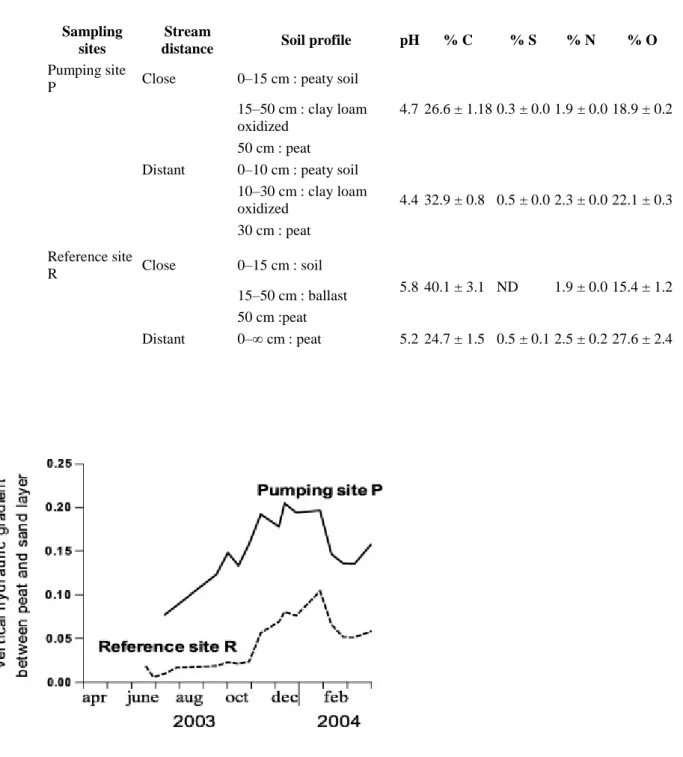
previously investigated through a detailed water balance (Auterives et al., 2011). During the 2-year period of monitoring, the hydrological functioning of the wetland showed a hydric deficit, associated with a permanent unsaturated layer and a deep water table (Fig. 2). At the same time, the stream was observed serving as a recharge inflow instead of draining the peatland, as usually described in natural systems. It has also been observed that in the peat local groundwater flow reverses between low-water and high-water periods. Comparison with a similar site 20 km west, investigated in 2001, indicated that the drought observed was related to a climatic effect, i.e. two rather dry years compared to the mean annual precipitation height. Piezometric monitoring allowed vertical gradients to be measured (Fig. 3). Vertical gradients showed gradients higher by a factors 2–5 in pumping site P compared to reference site R.
Piezometric measurements were completed by a large permeability data set at various depth in the peat and underlying clay layer. The upper part of the peat (0–1.20 m) presents
permeabilities ranging from 2 × 10⁻⁷ to 10−5 m s−1. The lower part of the peat (below 1.20 m) and the clay layer present relatively high hydraulic conductivities (from 1 × 10⁻⁷ to
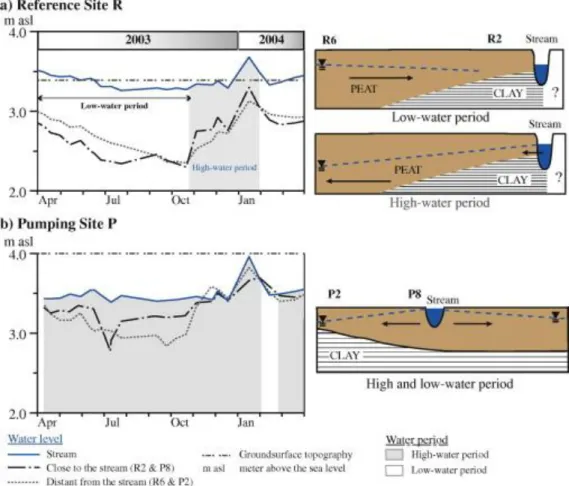
3 × 10⁻⁹ m s−1) and does not form a hydraulic barrier. Pumping in the underlying aquifer influences fluxes of the peatland at a local scale. Consequently groundwater flows in the peatland and through stream-peat groundwater exchanges are different between sites R and P. Two hydrological regimes are observed. During high waters (grey area, Fig. 2a), the stream water level is above the peat groundwater levels which are similar, both far away and close to the stream showing a relatively flat groundwater table. Stream water flows locally into the peat groundwater. During low water periods (white area, Fig. 2a), the peat groundwater level is higher inside the peatland (R6) and lower on the edge (R2). Both R6 and R2 remain below the stream water level. On this 2D view, the groundwater flows locally appear to converge. Therefore, the stream and the peat groundwater are locally and temporary disconnected during low water periods. Such disconnection during the whole low-water period induces an
important water table lowering in the peat (close to 1 m) (Fig. 2a).
Pumping site P: The water table fell much less (less than 50 cm) in the site P (Fig. 2b). The
water table is almost identical to the stream level during the high-water period (November 2003 to March 2004, Fig. 2b). In contrast to site R, hydraulic gradients inducing water fluxes from stream to peat (water level into the peatland lower than close to the stream) are observed during most of the hydrological cycle (Fig. 2b). Site P is almost permanently supplied by stream surface water entering into the peatland. The hydrological regime in site P is induced
by pumping in the underneath aquifer which decreases the sand aquifer water table (about 0.5 m in the abstraction well). Fig. 3 presents the gradients between the peat aquifer and the sand aquifer. It indicates that these gradients are 2–5 times greater in site P compared to the reference site R. These gradients induce the stream inflow in the peat and maintain higher water tables in the peat in pumping site P than in the reference site G.
Consequently, the main differences in hydrological conditions are related to the stream influence with (i) important fluxes from the stream through the peat at site P which maintains high peat water levels, and, conversely, (ii) limited fluxes from the stream, which create long and considerable downward water movement and peat drying in the site R.
From the hydrogeological monitoring and from the permeability data set, a precise water balance could be carried out in both sites in 2004 (Auterives et al., 2011). The water balance showed that the stream inflow represented 11% of the total input at site P while it represented 1% of the total input at site R. This mass balance showed the effect of pumping in site P which induced fluxes from the peat downward to the aquifer during the investigated period. The detailed hydrogeological investigation indicates that, although both pumping and reference peat sites are influenced by climatic effects, the two sites mainly differ from a hydrological point of view. This difference is related to the anthropogenic influence and has been operating for two decades. We thus consider that the sites comparison (i) for a large range of chemical conditions in lab experiments, and (ii) through the field-lab comparison, provides a set up which allowed the long-term effects of hydrological conditions to be tested.
3.2. Field geochemical observations
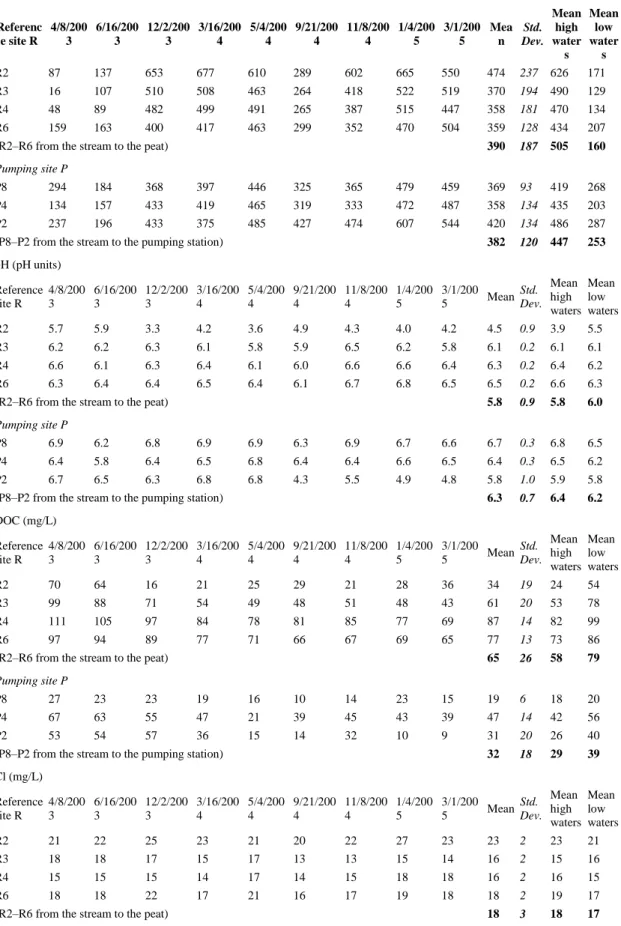
The peat, the stream water and the rain water characteristics are presented in Table 2 and Table 3. The peat groundwater was slightly acid (pH 5.8–6.4) and pH remained relatively constant throughout the observation period. Mean chloride concentrations ranged from 15 to 38 mg L−1 without a significant contrast between high- and low-water periods.
3.2.1. Redox, nitrate and sulphate dynamics
Mean redox potential ranged from 129 to 626 mV and varied according to the hydrological period. Redox values exceeded 400 mV throughout the high-water periods, indicating oxidized conditions. During the low-water periods, Eh fell below 200–300 mV, indicating moderately reduced conditions. Nitrate dynamics were also dependent on hydrological conditions, nitrate concentrations being higher during high-water periods (mean
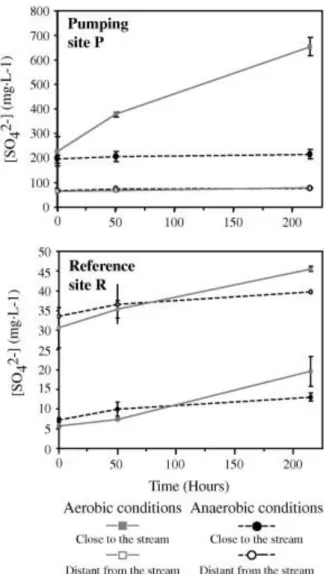
concentrations about 11–17 mg L−1) than during low-water periods (mean concentrations: 1– 2 mg L−1). A clear decrease in nitrate concentration was observed during low-water periods (Table 2). Sulphate concentrations showed very high variations from 0 to 1200 mg L−1 (Table 2). Sulphate also showed a variation related to hydrological periods with lower values during low-water periods (mean values of 119 and 111 mg L−1 in reference and pumping sites, respectively) than during high-water periods (176 and 144 mg L−1 in reference and pumping sites, respectively).
3.2.2. Site comparison
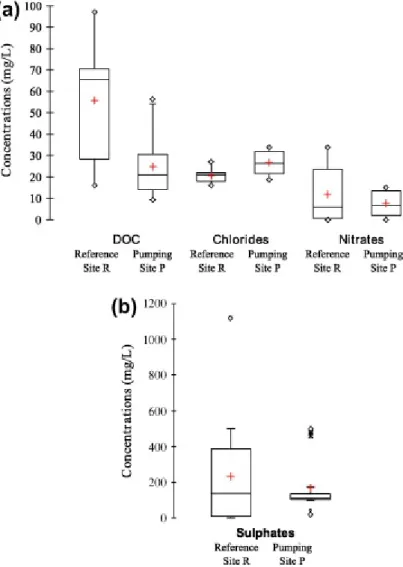
The field results showed an obvious variation between the reference and pumping sites (Table 2, Fig. 4). Whilst pH and Eh did not show clear differences between sites, DOC
(Fig. 4). Chloride showed higher values in the pumping site P (30 mg L−1 on average) then in the reference site R (18 mg L−1 on average) (Fig. 4). The pumping site P values were very similar to the river concentrations (37 mg L−1; Table 3), in agreement with the close
connection between stream and peat waters. An efficient nitrate removal was observed in the pumping site P, leading to nitrate concentrations below detection limit during low-water periods. In reference site R, the nitrate removal was slightly more limited or slower (higher values during high-water periods). Extremely high sulphate concentrations were observed close to the stream in reference site R (430 mg L−1; piezometer R2), which led to mean sulphate concentrations higher than in pumping site P (157 and 133 mg L−1, respectively) (Fig. 4).
3.2.3. Distance from the stream
The piezometer transects from the river to the inside part of the peatland (from R2 to R6 in reference site R and from P8 to P2 in pumping site P) showed chemical gradients. DOC concentrations decreased from the interior towards the stream in both sites (Table 2). They also decreased close to the pumping station (P2), which leads to a reversed-U shape of the concentration profile in site P. Nitrate concentrations decreased close to the stream in the reference site R but dilution effects can be ruled out since the nitrate concentrations in the whole peat systems were always lower than the stream concentrations. Conversely, nitrate concentrations were higher close to the stream in pumping site P (Table 2). Extremely high sulphate concentrations (>1000 mg L−1) were observed at the beginning of high-water periods (peat-stream connection), close to the stream in both sites especially in the reference site R. Sulphate concentrations decreased in peat when distance to the stream increased. In the reference site R, the most internal samples (R6) had concentrations close to 0 during low-water periods. Conversely, high concentrations (244 mg L−1, piezometer P2) close to the abstraction well were also observed in pumping site P leading to U shape concentration profile unlike DOC.
3.3. Batch results
3.3.1. Nitrate
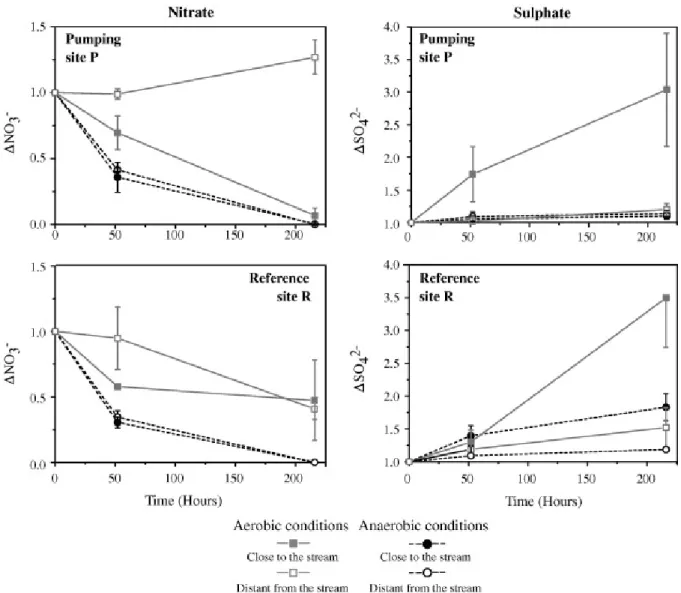
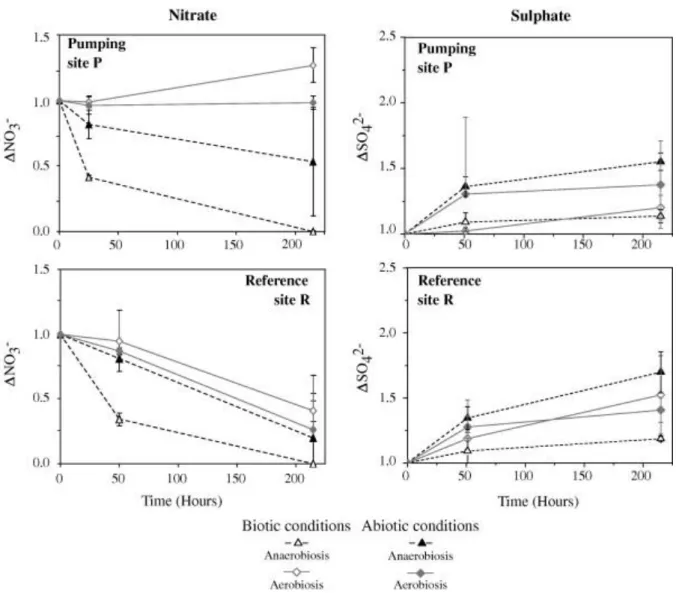
Treatments without nitrate added were used as control and are not presented. Kinetics were similar in both high and low nitrate inputs (Table 6) and the nitrate reduction velocity did not allow us to identify any mechanisms. The physico-chemical parameters and the element concentrations measured in the batches are presented in Table 4 and Table 5. A systematic decrease in nitrate concentrations was observed under anaerobiosis (Fig. 5). Maximal nitrate consumption occurred during the first 50 h, reaching 70 % of the initial concentration under anaerobiosis. No clear difference can be observed between the reference R and the pumping P sites since the mass percentage decreases are similar. It seems that the kinetics were similar, assuming identical reactions.
Conversely, both site location and distance to stream source influenced nitrate dynamics. Three of the four aerobic batch samples demonstrated a decrease in nitrate levels. This unexpected result was found either for P and R samples, but P samples reacted more rapidly. In the pumping site P in aerobic conditions, nitrate concentrations increased in the samples distant from the stream (i.e. close to the pumping station), while it decreased in samples close to the stream (Fig. 4). In the reference site R, concentration changes were less important
(higher concentrations, Table 5) close to the stream either with or without oxygen than in the other conditions.
3.3.2. Sulphate
No sulphate reduction was observed during the batch experiments, while increases in sulphate concentrations were observed repeatedly (Fig. 4, Fig. 6). This observation was higher in samples collected close to the stream (Table 5 and Table 6, deviance analysis, P < 0.0001) and in samples subjected to aerobic conditions (deviance analysis, P < 0.0001; Fig. 5). Sulphate production in pumping site P under aerobic conditions (close to the stream) corresponded to Δ ( t215h– t0) = 400 mg L−1. This was a sulphate concentration of
600 mg L−1 at the end of the experiment (Table 5).
Differences in sulphate dynamics were observed between sites (Fig. 5). The sulphate concentrations at the beginning of the experiment after the equilibration phase were very different among samples (80–600 mg L−1 in pumping site P – 5–45 mg L−1 in reference site R). Moreover, the increase in sulphate concentration was higher with the samples from the pumping site P (Table 5, Fig. 5). It should be noticed that the site R experiments showed very low sulphate concentrations (5 and 7 mg L−1) at the beginning of the experiments.
The distance to the stream also had an important effect on sulphate variations during the experiments. At the beginning of the experiment, the sulphate concentrations in samples from the pumping site P close to the stream were three times higher than in samples distant from the stream (Table 5). A reverse pattern was observed in the reference site R, with higher sulphate concentrations in samples distant from the stream than in those close to the stream. At the end of the experiments, this reversed pattern between P and R sites persisted (Fig. 6).
3.3.3. Effects of biological processes
The comparison between biotic and abiotic batches (Fig. 7) clearly highlighted the influence of microbial processes on nitrate dynamics. The nitrate removal was higher in biotic than in abiotic samples (e.g. deviance analysis in reference site R in aerobic conditions P < 0.001) at least during the first 50 h. Later in the experiment, a decrease in nitrate concentrations was also observed in abiotic conditions which was likely due to a microbial contamination. In contrast, the sulphate dynamic was similar in both biotic and abiotic batches (deviance analysis P > 0.05, Fig. 7), suggesting that microorganisms did not cause variation in sulphate concentrations.
4. Discussion
4.1. Biogeochemical processes in batch experiments
4.1.1. Nitrate removal
The observed reduction of nitrate concentration during batch experiments has already been reported in several studies. This phenomenon results from microbiological consumption, nitrate serving as electron acceptor (Correl, 1997). The microbiological reduction of nitrates involves three types of processes: dissimilatory reduction, autotrophic and heterotrophic denitrification. Although nitrate-reducing microorganisms display a great plasticity to oxygen availability, most denitrifiers use nitrate as final electron acceptor under anoxic conditions
(Florinsky et al., 2004). The presence here of available dissolved organic carbon (>30 mg L−1), moderately reduced redox conditions (<200–300 mV) (Table 2), anoxic conditions and nitrate suggests a heterotrophic reduction process ( [Hedin et al., 1998], [Hill et al., 2000], [Ingersoll and Baker, 1998] and [Vidon and Hill, 2004]). Nitrate removal is a major biological process (Fig. 7). However part of this process may also interact with
chemical reactions. The comparison of biotic and abiotic conditions indicates nitrate reduction even under abiotic conditions, which suggests that the whole nitrate reduction cannot be assigned solely to biological activity. However, a contamination of the abiotic condition should not be excluded after 50 h of incubation given due to the samplings.
Denitrification was also observed under aerobic conditions. Various bacteria may activate this process (Chen et al., 2003) although denitrification is not as competitive as aerobic respiration in terms of energy produced. This phenomenon should be interpreted as an electron accepting mechanism that competes with aerobic respiration, providing an advantage in terms of fitness in a changing environment. Some oxygen-tolerant anaerobes are well adapted to survive oxygen stress, and are able to maintain a functional metabolism in presence of oxygen (Brune et al., 2000). Patureau et al. (2000) suggested that alternating aerobic-anoxic conditions can isolate new strains of aerobic denitrifiers, and that naturally aerobic denitrifiers may exist. Alternatively, the nitrate reduction observed under aerobic conditions could be due to localized development of micro-anaerobiosis even though the flasks were shaken. Microbes can also absorb nitrate and use it for amino acids synthesis through an assimilatory process. Furthermore, this process is not affected by oxygen (Zumft, 1997) and it can be supposed that part of the nitrate removal is due to assimilatory nitrate reduction. However assimilatory reduction is an energetically expensive process and it mainly occurs when microbes are nitrogen limited but have an adequate energy supply. We thus think that the major process is denitrification.
4.1.2. Sulphates
Fig. 6 shows the sulphate concentrations at the beginning of the experiments. Very high sulphate concentrations are observed, especially for the pumping site P which agrees with considerable sulphate production during the experiment (Fig. 5), under aerobic conditions (samples close to the stream). The observed sulphate release, especially in peat samples from pumping site P close to the stream can result from mineral and/or organic matter dissolution under aerobic conditions. The presence of oxygen may have enhanced the biodegradation of phenolic compounds by the phenol oxidases (Freeman et al., 2004). This activity enables the production of sulphate from sulphate esters contained in the peat matrix bonded to humic substances (polyphenolic and phenolic compounds) ( [Chapman and Davidson, 2001], [Lou and Warman, 1994] and [McGill and Cole, 1981]). Sulphates released during the experiments were however mainly derived from the chemical dissolution of mineral phases since the experiments performed under abiotic conditions indicated an important, non-biological sulphate-releasing process (Fig. 7). These results agree with other reports of sulphate release under oxidized conditions ( [Devito and Hill, 1999], [Eimers et al., 2003] and [Fenner et al., 2005]).
Dissolution of reduced sulphur phases during oxidized conditions implies a sulphur source and potential preliminary sulphate reducing activity to provide a sulphur pool. Although no sulphate decrease was observed in the batch experiments, very low sulphate concentrations were obtained at the beginning of the experiments (Fig. 6) in the reference site R batches close to the stream, much lower than the stream concentrations observed during the field
study. The chloride to sulphate ratio (6–10) in the peat batches’ samples is higher than the stream or precipitation Cl/SO4 ratio (2.8 and 1.5) (Table 2). The latter can be considered as
the ‘minimum’ sulphate concentrations which initially entered in the peat system. Since there is no chloride consumption, the high Cl/SO4 ratios indicate that some processes have lowered
the sulphate concentrations in the peat system. Low sulphate concentrations are interpreted as reflecting sulphate reducing activity in the pore waters of the peat matrix. It may indicate that sulphate reducing bacteria constitute an active community.
4.2. Biogeochemical and hydrological processes in field studies
The different hydrological regimes induced different water fluxes in the investigated sites. Pumping in the underlying aquifer resulted in a permanent flow from the stream into the peat in pumping site P. The amplitude of water table fluctuation and peat drying were also
controlled by the underlying aquifer and high water tables were maintained in pumping site P for much of the year, (Auterives et al., 2011). Stream influence is deduced from
hydrogeological and chemical measurements. The chloride decrease from the stream to the peat interior in both sites indicated an important stream input (Table 2). The changes in nitrate and sulphate concentrations were clearly related to water table dynamics. Nitrate increases during high-water period are related to stream inflow which presents high nitrate
concentrations as well as high Eh values in site P. Following the high-water nitrate input, nitrate reducing activity leads to the nitrate decrease observed during the low-water period. Very high sulphate concentrations were observed in both sites. The highest and the more variable concentrations are clearly related to high-water periods close to the stream in reference site R (R2 piezometer, Table 2). These pulses of sulphate related to pulses of H+ (pH < 5) were observed after a desaturation/resaturation cycle in the area which corresponds to maximum drying of the peat during low water. Indeed, sulphate pulses resulting from a drying–rewetting effect have been observed elsewhere ( [Devito and Hill, 1999] and [Eimers et al., 2003]). During washing out, the formerly reduced compounds which are oxidized during unsaturated period are then mobilized into the pore-water during the resaturation period. This process is more generalized in the pumping site P (more constant and high concentrations in piezometer P8 and P2) which is related to the permanent river fluxes into the peat, and oxygen input. The differences observed in sulphate release within and between sites highlight the importance of hydrological fluxes in controlling sulphate dynamics through the introduction of oxygen and emphasis of biological processes. These results agree with previous reports ( [Devito, 1995], [Devito and Hill, 1999], [Eimers et al., 2003] and [Warren et al., 2001]) showing that sulphate release can be predicted from hydrologic heterogeneity.
4.3. Comparison of field measures and batch experiments
The batch experiment results agreed with the field observations. (1) Nitrate reduction was clearly reproducible, even under aerobic conditions, although this process was mainly expected under anaerobic conditions. (2) Both high and low sulphate concentrations were observed during some of the experiments. (3) Differences in sulphate concentration and nitrate consumption dynamics (deviance analysis, P < 0.0001) were observed between samples from the reference R and pumping P sites subjected to different hydrological
regimes, even under similar redox conditions. (4) Finally, reactivity also differed as a function of distance from the stream. Further on, a more detailed comparison provides several
4.3.1. Sulphate decrease in the internal part of the peat
Sulphate concentrations in batch experiments showed a general agreement with the field data especially because of both high and low measured concentrations (Table 5: 13–478 mg L−1). Low sulphate concentration in the batch and the field results (concentrations below detection level during low-water period, Table 2) indicate that sulphate reducing processes may be active in the peat environment, although the Eh measurements do not show highly reducing conditions. Sulphate reducing conditions are only reached after consumption of other oxidants. Such conditions were not reached during the batch experiments and they are only observed in the preserved parts of the field sites where they are likely related to peat matrix micro-porosity.
4.3.2. High sulphate releases in pumping site P
Sulphate releases were observed in batch samples from both sites, especially the pumping site P close to the stream (Table 5, Fig. 6). The intensity of the release was dependant on the spatial location of the batch samples. The high concentrations at the beginning of the batch experiments (Fig. 6) indicate an important labile S pool in pumping site P, especially in the internal part of the peatland. These high sulphate values agree with field observation, on the pumping site P (piezometer P2) and close to the stream in both sites.
The batch experiments demonstrated that there is a mobile sulphur phase in the peat matrix which easily provides dissolved sulphates when the peat is water-resaturated. This S stock could be measured in the peat solid-chemical analyses (Table 1), although no S appeared in the sample close to the river in reference site, which can be explained by the intensive leaching during rewetting (SO4 concentrations > 1000 mg/L). Dissolved sulphates occur in
the field after the rise of the water table during winter. As observed in the biotic/abiotic comparison of the batch experiments, the sulphate release seemed to be mainly an abiotic reaction through the oxidation of reduced sulphur. The batch experiment differences, as well as the field site differences may thus be related to the S stock which is available when the peat is water-resaturated. This S stock, in turn, depends on the sulphate reducing bacteria activity and/or the chemical form of the S contained in the peat matrix either through sulphur minerals or through organic molecules such as sulphate esters. Iron concentrations in the
solid-chemical analyses of the peat (8–13 mg/kg of dry peat, Auterives, 2007) indicate that a major part of the S stock is a mineral form FeS2. The high sulphate leaching potential suggests a
global bacterial activity difference between the P and R sites. The sulphate-reducing bacteria may be more active and/or more important in the pumping site P and produce a more
important sulphur labile phase. They could indicate a more limited activity in the reference site R although low sulphate concentrations are observed in the inner part of the reference site R.
4.3.3. Efficiency of nitrate removal in pumping site P
Nitrate removal was more limited under aerobic conditions in batch experiments (Table 5 and Table 6). This conclusion agrees with the field observations which indicate nitrate removal during the low-water period, when more reducing conditions develop in both sites. Batch experiments also indicated that the reaction kinetics were relatively similar for both sites under anaerobic conditions.
Under aerobic conditions in the batches, peat from pumping site P seemed to provide more efficient and rapid nitrate removal due to bacterial activity than peat from reference site R (Table 5 and Table 6). This result agrees with lower field nitrate concentrations in pumping site P (Table 2). This effect was seen independently of nitrate concentrations or redox conditions which were similar in the different batches (Table 4 and Table 5). This efficiency could be related to microbial communities more adapted to higher oxygen concentrations and/or more frequent oxygen inputs related to the permanent stream influx in pumping site P.
4.3.4. Variation of nitrate concentrations with distance to the stream
Chemical gradients observed in the field from the peat interior towards the stream were measured in the site R. They clearly reflect the peat-stream connection and the stream water flow during the high-water periods. This zone, between terrestrial and aquatic ecosystems, represents a major mixing point for nutrients ( [Hedin et al., 1998], [Hill et al.,
2000] and [McClain et al., 2003]) which allows the production of dissolved organic carbon ( [Hill et al., 2000] and [Mitchell and Branfireun, 2005]) and thus enhances bacterial activity. In the batch experiments, however, the close or distant parameter had an important effect, for similar conditions of the other parameters (nitrate, DOC or oxygen concentration). The differences observed between sites do not only result from nutrients variations (chemical effect) but also from the physical effect of water fluxes and soil saturation on microbial activity.
4.4. Potential link between hydrological patterns on microbial activity
This study highlights the considerable effect of hydrological conditions on biological activity in peat. Although various parameters may control the field nitrate and sulphate dynamics, the design of the batch experiments has shown that, with similar chemical conditions, peat sampled from sites with different hydrological conditions showed different reactions. Part of the differences observed in the field such as nitrate or sulphate concentrations (Table 2) may be related to various microbial communities’ diversity, structure and/or activity (Bougon et al., 2009). The batch experiments highlighted a higher denitrification activity in pumping site P under aerobic conditions and major and constant sulphate releases in this site which may be related to a more important activity leading to a sulphur pool production.
Water fluxes and high moisture might influence microbial activity by creating an open ecosystem. Through these processes, hydrological fluxes also influence microbial activity in terms of substrate availability ( [Ostrom et al., 2002], [Sabater et al., 2003] and [Sánchez-Pérez and Trémolières, 2003]). Hydrological fluxes, in addition to providing stimulating physico-chemical conditions for biotic activity, may also provide more diverse substrate availability which may also benefit from favorable physico-chemical conditions. The biochemical conditions created by a hydrological flow structure will facilitate the
development of hot spots ( [Hill et al., 2000] and [McClain et al., 2003]). Thus the observed differences between sites and the spatial variability within sites may reflect the heterogeneous richness and diversity of microbial species in the ecosystem (Martin et al., 1999). The
observed differences between sites, even under similar redox and nutrient conditions, may indicate that the distinct hydrological fluxes can control the structure and diversity of the associated microflora. Analyses of the structure and diversity of nitrate-reducing communities in the microbial community of the batch experiments indicated clear differences of the
microbial diversity and structure between both sites, which confirm the conclusions drawn from the batch/field comparison (Bougon et al., 2009). The potential differences between
reference site R and pumping site P cannot be linked to the short-term enrichment in nitrate or depletion in oxygen we experimented, but may be attributed to differences between sites, i.e. long-term differences in peat saturation resulting from different hydrological regimes.
5. Conclusion
We investigated the potential link between physical parameters such as water fluxes and microbial community’s structure and activities in a peat aquifer. We examined
biogeochemical reactions to various environmental biochemical conditions in peat samples collected in two different field hydrological conditions. Our lab experiments combined to a field study have shown that part of the biogeochemical functioning is not directly related to the water table level, but also to a more global and long-term influence of the hydrological conditions on the microbial structure. Two decades of water abstraction have induced enough modification in hydrological regimes to modify peat saturation and microbial community structure and activity.
Integrating this influence may have implications on wetlands biogeochemical functioning under climatic or anthropogenic global changes. Climate change may modify the hydrological conditions for large wetland areas. Thus the potential biogeochemical functioning may be affected through deep and stable modifications of the microbial ecosystem. As peatlands play a key role in water resource management, these modifications should not be neglected in restoration programs.
Acknowledgments
This work was supported by the ‘Marais du Cotentin et du Bessin’ regional natural park and by grants from the General council of the ‘Manche’ department, the Regional council of Normandy, the Water Agency of Seine Normandy and the CNRS ‘programme de recherche ECCO-PNBC’. The authors are grateful to André-Jean Francez for helpful discussions; Odile Hénin for analytical work; Diana Warwick for English editing of the manuscript. The
comments of two anonymous reviewers helped to improve the paper.
References
Auterives, 2007 Auterives, C., 2007. Influence des flux d’eau souterraine entre une zone humide superficielle et un aquifère profond sur le fonctionnement hydrochimique des tourbières. Ph.D., Mémoires du CAREN, 17, 261.
<http://tel.archives-ouvertes.fr/docs/00/13/77/57/PDF/Auterives_PhD.pdf>.
Auterives et al., 2011 Auterives, C., Aquilina, L., Bour, O., Davranche, M., Paquereau, V., 2011. Wetland hydrological functioning under climatic and anthropogenic influence. Hydrol. Process. doi:10.1002/hyp.8052.
Barber, 1993 K.E. Barber Peatlands as scientific archives of past biodiversity Biodivers. Conserv., 2 (1993), pp. 474–489
Bougon et al., 2009 N. Bougon, L. Aquilina, M.P. Briand, S. Coedel, P.
Vandenkoornhuyse Influence of hydrological fluxes on the structure of nitrate-reducing bacteria communities in a peatland Soil Biol. Biochem., 41 (2009), pp. 1289–1300
Brune et al., 2000 A. Brune, P. Frenzel, H. Cypionka Life at the oxic–anoxic interface. Microbial activities and adaptations FEMS Microbiol. Rev., 29 (2000), pp. 691–710 Bullock and Acreman, 2003 A. Bullock, M. Acreman The role of wetlands in the hydrological cycle Hydrol. Earth Syst. Sci., 7 (2003), pp. 358–389
Burt and Pinay, 2005 T.P. Burt, G. Pinay Linking hydrology and biogeochemistry in complex landscapes Prog. Phys. Geogr., 29 (2005), pp. 297–316
Chapelle, 2000 F.H. Chapelle The significance of microbial processes in hydrogeology and geochemistry Hydrol. J., 8 (2000), pp. 41–46
Chapman and Davidson, 2001 S.J. Chapman, M.S. Davidson 35S-Sulphate reduction and transformation in peat Soil Biol. Biochem., 33 (2001), pp. 593–602
Chapman et al., 2003 S.J. Chapman, A. Buttler, A.-J. Francez, F. Laggoun-Défarge, H. Vasander, M. Schloter, J. Combe, P. Grosvernier, H. Harms, D. Epron, D. Gilbert, E. Mitchell Exploitation of northern peatlands and biodiversity maintenance. A conflict between economy and ecology Frontiers Ecol. Environ., 1 (2003), pp. 525–532
Charman, 2002 D.J. Charman Peatlands and Environmental Change John Wiley and Sons, England (2002)
Charman et al., 2009 D.J. Charman, K.E. Barber, M. Blaauw, P.G. Langdon, D. Mauquoy, T.J. Daley, P.D.M. Hughes, E. Karofeld Climate drivers for peatland palaeoclimate records Quatern. Sci. Rev., 28 (2009), pp. 1811–1819
Chen et al., 2003 F. Chen, F. Xia, L.K. Ju Aerobic denitrification of
Pseudomonasaeruginosa monitored by online NAD(P)H fluorescence Appl. Environ.
Microbiol., 69 (2003), pp. 6715–6722
Clément et al., 2002 J.C. Clément, G. Pinay, P. Marmonier Seasonal dynamics of
denitrification along topohydrosequences in three different riparian wetlands J. Environ. Qual., 31 (2002), pp. 1025–1037
Clément et al., 2003 J.C. Clément, L. Aquilina, O. Bour, K. Plaine, T.P. Burt, G. Pinay Hydrological flowpaths and nitrate removal rates within a riparian floodplain along a fourth-order stream in Brittany (France) Hydrol. Process., 17 (2003), pp. 1177–1195 Correl, 1997 D.L. Correl Buffer zones and water quality protection: general principles N.E. Naycock, T.P. Burt, K.W. Goulding, G. Pinay (Eds.), Buffer Zones: Their Processes and Potential in Water Protection, Quest Environment, Hertfordshire (1997), pp. 7–20 Day and Megonigal, 1993 F.P. Day, J.P. Megonigal The relationship between variable hydroperiod, production allocation, and belowground organic turnover in forested wetlands Wetlands, 13 (1993), pp. 115–121
Devito, 1995 K.J. Devito Sulphate mass balances of Precambrian Shield wetlands: the influence of catchment hydrogeology Can. J. Fish. Aquat. Sci., 52 (1995), pp. 1750–1760
Devito and Hill, 1999 K.J. Devito, A.R. Hill Sulphate mobilization and pore water chemistry in relation to groundwater hydrology and summer drought in two conifer swamps on the Canadian shield Water, Air, Soil Pollut., 113 (1999), pp. 97–114
Duval and Hill, 2007 T.P. Duval, A.R. Hill Influence of base flow stream bank seepage on riparian zone nitrogen biogeochemistry Biogeochemistry, 85 (2007), pp. 185–199 Eimers et al., 2003 M.C. Eimers, P.J. Dillon, S.L. Schiff, D.S. Jeffries The effects of drying and re-wetting and increased temperature on sulphate release from upland and wetland material Soil Biol. Biochem., 35 (2003), pp. 1663–1673
Fenner et al., 2005 N. Fenner, C. Freeman, B. Reynolds Hydrological effects on the diversity of phenolic degrading bacteria in a peatland: implications for carbon cycling Soil Biol. Biochem., 37 (2005), pp. 1277–1287
Fink and Mitsch, 2007 D.F. Fink, W.J. Mitsch Hydrology and nutrient biogeochemistry in a created river diversion oxbow wetland Ecol. Eng., 30 (2007), pp. 93–102
Florinsky et al., 2004 I.V. Florinsky, S. Mcmahon, D.L. Burton Topographic control of soil microbial activity: a case study of denitrifiers Geoderma, 119 (2004), pp. 33–53 Freeman et al., 2004 C. Freeman, N.J. Ostle, N. Fenner, H. Kang A regulatory role for phenol oxidase during decomposition in peatlands Soil Biol. Biochem., 36 (2004), pp. 1663–1667
Ginn et al., 2002 T.R. Ginn, B.D. Wood, K.E. Nelson, T.D. Scheibe, E.M. Murphy, T.P. Clement Processes in microbial transport in the natural subsurface Adv. Water Resour., 25 (2002), pp. 1017–1042
Harvey et al., 1993 R.W. Harvey, N.E. Kinner, D. MacDonald, D.W. Metge, A. Bunn Role of physical heterogeneity in the interpretation of small-scale laboratory and field observations of bacteria, microbial-sized microsphere, and bromide transport through aquifer sediments Adv. Water Resour., 29 (1993), pp. 2713–2721
Hedin et al., 1998 L.O. Hedin, J.C. von Fischer, N.E. Ostrom, B.P. Kennedy, M.G. Brown, G.P. Robertson Thermodynamic constraints on nitrogen transformations and other biogeochemical processes at soil–stream interfaces Ecology, 79 (1998), pp. 684– 703
Hill et al., 2000 A.R. Hill, K.J. Devito, S. Campagnolo, K. Sanmugadas Subsurface denitrification in a forest riparian zone: interactions between hydrology and supplies of nitrate and organic carbon Biogeochemistry, 51 (2000), pp. 193–223
Ingersoll and Baker, 1998 T.L. Ingersoll, L.A. Baker Nitrate removal in wetland microcosms Water Res., 32 (1998), pp. 677–684
Ishida et al., 2006 C.K. Ishida, J.J. Kelly, K.A. Gray Effects of variable hydroperiods and water level fluctuations on denitrification capacity, nitrate removal, and
benthic-microbial community structure in constructed wetlands Ecol. Eng., 28 (2006), pp. 363– 373
Knieß et al., 2010 A. Knieß, B. Holsten, W. Kluge, M. Trepel Prediction of long-term changes in ecosystem function of a peatland site with the semi-quantitative decision support system PMDSS Geoderma, 154 (2010), pp. 233–241
Littlewood et al., 2010 Littlewood, N.A., Anderson, P., Artz, R.R.E., Bragg, O., Lunt, P., Marrs, R., 2010. Peatland Biodiversity. A Technical Review for the IUCN Peatland Program.
Lou and Warman, 1994 G.Q.J. Lou, P.R. Warman Characterization of ester sulphate in a gypsum-amended podzol using an immobilized sulphatase reactor Biol. Fertil. Soils, 17 (1994), pp. 276–280
Martin et al., 1999 T.L. Martin, J.T. Trevors, N.K. Kaushik Soil microbial diversity, community structure and denitrification in a temperate riparian zone Biodivers. Conserv., 8 (1999), pp. 1057–1078
McClain et al., 2003 M.E. McClain, E.W. Boyer, C.L. Dent, S.E. Gergel, N.B. Grimm, P.M. Groffman, S.C. Hart, J.W. Harvey, C.A. Johnston, E. Mayorga, W. McDowell, G. Pinay Biogeochemical hot spots and hot moments at the interface of terrestrial and aquatic ecosystems Ecosystems, 6 (2003), pp. 301–312
McGill and Cole, 1981 W.B. McGill, C.V. Cole Comparative aspects of cycling of organic C, N, S and P through soil organic matter Geoderma, 26 (1981), pp. 267–286
Minayeva et al., 2008 T. Minayeva, O. Bragg, O. Cherednichenko, J. Couwenberg, G.-J. van Duinen, W. Giesen, A. Grootjans, P.L. Grundling, V. Nikolaev, S. van der Schaaf Peatlands and biodiversity F. Parish, A. Sirin, D. Charman, H. Joosten, T. Minaeva, M. Silvius (Eds.), Assessment on Peatlands, Biodiversity and Climate Change, Global
Environment Centre, Kuala Lumpur and Wetlands International Wageningen (2008), pp. 60–98
Mitchell and Branfireun, 2005 C.P.J. Mitchell, B.A. Branfireun Hydrogeomorphic controls on reduction–oxidation conditions across boreal upland–peatland interfaces Ecosystems, 8 (2005), pp. 731–747
Mitsch and Gosselink, 2000 Mitsch, W.J., Gosselink, J.G., 2000. Wetlands. John Wiley & Sons, Inc., New York, 920pp.
Murphy and Ginn, 2000 E.M. Murphy, T.R. Ginn Modeling microbial processes in porous media Hydrol. J., 8 (2000), pp. 142–158
Ostrom et al., 2002 N.E. Ostrom, L.O. Hedin, J.C. von Fischer, G.P. Robertson Nitrogen transformations and removal at a soil stream interface. A stable isotope approach Ecol. Appl., 12 (2002), pp. 1027–1043
Packman et al., 2004 A.I. Packman, M. Salehin, M. Zaramella Hyporheic exchange with gravel beds: basic hydrodynamic interactions and bedform-induced advective flows J. Hydraul. Eng., 130 (2004), pp. 647–656
Patureau et al., 2000 D. Patureau, E. Zumstein, J.P. Delgenes, R. Moletta Aerobic denitrifiers isolated from diverse natural and managed ecosystems Microb. Ecol., 39 (2000), pp. 145–152
Phipps and Crumpton, 1994 R.G. Phipps, W.G. Crumpton Factors affecting nitrogen loss in experimental wetlands with different hydrologic loads Ecol. Eng., 3 (1994), pp. 399– 408
Price and Waddington, 2000 J.S. Price, J.M. Waddington Advances in Canadian wetland hydrology and biogeochemistry Hydrol. Process., 14 (2000), pp. 1579–1589
Rockhold et al., 2004 M.L. Rockhold, R.R. Yarwood, J.S. Selker Coupled microbial and transport processes in soil Vadose Zone J., 3 (2004), pp. 368–383
Sabater et al., 2003 S. Sabater, A. Butturini, J.C. Clément, T. Burt, D. Dowrick, M. Hefting, V. Maître, G. Pinay, C. Postolache, M. Rzepecki, F. Sabater Nitrogen removal by riparian buffers along a European climatic gradient: patterns and factors of variation Ecosystems, 6 (2003), pp. 20–30
Sánchez-Pérez and Trémolières, 2003 J.M. Sánchez-Pérez, M. Trémolières Change in groundwater chemistry as a consequence of suppression of floods: the case of the Rhine floodplain J. Hydrol., 270 (2003), pp. 89–104
Spieles and Mitsch, 1999 D.J. Spieles, W.J. Mitsch The effects of season and hydrologic and chemical loading on nitrate retention in constructed wetlands: a comparison of low- and high-nutrient riverine systems Ecol. Eng., 14 (1999), pp. 77–91
Tanner et al., 1999 C. Tanner, J. D’Eugenio, G.B. McBride, J.P.S. Sukias, K. Thompson Effect of water level fluctuation on nitrogen removal from constructed wetland
mesocosms Ecol. Eng., 12 (1999), pp. 67–92
The R project for statistical computing, 2003 The R Project for Statistical Computing. <http://www.r-project.org/> (accessed March 2003).
Vernoux et al., 2000 Vernoux, J.F., Lebray, P., Petit, V., Deroin, J.P., Siegel, P., 2000. Ressources en eau souterraine de l’Isthme du Cotentin—Synthèse des connaissances. BRGM. RR-40824-FR. Orléans, France.
Vidon and Hill, 2004 P.G.F. Vidon, A.R. Hill Landscape controls on the hydrology of stream riparian zones J. Hydrol., 292 (2004), pp. 210–228
Warren et al., 2001 F.J. Warren, J.M. Waddington, R.A. Bourbonniere, S.M. Day Effect of drought on hydrology and sulphate dynamics in a temperate swamp Hydrol. Process., 15 (2001), pp. 3133–3150
Zumft, 1997 W.G. Zumft Cell biology and molecular basis of denitrification Microbiol. Mol. Biol. Rev., 61 (1997), pp. 533–616
Figures
Fig. 1. Location of the study site and piezometers map of the pumped site P, in the front of a pumping station, and the reference site R, one kilometer downstream, beyond the influence of the pumping station.
Fig. 2. Water level fluctuations during a hydrological year in reference site R (a), and pumping site P (b). Schematic peatland profiles are an interpreted view of the peatland/stream water flow
relationships. Grey and white areas indicate changes in the direction of horizontal groundwater flow. During grey periods, the peat groundwater level decreases from the edge of the stream to the inner part of the peatland, and shows groundwater flow from the stream into the peatland. During white periods, the peat groundwater level is higher far from the stream than close to the stream. The stream drains the peatland except at reference site R, where the stream is disconnected from the peatland.
Table 1. Soil characteristics and CHNSO content. Sampling
sites
Stream
distance Soil profile pH % C % S % N % O
Pumping site
P Close 0–15 cm : peaty soil
4.7 26.6 ± 1.18 0.3 ± 0.0 1.9 ± 0.0 18.9 ± 0.2 15–50 cm : clay loam
oxidized 50 cm : peat Distant 0–10 cm : peaty soil
4.4 32.9 ± 0.8 0.5 ± 0.0 2.3 ± 0.0 22.1 ± 0.3 10–30 cm : clay loam oxidized 30 cm : peat Reference site R Close 0–15 cm : soil 5.8 40.1 ± 3.1 ND 1.9 ± 0.0 15.4 ± 1.2 15–50 cm : ballast 50 cm :peat Distant 0–∞ cm : peat 5.2 24.7 ± 1.5 0.5 ± 0.1 2.5 ± 0.2 27.6 ± 2.4
Table 2. Chemical parameters measured in peat groundwater. Grey parts represent the high water period ranging from October to May.
Eh (mV/ESH) Referenc e site R 4/8/200 3 6/16/200 3 12/2/200 3 3/16/200 4 5/4/200 4 9/21/200 4 11/8/200 4 1/4/200 5 3/1/200 5 Mea n Std. Dev. Mean high water s Mean low water s R2 87 137 653 677 610 289 602 665 550 474 237 626 171 R3 16 107 510 508 463 264 418 522 519 370 194 490 129 R4 48 89 482 499 491 265 387 515 447 358 181 470 134 R6 159 163 400 417 463 299 352 470 504 359 128 434 207
(R2–R6 from the stream to the peat) 390 187 505 160
Pumping site P
P8 294 184 368 397 446 325 365 479 459 369 93 419 268
P4 134 157 433 419 465 319 333 472 487 358 134 435 203 P2 237 196 433 375 485 427 474 607 544 420 134 486 287
(P8–P2 from the stream to the pumping station) 382 120 447 253
pH (pH units) Reference site R 4/8/200 3 6/16/200 3 12/2/200 3 3/16/200 4 5/4/200 4 9/21/200 4 11/8/200 4 1/4/200 5 3/1/200 5 Mean Std. Dev. Mean high waters Mean low waters R2 5.7 5.9 3.3 4.2 3.6 4.9 4.3 4.0 4.2 4.5 0.9 3.9 5.5 R3 6.2 6.2 6.3 6.1 5.8 5.9 6.5 6.2 5.8 6.1 0.2 6.1 6.1 R4 6.6 6.1 6.3 6.4 6.1 6.0 6.6 6.6 6.4 6.3 0.2 6.4 6.2 R6 6.3 6.4 6.4 6.5 6.4 6.1 6.7 6.8 6.5 6.5 0.2 6.6 6.3
(R2–R6 from the stream to the peat) 5.8 0.9 5.8 6.0
Pumping site P
P8 6.9 6.2 6.8 6.9 6.9 6.3 6.9 6.7 6.6 6.7 0.3 6.8 6.5
P4 6.4 5.8 6.4 6.5 6.8 6.4 6.4 6.6 6.5 6.4 0.3 6.5 6.2
P2 6.7 6.5 6.3 6.8 6.8 4.3 5.5 4.9 4.8 5.8 1.0 5.9 5.8
(P8–P2 from the stream to the pumping station) 6.3 0.7 6.4 6.2
DOC (mg/L) Reference site R 4/8/200 3 6/16/200 3 12/2/200 3 3/16/200 4 5/4/200 4 9/21/200 4 11/8/200 4 1/4/200 5 3/1/200 5 Mean Std. Dev. Mean high waters Mean low waters R2 70 64 16 21 25 29 21 28 36 34 19 24 54 R3 99 88 71 54 49 48 51 48 43 61 20 53 78 R4 111 105 97 84 78 81 85 77 69 87 14 82 99 R6 97 94 89 77 71 66 67 69 65 77 13 73 86
(R2–R6 from the stream to the peat) 65 26 58 79
Pumping site P
P8 27 23 23 19 16 10 14 23 15 19 6 18 20
P4 67 63 55 47 21 39 45 43 39 47 14 42 56
P2 53 54 57 36 15 14 32 10 9 31 20 26 40
(P8–P2 from the stream to the pumping station) 32 18 29 39
Cl (mg/L) Reference site R 4/8/200 3 6/16/200 3 12/2/200 3 3/16/200 4 5/4/200 4 9/21/200 4 11/8/200 4 1/4/200 5 3/1/200 5 Mean Std. Dev. Mean high waters Mean low waters R2 21 22 25 23 21 20 22 27 23 23 2 23 21 R3 18 18 17 15 17 13 13 15 14 16 2 15 16 R4 15 15 15 14 17 14 15 18 18 16 2 16 15 R6 18 18 22 17 21 16 17 19 18 18 2 19 17
(R2–R6 from the stream to the peat) 18 3 18 17
Eh (mV/ESH) Referenc e site R 4/8/200 3 6/16/200 3 12/2/200 3 3/16/200 4 5/4/200 4 9/21/200 4 11/8/200 4 1/4/200 5 3/1/200 5 Mea n Std. Dev. Mean high water s Mean low water s P8 34 34 32 32 34 29 29 32 31 32 2 32 32 P4 39 38 40 38 39 33 34 39 38 38 2 38 37 P2 21 21 24 23 23 19 19 22 21 21 2 22 20
(P8–P2 from the stream to the pumping station) 30 7 31 30
NO3 (mg/L) Reference site R 4/8/200 3 6/16/200 3 12/2/200 3 3/16/200 4 5/4/200 4 9/21/200 4 11/8/200 4 1/4/200 5 3/1/200 5 Mean Std. Dev. Mean high waters Mean low waters R2 0.0 0.0 26.0 14.0 0.0 0.0 16.0 9.0 5.6 7.8 9.3 11.8 0.0 R3 0.0 0.0 9.0 12.5 13.5 3.5 16.3 15.5 13.0 9.3 6.5 13.3 1.2 R4 0.0 0.0 16.0 18.0 22.0 2.0 20.0 24.0 23.0 13.9 10.2 20.5 0.7 R6 4.0 0.0 6.0 27.0 33.0 5.0 3.0 33.5 34.0 16.2 15.1 22.8 3.0
(R2–R6 from the stream to the peat) 11.8 10.8 17.1 1.2
Pumping site P
P8 0.0 3.3 14.4 14.7 15.3 6.0 13.4 13.7 14.2 10.6 5.8 14.3 3.1
P4 0.0 0.0 10.6 10.8 11.3 7.0 8.8 12.6 11.0 8.0 4.8 10.8 2.3
P2 0.0 0.0 7.5 11.2 12.1 1.4 0.6 4.0 6.2 4.8 4.7 6.9 0.5
(P8–P2 from the stream to the pumping station) 7.8 5.5 10.7 2.0
SO4 (mg/L) Reference site R 4/8/200 3 6/16/200 3 12/2/200 3 3/16/200 4 5/4/200 4 9/21/200 4 11/8/200 4 1/4/200 5 3/1/200 5 Mean Std. Dev. Mean high waters Mean low waters R2 169 138 1171 481 386 500 482 304 243 430 309 511 269 R3 152 125 89 104 132 164 153 162 162 138 27 134 147 R4 66 49 33 34 47 60 56 57 61 51 12 48 58 R6 0 0 1 12 22 9 5 10 16 8 8 11 3
(R2–R6 from the stream to the peat) 157 223 176 119
Pumping site P
P8 127 133 98 101 108 127 106 111 111 113 13 105 129
P4 35 26 23 29 34 57 51 55 56 41 14 41 39
P2 20 17 42 115 177 458 485 475 409 244 209 284 165
(P8–P2 from the stream to the pumping station) 133 144 144 111
Cl/SO4 (mg/L) Reference site R 4/8/200 3 6/16/200 3 12/2/200 3 3/16/200 4 5/4/200 4 9/21/200 4 11/8/200 4 1/4/200 5 3/1/200 5 Mean Std. Dev. Mean high waters Mean low waters R2 0.12 0.16 0.02 0.05 0.05 0.04 0.05 0.09 0.09 0.08 0.05 0.06 0.11 R3 0.12 0.14 0.19 0.14 0.13 0.08 0.08 0.09 0.09 0.12 0.04 0.12 0.11 R4 0.23 0.31 0.45 0.41 0.35 0.23 0.27 0.31 0.30 0.32 0.08 0.35 0.26 R6 30.71 1.42 0.95 1.78 3.15 1.86 1.10 5.85 10.9 9 6.53 1.78
(R2–R6 from the stream to the peat) 1.34 5.23 1.77 0.32
Pumping site P
P8 0.26 0.26 0.33 0.32 0.31 0.23 0.27 0.29 0.28 0.28 0.03 0.30 0.25
P4 1.45 1.72 1.32 1.15 0.58 0.67 0.71 0.68 1.04 0.43 1.04 1.02
P2 1.03 1.25 0.58 0.20 0.13 0.04 0.04 0.05 0.05 0.37 0.47 0.17 0.77
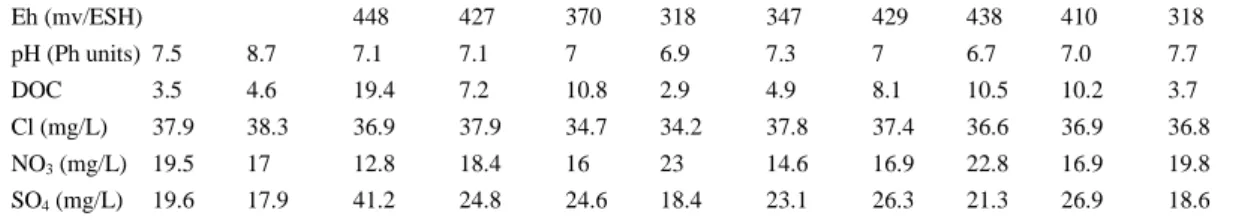
Table 3. Chemical parameters measured in the stream and precipitations. Stream 4/8/2003 6/16/2003 12/2/2003 3/16/2004 5/4/2004 9/21/2004 11/8/2004 1/4/2005 3/1/2005 Mean high waters Mean low waters Eh (mv/ESH) 448 427 370 318 347 429 438 410 318 pH (Ph units) 7.5 8.7 7.1 7.1 7 6.9 7.3 7 6.7 7.0 7.7 DOC 3.5 4.6 19.4 7.2 10.8 2.9 4.9 8.1 10.5 10.2 3.7 Cl (mg/L) 37.9 38.3 36.9 37.9 34.7 34.2 37.8 37.4 36.6 36.9 36.8 NO3 (mg/L) 19.5 17 12.8 18.4 16 23 14.6 16.9 22.8 16.9 19.8 SO4 (mg/L) 19.6 17.9 41.2 24.8 24.6 18.4 23.1 26.3 21.3 26.9 18.6 Precipitations 4/8/2003 6/16/2003 12/2/2003 3/16/2004 5/4/2004 9/21/2004 11/8/2004 1/4/2005 3/1/2005 Mean high waters Mean low waters Eh (mv/ESH) 367 400 pH (Ph units) 7.4 7 6.7 7.3 DOC 4.2 4.2 5.8 0 Cl (mg/L) 10.3 6.4 4.4 9.3 5.7 19.2 17.1 10.7 12.1 7.5 NO3 (mg/L) 4.8 6.2 2.1 11.4 7.8 7.6 5.7 5.8 6.5 6.3 SO4 (mg/L) 4.2 5 1.5 4.1 3.1 3.9 3.7 4.3
Fig. 4. Distribution of carbon, chloride, nitrate (a) and sulphate (b) concentrations measured in peat groundwater. Black lines represent the q10, q90 and median values, crosses: mean values and triangles: minimal and maximal values.
Table 4. Physico-chemical parameters at the end of experiments.
Sampling Oxygenation condition
Physico chemical parameters pH T °C Eh corrected (standard) pε Site Pumping site P Close Anaerobiosis 5.3 25.8 171 0.300 Aerobiosis 3.7 20.3 179 0.318 Distant Anaerobiosis 5 26.9 126 0.219 Aerobiosis 4.5 20.3 204 0.363 Reference site R Close Anaerobiosis 6.7 25.6 113 0.198 Aerobiosis 6.1 20.3 208 0.371 Distant Anaerobiosis 5.6 25.8 144 0.252 Aerobiosis 5.3 20.3 167 0.297
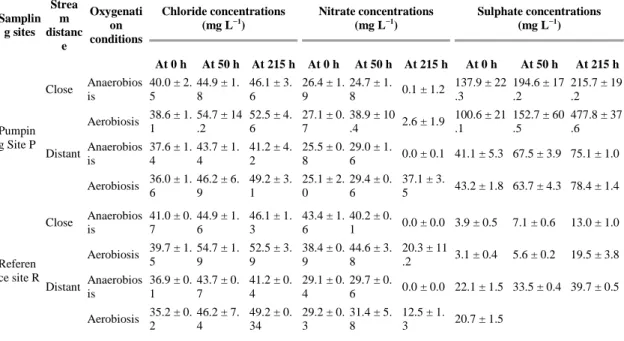
Table 5. Mean chloride, nitrate and sulphate concentrations during the experiments. Each concentration represents the mean of three replicates with the standard error.
Samplin g sites Strea m distanc e Oxygenati on conditions Chloride concentrations (mg L−1) Nitrate concentrations (mg L−1) Sulphate concentrations (mg L−1) At 0 h At 50 h At 215 h At 0 h At 50 h At 215 h At 0 h At 50 h At 215 h Pumpin g Site P Close Anaerobiosis 40.0 ± 2.5 44.9 ± 1.8 46.1 ± 3.6 9 26.4 ± 1.24.7 ± 1.8 0.1 ± 1.2 137.9 ± 22.3 194.6 ± 17.2 215.7 ± 19.2 Aerobiosis 38.6 ± 1.1 54.7 ± 14.2 52.5 ± 4.6 27.1 ± 0.7 38.9 ± 10.4 2.6 ± 1.9 100.6 ± 21.1 152.7 ± 60.5 477.8 ± 37.6 Distant Anaerobios is 37.6 ± 1. 4 43.7 ± 1. 4 41.2 ± 4. 2 25.5 ± 0. 8 29.0 ± 1. 6 0.0 ± 0.1 41.1 ± 5.3 67.5 ± 3.9 75.1 ± 1.0 Aerobiosis 36.0 ± 1. 6 46.2 ± 6. 9 49.2 ± 3. 1 25.1 ± 2. 0 29.4 ± 0. 6 37.1 ± 3. 5 43.2 ± 1.8 63.7 ± 4.3 78.4 ± 1.4 Referen ce site R Close Anaerobios is 41.0 ± 0. 7 44.9 ± 1. 6 46.1 ± 1. 3 43.4 ± 1. 6 40.2 ± 0. 1 0.0 ± 0.0 3.9 ± 0.5 7.1 ± 0.6 13.0 ± 1.0 Aerobiosis 39.7 ± 1. 5 54.7 ± 1. 9 52.5 ± 3. 9 38.4 ± 0. 9 44.6 ± 3. 8 20.3 ± 11 .2 3.1 ± 0.4 5.6 ± 0.2 19.5 ± 3.8 Distant Anaerobios is 36.9 ± 0. 1 43.7 ± 0. 7 41.2 ± 0. 4 29.1 ± 0. 4 29.7 ± 0. 6 0.0 ± 0.0 22.1 ± 1.5 33.5 ± 0.4 39.7 ± 0.5 Aerobiosis 35.2 ± 0. 2 46.2 ± 7. 4 49.2 ± 0. 34 29.2 ± 0. 3 31.4 ± 5. 8 12.5 ± 1. 3 20.7 ± 1.5