HAL Id: hal-01103980
https://hal.archives-ouvertes.fr/hal-01103980
Submitted on 29 Mar 2016HAL is a multi-disciplinary open access archive for the deposit and dissemination of sci-entific research documents, whether they are pub-lished or not. The documents may come from
L’archive ouverte pluridisciplinaire HAL, est destinée au dépôt et à la diffusion de documents scientifiques de niveau recherche, publiés ou non, émanant des établissements d’enseignement et de
Experimental modeling of Wiener filters estimated on an
operating diesel engine
Julie Drouet, Q. Leclere, Etienne Parizet
To cite this version:
Julie Drouet, Q. Leclere, Etienne Parizet. Experimental modeling of Wiener filters estimated on an operating diesel engine. Mechanical Systems and Signal Processing, Elsevier, 2015, 50, pp.646 - 658. �10.1016/j.ymssp.2014.05.027�. �hal-01103980�
Experimental modeling of Wiener filters
estimated on an operating diesel engine
Julie Drouet
aQuentin Lecl`ere
a,∗ Etienne Parizet
aaLaboratoire Vibrations Acoustique, INSA Lyon, 25 bis avenue Jean Capelle F-69621 Villeurbanne Cedex, FRANCE
Abstract
Sound source separation in diesel engines can be implemented using a Wiener filter, or spectrofilter, that can extract the combustion contribution in the overall noise. In this study this filter characterizes the transfer function between a cylinder pres-sure and a meapres-surement point. An engine is characterized by several filters (one for each cylinder) which are estimated for many operating conditions (engine speed and load). A purpose of this work is to obtain an averaged spectrofilter allowing the synthesis of combustion noise in all operating conditions. This synthesis should be accurate enough to be used in perceptive studies. In order to refine the spectrofilter estimation in the medium frequency band, this paper consists in taking advantage of the multitude of information given by the estimations from different operating conditions. To do this, an experimental model is adopted so modal parameters are extracted from the great number of measured filters. Different procedures as the ESPRIT method or the LSCE method (modal analysis) are used to decompose the impulse responses on a complex exponential basis. The spectrofilters estimated from different operating conditions are analyzed and compared in this reduced basis, in order to identify the underlying structural parameters. These parameters are com-pared to the results of an experimental characterization of the stopped engine. The accuracy of the synthesis (number of components of the filter) is an important issue because these filters will be used in perceptive applications, extracting combustion noises.
This paper is an extended version of the work initially presented at the conference Surveillance 6 in november 2011 in Compi`egne, France [1].
Key words: Wiener filter, diesel engine combustion noise, source separation, modal estimation
∗ Corresponding author. Fax: 33.4.72.43.87.12. E-mail address: quentin.leclere@insa-lyon.fr.
Introduction
Noise from diesel engines is a major source of annoyance for car passengers and people outside the vehicle. This has led to many studies aiming at re-ducing this noise, which is partly due to the high pressure combustion in the cylinders, but also to mechanical sources involved in the engine operation (dis-tribution, belts, impacts due to clearances in mechanical joints). It is therefore very important to identify the contribution of potential sources, in order to implement efficient noise reduction solutions. Several studies are dedicated to this issue. Firsts results are obtained from the comparison between different operating conditions: it is shown in [2] how mechanical and combustion con-tributions to the overall noise are varying with operation. Under a certain combustion pressure level, called the critical cylinder pressure level, the noise level does not vary: it means that the mechanical noise dominates the en-gine noise. Above this limit, the noise level increase linearly in function of the combustion pressure level: the engine noise is thus mainly due to combustion. Another approach, studied in [3], is based on the comparison between the engine operating by itself and driven with an eletric motor. The difference be-tween noise levels are considered as the contribution of the combustion. This study shows the benefits of the indirect injection technology over the standard direct injection, concerning the combustion noise reduction. Of course these methods are based on the rough assumption that the mechanical sources are not affected by changes in the loading conditions.
Several papers are studying the possibility to use signal processing tools to separate the contribution of combustion in the overall engine noise [4–6]. The idea is to use the coherence between the acoustic pressure outside the engine and cylinder pressure signals, measured using pressure sensors introduced in the cylinders through the cylinder head. However, there is a strong difficulty due to the fact that mechanical excitations are strongly coherent with the cylinder pressure signals, making it difficult to obtain a valuable result. How-ever, this difficulty can be overcome by introducing some randomness in the injection, as shown in [7], but this approach is somewhat intrusive, and not without effect on the engine operation.
The characterization of the transfer between the cylinder pressure and the acoustic pressure outside the engine is not new. Pioneer studies [8] are defining the structural attenuation as the difference between engine noise and cylinder pressure spectra, in decibels (dB). It is shown that this structural attenuation is relatively constant when changing operating conditions, and that structural attenuations of different engines are quite similar. The outcome of these works has been the commercialization of a measurement system called the Combus-tion Noise Meter [9], which consists in filtering the cylinder pressure by a typical structural response plus an A-weighting curve, to finally give the con-tribution of the combustion to the overal noise. But this approach does not use any microphone, and the result only gives a relative indication of the
com-bustion noise level, allowing to estimate for instance the effect of some changes in the injection map on the combustion noise. The structural attenuation, as defined here, is a ratio between two power spectral densities, often studied in octave or third octave bands. It gives an estimation of the modulus of the linear filter between the cylinder pressure and the acoustic pressure, averaged in frequency bands. Thus, it does not allow the direct synthesis of the acoustic pressure from cylinder pressures, which is required to consider the separation of mechanical and combustion contributions in the time domain.
Several works are reported in the literature, addressing the issue of diesel engines source separation in the time domain [10,11]. The most convincing studies belong to the family of supervised source separation approaches: the source (cylinder pressures) is measured, and its contribution to the measured output (microphone) is to be estimated. It has been shown quite recently [12– 14] how to implement cyclostationarity tools in this context. Suppressing the periodic parts of signals overcomes the difficulty of high correlation between combustion and mechanical excitations [14]. One result of this operation is that filters obtained from random parts of input and output signals are much more stable to changes in operating conditions than filters obtained with raw signals.
The aim of this paper is to show how the filters estimated with these ap-proaches can be used to analyse the structural response of the engine in oper-ation. The originality of this work mainly concerns two aspects. The first one is that the spectrofilters resulting from the source separation algorithm are compared to transfer functions measured with an impact hammer, with the engine stopped. It is shown how this comparison can be used to analyze the transmission paths of the combustion noise. The second original contribution is the application of modal analysis approaches (LSCE [15] and ESPRIT[16,17]), aiming to compare filters obtained at different operating conditions in a modal framework.
The first part of this work is dedicated to some general considerations about engine noise sources, and to the transmission paths of the combustion noise. The second part presents spectrofilters obtained from measurements in operat-ing conditions. These spectrofilters are compared to standard impact hammer FRF measurements on the stopped engine. Then, the basic theory of ESPRIT and LSCE is exposed in the third section, highlighting the similarities and differences between these two methods. They are also compared in practice with an application on a synthetic signal. Finally, in the last section, ESPRIT is carried out on the spectrofilters measured in operation, pointing out the limits of the approach.
1 Diesel engine noise sources and combustion noise transmission paths
Diesel engines are complex mechanical systems, in which many sources are contributing to the overall noise. There are several ways of classifying en-gine noise sources. The classification used in this work, shown in Fig. 1, is loosely based on the literature [18,19]. The internal sources are separated into
Fig. 1. Classification of diesel engine internal excitation and radiated noise.
three categories: the combustion, generating high pressure pulses on internal faces of the combustion chamber, the load-independent mechanical sources, whose behavior is affected only by the rotation speed, and the load-dependent mechanical sources, whose amplitude generally increase with the load. For instance inertia loads and distribution (camshaft, valves) belong to the class of load-independent sources, while the injection system (injectors, injection circuit, high pressure fuel pump) is a load-dependent source. This classifica-tion has the advantage to be closely linked to the physical phenomena, but it has also limitations. Some difficulties appear for instance when considering the excitation generated by the piston on the cylinder block, resulting from a combination of the three categories.
This work is focusing on the combustion noise, resulting from the high pressure pulses in the combustion chamber generated by the auto-ignition of the fuel-air mixture. This pressure pulses are distributed on the combustion chamber walls: the cylinder head, the very top of the cylinder and the piston. The loads directly applied to the cylinder block (the cylinder head and the very top of the cylinder) are responsible of the so-called direct gaz path (see Fig. 2). The loads
Fig. 2. Combustion noise transmission paths in diesel engines.
applied to the piston are transmitted transversely to the cylinders (indirect transverse path) and to the crankshaft bearings through the connecting rod and crankshaft (indirect vertical path). The loads at the crankshaft bearings are mainly vertical loads, but the elasticity of the whole mechanism generates also moments inducing the bending deflection of bearings (see [20,21]). The characterization and ranking of these transmission paths is of prime in-terest to be able to conceive efficient noise reduction solutions. An inin-terest of this work is to show how the filters obtained from the source separation al-gorithm can be used by mechanical engineers to get useful information about this issue.
2 Determination of spectrofilters
2.1 Experimental setup
Measurements have been realized on a 1.9 L dci diesel engine. Two accelerom-eters (PBC) are mounted vertically, one inside the engine on the external bearing cap crankshaft ♯1 (distribution side), and the other one on the cylin-der head in front of cylincylin-der ♯1 (distribution side too). A microphone (BK) was placed 36 cm above the engine (see Fig. 3).
Firstly, according to the method described in [14], Wiener filters have been estimated on the operating engine, from additional measurement of cylinder pressure and crankshaft angle. Signals were centered by removing the cyclic average, and windowed with a Tukey window (window’s length equal to ap-proximately a quarter of engine cycle). The cyclic average is synchronized for each cylinder to the corresponding TDC, using the angle encoder signal. The total length of each recording is 30seconds, that is to say about 200 and 350 engine cycles at 810 and 1300 rpm. The whole computational details are given in [22]. H1 estimators were then computed between each couple (accelerometer - microphone) / cylinder pressure.
Secondly, to get a set of response functions determined by conventional meth-ods an impact hammer study has been conducted on the (still hot) engine with the same response transducers. The impact was realized vertically on the cylinder head, just above the cylinder ♯1 (see Fig. 3). Even if the combustion excitation could not be reproduced, the structure was the same, and could emphasize similar modal parameters.
Fig. 3. Microphone position (left). External accelerometer and impact point location (right).
2.2 Analysis of measured response functions
Combustion excitations are equivalent to spatially distributed impacts on the cylinder head and the top of the cylinder (later on called gas excitation path), and on the cylinder and bearing via moving parts (piston-crankshaft path). The hammer excitation point was closed to the piston so that it can be hypoth-esized that the same paths contributed to the measurements in the stopped conditions. The spectrofilter between the external accelerometer and the cylin-der ♯1 is drawn in Fig. 4 in addition to the response function between the same accelerometer and the impact hammer. The modulus of the spectrofilters was
divided by the cylinder section, in order to obtain a response function in ms−2N−1.
Fig. 4. FRF magnitude for the cylinder head accelerometer, for different operating points (810 rpm (dash-dot blue), 1300rpm with 92Nm (dash red) and 150Nm (solid green)) and for the impact hammer (engine stopped) (solid black)
Identified FRFs (frequency response function) for operating and stopped en-gine are similar between 1 kHz and 3 kHz, which implies that the cylinder head impact is similar to the combustion excitation, emphasizing the predom-inance of the gas excitation path (which could be expected for an accelerometer placed on the cylinder head).
Fig. 5. FRF magnitude for the bearing cap accelerometer for different operating points (810 rpm (dash-dot blue), 1300rpm with 92Nm (dash red) and 150Nm (solid green)) and for the impact hammer (engine stopped)(solid black)
For the internal accelerometer placed on the bearing cap (Fig. 5), FRF ob-tained from the impact strongly underestimates the spectrofilter between 1 and 2 kHz. This can be explained by the deformation of the bearing [23] -which is submitted to a high constraint when the engine is running. This is not reproduced by the impact on the cylinder head on stopped engine. The important peak observed around 1.5 kHz on the spectrofilters does not appear on the impact response. This peak can be attributed to the piston-crankshaft path of the combustion noise, and is probably due to a modal behavior of the whole path. This observation agrees with results of the literature [18].
Fig. 6. FRF magnitude for microphone for different operating points (810 rpm (dash-dot blue), 1300rpm with 92Nm (dash red) and 150Nm (solid green)) and for the impact hammer (engine stopped)(solid black)
For the microphone measurements (Fig. 6), the propagation phenomenon is more complex, because of the acoustic radiation and propagation. However, similar observations can be made : for frequencies up to 1.2 kHz, the impact overestimates the response because of the cancellation of gas-excitation and piston-crankshaft paths happening during operation. Above 1.8 kHz the level of the impact response is similar to the spectrofilters ones, which means that the cancellation effect is no more present and that the overall radiated sound level does not dependent on the excitation location. The same analysis for calculated response functions can be found in the literature [11].
3 Presentation of the ESPRIT and LSCE methods
3.1 Theory
Both methods decompose the measured signal on a complex exponential basis :
s(t) = ℜehPK
k=1rkeλkt
i
(1) When the signal is sampled, this can be written as:
sn= ℜe "K X k=1 rkzn−1k # , n ∈ [1...N ] (2) With zk = eλk∆t (3) λk = −δk+ j ωdk = −αkωuk+ j ωuk q 1 − α2 k (4)
δk is the damping factor, αk the damping ratio, ωuk the undamped natural
frequency and ωdk the damped natural frequency of mode k, the complex
coefficients rk are called the residues.
The goal of these methods is to identify the poles zk and then compute the
residues rk to assess the signal sn. Once the poles are identified the damping
ratio and the undamped natural frequency can easily be determined.
ESPRIT is a high resolution modal analysis method [16,17,24] based on par-ticular properties of the signal autocorrelation matrix. It is widely used in musical applications to extract modal components with very close frequen-cies, as developed in [25]. The LSCE method is a well known SDOF parameter estimation algorithm [15], available in standard modal analysis softwares [26].
3.1.1 Pole identification
The first step consists in identifying poles from a hypothesis on the number of components K. The signal decomposition (1) implies couples (rk, λk) and
(r∗
k, λ∗k) represent the same component. Thus searching for 2K complex poles
will allow the identification of K different components.
Both methods organize the signal in a Hankel matrix. For the ESPRIT method, the number of lines, denoted as n, depends on the analyzed signal length N . It must be chosen between N/3 and 2N/3 according to [25]. In the LSCE method, the number of columns of the Hankel matrix is equal to 2K.
Xesprit = x1 · · · xN −n−1 ... ... ... xn · · · xN −1 (5) Xlsce = x1 · · · x2K ... . .. ... xN −2K · · · xN −1 (6)
There are no other direct similarities between the two methods. ESPRIT uses auto-correlation matrix RXX = 1lXXH, which is decomposed in eigenvalues.
The eigenvectors wi corresponding to the 2K largest eigenvalues are used to
construct a Φ matrix. Let W be the matrix composed of the wi vectors in
columns. W↑ is obtained from W by removing it first line and W↓ by removing
the last line of W . Φ is defined as :
Φ = W↓+W↑ (7)
where W↓+ represents the pseudo-inverse of W↓. The eigenvalues of Φ are the
poles zk, from which modal parameters are deduced from equations (3) and
(4).
The LSCE method is based on the assumption that the studied system can be described by a linear differential equation with constant coefficients of order 2K. A2k d dt !2K x(t) + · · · + A0x(t) = 0 (8)
2K+1
X
k=1
akxn+k−1 = 0 (9)
a2K+1 is arbitrarily fixed to 1 to identify coefficients ak(k ∈ [1 . . . 2K]). Thus
each xn(n ∈ [2K + 1 . . . N ]) value is a function of the 2K preceding values.
This leads to the follow system :
Xlsce a1 ... a2K = − x2K+1 ... xN (10)
This system has to be inverted. The unicity of the solution implies K < 4N , so that the system is over-determined and can be resolved by pseudo-inversion.
a1 ... a2K = −Xlsce+ x2K+1 ... xN (11)
Each component of discrete signal xn, is written as rzn−1, and has to be a
solution of (9). This leads to the polynomial equation (12), the roots of which are the poles to be identified.
2K+1
X
k=1
akznk−1 = 0 (12)
Only complex roots with a positive imaginary part are retained.
3.1.2 Identification of the residues
The identification of residues is made by a pseudo-inversion of the system constructed from equation (2) :
[rk] = V+x (13)
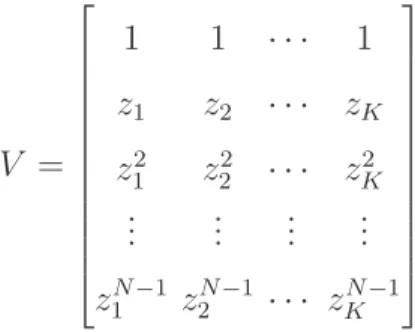
where r and x represent the residues and the signal. V is the Vandermonde matrix, determined from the K identified poles.
V = 1 1 · · · 1 z1 z2 · · · zK z2 1 z 2 2 · · · z 2 K ... ... ... ... zN −1 1 z2N −1 · · · zKN −1 (14)
The signal reconstruction s is obtained from the following equation :
s = 2ℜe([rk]V ) (15)
3.2 Application on a synthetic signal
As the modal components of the spectrofilters are unknown, the properties of the methods are evaluated using a synthetic signal, illustrated in Fig. 7. The undamped natural frequencies of this signal are defined between 500 to 5000 Hz, regularly spaced of 150 Hz, giving a whole number of 31 modes. The damping ratio decreases proportionally to the inverse of the natural frequencies and varies between 0.07 and 0.007. There is no noise added to the synthetic signal.
Fig. 7. Normalized impulse response of a Wiener filter (dash green) and normalized synthetic signal (solid blue) in the time (top) and frequency (bottom) domains
The choice of the number of extracted components K is crucial for both meth-ods. If it is lower (or higher) than the real number of signal components the computation will be normally called under (or over)-estimated. When these numbers are exactly the same (ideal conditions) the methods should both identify the true components of the signal.
The under-estimation of the modes theoretically brings to false identification. True and identified poles are drawn in Fig. 8 in the complex plane. The angle between 0 and π represents the damped natural frequencies varying between 0 and F s/2. The modulus represents the damping : close to unity when the damping is low (<<1); lower than unity if the damping is high; and greater than unity when the damping is negative (non physical increasing exponential envelope). ESPRIT succeeds to extract twenty poles in the correct range of frequency and damping. Poles identified with LSCE are strongly different from the true ones. This difference can be explained by Fig. 9. ESPRIT identifies poles only in the frequency range of the spectrofilter, whereas LSCE searches
poles over the whole frequency range between 0 and F s/2. Fig. 9 is another representation of these observations giving an information about the modal density of filters averaged by 500 Hz frequency bands.
Fig. 8. Poles of the synthetic signal (black circles), poles identified in under-estima-tion (K = 20) for LSCE (blue x-mark) and ESPRIT (red plus)
Fig. 9. Number of modes identified in 500 Hz wide bands for the synthetic signal (solid black) and in under-estimation (K = 20) for LSCE (solid blue) and ESPRIT (dash red)
When the number of components is over-estimated, the true components are identified by both methods, in addition to other wrong components to satisfy the expected K value. Nonetheless, below 105 required modes LSCE cannot extract all the true components. To understand this phenomenon the extracted poles, in ideal conditions (K = 31) for the two methods, and for K = 105 for LSCE, are plotted in Fig. 10.
Fig. 10. Poles of the synthetic signal (black circles), poles identified in ideal condi-tions (K = 31) for ESPRIT (red x) and LSCE (blue plus) and in over-estimation (K=105) for LSCE (purple dots)
The necessity of LSCE to be carried out with a strong over-estimation of K is explained by the fact that it finds modes in the overall frequency domain, whereas ESPRIT works only in frequency bands of high energy. The number of modes by 500 Hz frequency bands is drawn in Fig. 11, for true and identified poles. The modal density of ESPRIT is strictly equal to the true one, the poles being exactly recognized. For LSCE, between 500 to 5000 Hz, the modal density is clearly underestimated for K = 31, and wrong modes are determined outside this frequency range. The correct modal density is found for K = 105, i.e 31 in the frequency range 500-5000 Hz, but 74 ”computational” modes are also identified in high frequency, almost regularly spaced between 5000 and F s/2.
Fig. 11. Number of modes identified in 500 Hz wide bands for the synthetic signal (solid black) and in ideal conditions (K = 31) for ESPRIT (dot red) and LSCE (dash-dot blue) and in over-estimation (K=105) for LSCE (dash-dot purple)
These observations bring out that signals should be resampled in function of the studied frequency range, to avoid LSCE to identify non physical modes in the high frequency range. Because the aim of the study is the information reduction of the spectrofilter, in the following of the paper the components number are voluntary underestimated. Considering these results on synthetic
data, the ESPRIT method is preferred to LSCE for the modal analysis of measurements.
3.2.1 Sensitivity to additive noise
In order to assess the robustness of the ESPRIT method, the identification of poles in ideal conditions (K = 31) is carried out with an additive noise of 1 and 10 %, (signal to noise ratios equals to respectively 40 and 20dB). The poles identified by ESPRIT in noisy conditions are shown in Fig. 12. The results for 1% noise are satisfying : all the poles are correctly identified. For a noise level of 10 %, some poles (6 over 31, about 20 %) are identified at a wrong place in the complex plane. These observations illustrate the potential effects of uncertainties on the extraction of the poles. However, the filters obtained in operation are assessed on a large number of signal realizations (engine cycles), and the estimation uncertainties are expected to be relatively controlled.
Fig. 12. Poles of the synthetic signal (black circles), poles identified in ideal condi-tions (K = 31) for ESPRIT (red x) with an additive noise of 10% (top) and 1% (bottom).
4 Modal analysis of measurements
In the following ESPRIT method has been applied to the measured FRFs ( see part 1). Results are given for the Wiener filters relating the cylinder pres-sure ♯1 and the prespres-sure meapres-sured above the engine. The modal density of the structure is rather high (about 800 modes between 500 and 5000 Hz, according to a finite element model presented in [27]). The number of extracted compo-nents K was set to 150 to minimize the estimation error of the reconstructed signal, so it is under-estimated as expected.
Fig. 13 shows that the signal reconstruction is correct for frequencies higher than 1.5 kHz. The discrepancy appearing in the low frequency range can be due to a lower energy in this range : modal parameters are mainly identified in high energy areas. This phenomenon can be corrected with an analysis conducted by frequency bands [28] or using spectral whitening [17].
Fig. 13. Microphone / cylinder ♯1 FRF magnitude at 1300 rpm and 92 Nm, for measurement (dash black) and estimated signals for ESPRIT (dot red) and whitened ESPRIT (solid blue)
For the spectrofilters a spectral whitening is preferred to a frequency band analysis, because the number of dominant modes in each band cannot be
easily estimated. In this study, whitening has been applied between 200 and 5000 Hz, in 600 Hz wide bands. In each band, the filtered signals are weighted by the inverse of their RMS values, and then summed to obtain the whitened spectrofilter. The poles are extracted from this whitened filter, but the signal reconstruction (after the identification of residues) is done on the original signal.
Fig. 14. Microphone / cylinder ♯1 FRF magnitude at stopped engine, for measure-ment (solid black) and estimated signals for ESPRIT (dash red)
Fig. 15. Averaged damping ratio of FRFs (microphone measurements) computed in 500 Hz wide frequency bands for the impact (solid black), at 810 rpm (solid blue with x-mark), 1300 rpm and 92 Nm (dash red with plus) or 150 Nm (solid green with circle)
For the frequency response obtained with the impact hammer, whitening is not necessary because the dynamic range (about 15dB) is much lower than the one obtained in operation (about 30dB). It can be seen in Fig. 14 than ESPRIT estimation fits well the measured FRF on the whole frequency range. Fig. 15 shows the damping ratios averaged in 500Hz wide frequency bands. These ratios decrease with the frequency. Slopes are similar in all cases, but the estimated damping ratios in operating conditions seem to increase with the rotational speed of the engine.
Fig. 16. Normalized impulse responses and used Tukey windows at 1300 rpm (left in solid red) and 810 rpm (right in solid blue)) compared to the impact response (dash-dot black)
That may be due to the windowing applied during the spectrofilter calculation. For 1300 rpm, the temporal window length, corresponding to about one stroke [14], is short as compared to the impulse response length of the engine block. This windowing leads to an overestimation of the damping. This phenomenon is illustrated in Fig. 16.
Windowing shortens the duration of the Wiener filter impulse response when the rotational speed increases, which means that the damping ratios will be artificially increased as compared to the damping ratio estimated from the impact. The lengths of spectrofilters are well correlated with the lengths of the one-stroke windows, confirming the effect of the windowing on the over-estimation of the damping, which is about 30% at idle (810rpm), and 45% at 1300 rpm.
5 Effects of the spectrofilter estimation errors on the synthesized combustion noise level
In the previous section, it has been shown that the length of the window which is used in the spectrofilter estimation has a significant effect on the identified structural parameters. The damping can be greatly overestimated when the window length is shortened, due to the increase of the engine rotation speed. The consequence is that the levels of the combustion noise synthesized using such filters is expected to be underestimated. An additional computation was conducted in order to confirm those expectations. The combustion noise was synthesized for a high engine speed (2800rpm), using spectrofilters between the cylinder pressures and the microphone point estimated at 3 different speeds : idle (810 rpm), 1800rpm, and 2800rpm. The combustion noise is synthesized simply by convolving 30 seconds of the 4 cylinder pressure signals measured at 2800rpm by the inverse FFT of the different spectrofilters. The mechanical contribution is obtained by subtracting the combustion contribution from the measured acoustic pressure signal. The noise levels in dB(A) are then averaged over 30 seconds. The full processing time is less than one minute using a standard PC. Note that for the last speed, the same recording was used for the spectrofilters estimation and for the synthesis. The results are given in table 1.
Filters Total engine Combustion Mechanical measured at noise (dB(A)) noise (dB(A)) noise (dB(A))
2800rpm 88.8 78.5 87.5
1800rpm 88.8 80.2 87.5
810rpm 88.8 82.6 88.2
Table 1
Noise levels of combustion and mechanical noise at 2800rpm, full load, using spec-trofilters extracted at idle (810 rpm), 1800rpm, and 2800rpm.
First of all, it can be noted that, for this relatively high engine speed, the combustion noise is relatively low as compared to the mechanical noise. Fur-thermore the total noise level is not equal to the quadratic sum of combustion and mechanical noise levels, both components being partially correlated. The difference between the combustion contribution and the overall noise level de-creases when using the spectrofilters obtained at lower speeds. This difference is about 10 dB(A) when using the filters estimated at 2800rpm, but 8.5 and 6 dB(A) when using the filters estimated at 1800 and 810 rpm, respectively. These results confirm what was expected : the overestimation of the filter’s damping has a significant effect on the resulting level of combustion noise. However, increase of the combustion noise level does not imply the mechani-cal noise level decreases: this imply that this level remains approximately
un-changed whatever the spectrofilter. A decrease of the mechanical noise could have been expected, because a part of the combustion noise that is falsely identified as mechanical noise with spectrofilters estimated at 2800rpm should have been reassigned to the combustion noise using spectrofilters estimated at lower speeds. These observations could be explained by significant deviations of transfer function with the engine operating point, because of heat changes or non-linearity effects in mechanical joints subjected to intense loads.
6 Conclusion
Two modal analysis methods (ESPRIT and LSCE) have been used to analyze FRFs of a diesel engine, measured either in operating conditions or on the stopped engine. The FRF obtained with the impact hammer on the cylinder head of the stopped engine represents the gas excitation path only, while in operating conditions the piston-crankshaft path is dominant. A modal behav-ior of this path is clearly identified between 1 and 2 kHz, inducing a high gain of the spectrofilters in this frequency range. Above 1.8 kHz, the averaged level of FRFs are similar. The impulse response corresponding to these functions are then decomposed in damped sinusoidal components. A case study brings to the conclusion that ESPRIT method is more adapted to spectrofilters anal-ysis than LSCE. A pre-whitening of the Wiener filter is however necessary to enable ESPRIT to reconstruct the signal precisely in the whole frequency range. The damping of identified poles seems to increase with the operating engine speed, and is always significantly higher than the damping identified on the stopped engine. This observation can be explained by the signal pro-cessing stage required to estimate the spectrofilter in operating conditions. The signals have to be windowed over time durations corresponding to about a quarter of cycle, i.e. about 40ms to 10ms at 800 to 3000 rpm. These window lengths are too small, as compared to the engine block impulse response, re-sulting in an overestimation of the damping of the estimated filters. The effect on the extracted combustion noise has been found to be significant, with an underestimation reaching 4dB(A) at high speed.
Acknowledgements
This work was supported by the R´egion Rhˆone Alpes, and performed within the framework of the Labex CeLyA of Universit´e de Lyon, operated by the French National Research Agency (ANR-10-LABX-0060/ANR-11-IDEX-0007).
References
[1] J. Drouet, Quentin Leclere, and Etienne Parizet. Experimental modeling of Wiener filters estimated on an operating diesel engine. In proceedings of surveillance 6, Compi`egne, France, 2011.
[2] T. Priede. In search of origins of engine noise - an historical review. S.A.E. Technical paper series, (800234), 1980.
[3] F.W. Leipold and H.O. Hardenberg. Noise, emissions and performance of the Diesel engine—a comparison between di and idi combustion systems. S.A.E. Technical paper series, (750796), 1975.
[4] J.Y. Chung, M.J. Crocker, and J.F. Hamilton. Measurement of frequency reponses and the multiple coherence function of the noise-generation system of a Diesel engine. Journal of the Acoustical Society of America, 58(3):635–642, 1975.
[5] R.J. Alfredson. The partial coherence technique for source identification on a Diesel engine. Journal of Sound and Vibration, 55(4):487–494, 1977.
[6] Y. Yawata and M. Crocker. Identification of internal noise sources in Diesel engines. S.A.E. Technical paper series, (831330), 1983.
[7] M.F. Albright. Conditioned source analysis, a technique for multiple input system identification with application to combustion energy separation in piston engines. S.A.E. Technical paper series, (951376), 1995.
[8] A.E.W Austen and T. Priede. Origins of diesel engin noise. S.A.E. Technical paper series, (590127), 1959.
[9] T.E. Reinhart. An evaluation of the lucas combustion noise meter on cummins ’b’ series engines. SAE transactions, 96 (2):1532–1538, 1987.
[10] M. El Badaoui, J. Dani`ere, F. Guillet, and C. Servi`ere. Separation of combustion noise and piston-slap in diesel engine - part i : Separation of combustion noise and piston-slap in diesel engine by cyclic wiener filtering. Mechanical Systems and Signal Procesing, 19:1209–1217, 2005.
[11] S. Wang, C. Chalu, and F. Gautier. Optimization of combustion noise of modern diesel engines for passengers cars. SAE International, 1:2379, 2007.
[12] J Antoni, J. Dani`ere, F. Guillet, and R.B Randall. Effective vibration analysis of ic engines using cyclostationarity. part ii - new results on the reconstruction of the cylinder pressures. Journal of Sound and Vibration, 257 (5):839–856, 2002.
[13] L. Pruvost. Extraction du bruit de combustion d’un moteur Diesel. D´eveloppement et application d’un spectrofiltre. PhD thesis, Institut National des Sciences Appliqu´ees de Lyon, 2009.
[14] L. Pruvost, Q. Lecl`ere, and E. Parizet. Diesel engine combustion and mechanical noise separation using an improved spectrofilter. mechanical systems and signal processing. Mechanical Systems and Signal Procesing, 23 (7):2072–2087, 2009. [15] D.L. Brown, Allemang R.J., and Zimmerman R. Parameter estimation
techniques for modal analysis. S.A.E Technical paper series, 790221, 1979. [16] R. Roy and T. Kailath. Esprit - estimation of signal parameters via rotational
invariance techniques. IEEE Transactions on Acoustics, Speech and Signal Processing, 37(7):984 – 995, 1989.
[17] R. Badeau. M´ethodes `a haute r´esolution pour l’estimation et le suivi de sinuso¨ıdes modul´ees. Applications aux signaux num´eriques. PhD thesis, Ecole Nationale Sup´erieure des T´el´ecommunications, 2005.
[18] M.F. Russel. Diesel engine noise : control at source. S.A.E Technical paper series, 820238, 1982.
[19] Donald E. Baxa. Noise Control In Internal Combustion Engines. Wiley-Interscience, 1982.
[20] T. Priede, J.M. Baker, E.C. Grover, and R. Ghazy. Characteristics of exciting forces and structural response of turbocharged Diesel engines. S.A.E. Technical paper series, (850972), 1985.
[21] Q. Leclere, C. Pezerat, B. Laulagnet, and L. Polac. Indirect measurement of main bearing loads in an operating diesel engine. Journal of Sound and Vibration, 286:341–361, 2005.
[22] J. Drouet. S´eparation des sources de bruit des moteurs Diesel : Application en hi´erarchisation de source et qualit´e sonore. PhD thesis, Institut National des Sciences Appliqu´ees de Lyon, 2013.
[23] M. Chiollaz and B. Favre. Engine noise characterisation with wigner-ville tiem-frequency analysis. Mechanical Systems and Signal Processing, 7 (5):375–400, 1993.
[24] J.L Le Carrou. Vibro-acoustique de la harpe de concert. PhD thesis, Ecole doctorale de l’Universit´e du Maine, 2006.
[25] K. Ege, X. Boutillon, and B. David. High-resolution modal analysis. Journal of Sound and Vibration, 325:852–869, 2009.
[26] Modal Analysis Rev 3.4, LMS CADA-X User Manual.
[27] Q. Leclere. Etude et d´evelopement de la mesure indirecte d’efforts. Application `
a l’identification des sources internes du moteur. PhD thesis, Institut National des Sciences Appliqu´ees de Lyon, 2003.
[28] L. Laroche. The use of the matrix pencil method for spectrum analysis of musical signals. J. Acoust. Soc. Am., 94 (4):1958–1965, 1993.