HAL Id: hal-00296549
https://hal.archives-ouvertes.fr/hal-00296549
Submitted on 19 May 2008
HAL is a multi-disciplinary open access
archive for the deposit and dissemination of
sci-entific research documents, whether they are
pub-lished or not. The documents may come from
teaching and research institutions in France or
abroad, or from public or private research centers.
L’archive ouverte pluridisciplinaire HAL, est
destinée au dépôt et à la diffusion de documents
scientifiques de niveau recherche, publiés ou non,
émanant des établissements d’enseignement et de
recherche français ou étrangers, des laboratoires
publics ou privés.
Ozone-enhanced layers in the troposphere over the
equatorial Pacific Ocean and the influence of transport
of midlatitude UT/LS air
H. Hayashi, K. Kita, S. Taguchi
To cite this version:
H. Hayashi, K. Kita, S. Taguchi. Ozone-enhanced layers in the troposphere over the equatorial Pacific
Ocean and the influence of transport of midlatitude UT/LS air. Atmospheric Chemistry and Physics,
European Geosciences Union, 2008, 8 (10), pp.2609-2621. �hal-00296549�
the Creative Commons Attribution 3.0 License.
and Physics
Ozone-enhanced layers in the troposphere over the equatorial
Pacific Ocean and the influence of transport of midlatitude
UT/LS air
H. Hayashi1, K. Kita1, and S. Taguchi2
1Department of Environmental Sciences, College of Science, Ibaraki University, Mito, Japan
2Research Institute for Environmental Management Technology, National Institute of Advanced Industrial Science and
Technology (AIST), Tsukuba, Japan
Received: 12 October 2007 – Published in Atmos. Chem. Phys. Discuss.: 26 November 2007 Revised: 22 April 2008 – Accepted: 29 April 2008 – Published: 19 May 2008
Abstract. Occurrence of ozone (O3)-enhanced
lay-ers in the troposphere over the equatorial Pacific Ocean and their seasonal variation were investigated based on ozonesonde data obtained at three Southern Hemisphere AD-ditional OZonesondes (SHADOZ) sites, Watukosek, Ameri-can Samoa and San Cristobal, for 6 years between 1998 and 2003. O3-enhanced layers were found in about 50% of
ob-served O3profiles at the three sites. The formation processes
of O3-enhanced layers were investigated by meteorological
analyses including backward trajectories. On numerous oc-casions, O3-enhanced layers resulted from the transport of
air masses affected by biomass burning. The contribution of this process was about 30% at San Cristobal during the pe-riods from February to March and from August to Septem-ber, while it was relatively low, about 10%, at Watukosek and Samoa. A significant number of the O3-enhanced layers were
attributed to the transport of midlatitude upper-troposphere and lower-stratosphere (UT/LS) air. Meteorological analy-ses indicated that these layers originated from equatorward and downward transport of the midlatitude UT/LS air masses through a narrow region between high- and low-pressure sys-tems around the subtropical jet stream. This process ac-counted for 50–80% at Watukosek between May and Decem-ber, about 80% at Samoa on yearly average, and 40–70% at San Cristobal between November and March, indicating that it was important for O3 budget over the equatorial Pacific
Ocean.
Correspondence to: K. Kita
(kita@mx.ibaraki.ac.jp)
1 Introduction
The tropospheric ozone (O3)concentration in the tropics is
generally low, especially over the Pacific Ocean, in com-parison with that in the midlatitude (e.g., Fishman et al., 1990; Brasseur et al., 1999; Kondo et al., 2002). How-ever, O3-enhanced layers are often observed in the tropics
(e.g., Newell et al., 1996; Stoller et al., 1999; Thouret et al., 2001). Photochemical production from the O3
precur-sor gases emitted from biomass burning is considered to in-crease O3 concentrations in the tropical troposphere.
In-creases in O3associated with biomass burning over the
trop-ical Pacific Ocean have been repeatedly reported. Oltmans et al. (2001) suggested that the O3-enhanced layers observed
at Fiji (18.1◦S, 178.2◦E), Samoa (14.3◦S, 189.4◦E), Tahiti (18.0◦S, 211.0◦E), and Galapagos (0.9◦S, 270.4◦E) with ozonesondes were attributable to the transport of air masses affected by biomass burning in Australia and South Amer-ica. In Indonesia, during the local late dry season between September and November, enhancements of tropospheric O3
concentrations are often observed (Komala et al., 1996; Fu-jiwara et al., 2000), and similar O3enhancements have also
been observed in Malaysia between March and May (Yone-mura et al., 2002a). Especially during El Ni˜no periods, when severe droughts and extensive biomass burning occurred in Indonesia, remarkably large O3increases have persisted
(Fu-jiwara et al., 1999; Yonemura et al., 2002b). Satellite total O3data also showed O3increases over the Indonesian region
and the Indian Ocean during these periods (Chandra et al., 1998; Kita et al., 2000).
Transport of O3-abundant air masses is another cause of
tropospheric O3increases in the tropics. Active convection
over Indonesia has been shown to carry O3 precursors to
60 120 180 240 300 -60 -30 0 30 60
East Longitude (deg)
N o rt h L a ti tu d e ( d e g ) (7.57S, 112.65E) Watukose k Samoa (14.23S, 189.44E) (0.92S, 270.40E) San Cristobal
Fig. 1. The locations of the three ozonesonde stations, Watukosek,
Samoa and San Cristobal, are indicated by stars.
Indonesia, the Indian Ocean and northern Australia (Kita et al., 2002). The downward transport of air masses from the upper troposphere and lower stratosphere (UT/LS) is also suggested to increase the O3 concentration in the tropics.
Fujiwara et al. (1998) observed O3enhancement in the
up-per troposphere at Watukosek (7.57◦S, 112.65◦E), Indonesia and indicated that the breaking of equatorial Kelvin waves around the tropopause caused O3 transport from the
strato-sphere into the tropostrato-sphere. Intrusions of the midlatitude UT/LS air in association with the breaking of Rossby waves around the subtropical jet stream have been suggested to cause the O3increase as well as decrease of humidity in the
tropics (e.g., Baray et al., 2000; Scott et al., 2001; Waugh and Funatsu, 2003; Waugh, 2005). Yoneyama and Parsons (1999) found extremely dry layers in the lower and mid-dle troposphere over the tropical western Pacific Ocean, and suggested that they originated from Rossby wave breaking. Zachariasse et al. (2001) found O3 enhancement with low
relative humidity (RH) in the middle troposphere over the In-dian Ocean, and suggested that it was attributed to a pair of anticyclones located along the subtropical jet stream over the western Pacific and Australia. Baray et al. (1998) discussed the possible influences of tropopause foldings near the sub-tropical jet stream on the sub-tropical tropospheric O3
concentra-tions. They showed that tongues of air mass near the subtrop-ical jet stream with high potential vorticity (PV) values ex-tended to the subtropical latitudes in the middle troposphere. Occurrence of intrusions of high-PV air masses, induced by wave-breaking events, were relatively high over the Pacific and Atlantic Oceans during northern winter, when westerly ducts are strongest (e.g., Postel and Hitchman, 1999; Waugh and Polvani, 2000). These studies showed that the high-PV air masses could directly intrude into latitudes of about 20◦. However, it is not clear whether the transportation of these air masses to the equatorial region (15◦N–15◦S) from midlati-tude UT/LS directly contributes to O3 enhancement in this
region. Systematic studies on the contribution of the midlat-itude UT/LS air intrusions to tropospheric O3enhancement
in the equatorial region using long-term observational data have been quite limited.
In this work, 6-year ozonesonde data at three equatorial sites in the western, central and eastern Pacific Ocean were used to examine the occurrence of O3-enhanced layers in the
free troposphere over this region and its seasonal variations. Contributions of biomass burning and the intrusion of midlat-itude UT/LS air masses, as well as their seasonal variations, were examined. The transport process of midlatitude UT/LS air masses into the equatorial region and its importance are also discussed.
2 Ozone and meteorological data
In order to investigate O3-enhanced layers in the troposphere
over the western, central, and eastern Pacific Ocean, we analyzed ozonesonde data obtained at three equatorial sta-tions, Watukosek (7.57◦S, 112.65◦E), Indonesia, American Samoa (14.23◦S, 189.44◦E), and San Cristobal (0.92◦S, 270.40◦E), Galapagos. Figure 1 shows the location of these three sites. In general, ozonesonde observations have been regularly carried out once per week as a part of the South-ern Hemisphere Additional OZonesondes (SHADOZ) ex-periment (Thompson et al., 2003a and b), and the data are available at the SHADOZ website (http://croc.gsfc.nasa.gov/ shadoz/). The data analyzed in this work were obtained be-tween August 1999 and April 2002 at Watukosek, bebe-tween January 1998 and March 2003 at Samoa, and between March 1998 and August 2002 at San Cristobal. Focusing on the free troposphere that is not directly affected by the strato-sphere, only the O3data obtained below 12 km were used in
this study.
In the observation, O3 concentration and RH were
mea-sured with balloon-borne electrochemical concentration cell (ECC) ozonesondes (Science Pump type 6A at Samoa and San Cristobal, and ENSCI type 2Z at Watukosek) with Vaisala RS-80 radiosondes (Oltmans et al., 2001; Fujiwara et al., 2003). Although O3data were derived using MEISEI
RSII-KC79D ozonesondes between May 1993 and July 1999 (Komala et al., 1996; Fujiwara et al., 2000), these data were not included in this study because RH was not measured dur-ing this period. The precision of the O3 measurements is
5–10% in the troposphere. The measured RH is valid with-out any corrections down to abwith-out −30◦C air temperature (e.g., Miloshevich et al., 2001). The vertical resolution of O3
concentration and RH is less than about 100 m.
In order to investigate the origins and transport routes of the O3-enhanced air masses, kinematic backward/forward
trajectories were calculated. In the calculation, the European Centre for Medium-Range Weather Forecast (ECMWF)/the World Climate Reseach Program (WCRP) level III-A a Trop-ical Ocean and Global Atmosphere (TOGA) gridded data and a computing program developed by Tomikawa and Sato (2005) were used. The spatial and temporal resolution of the used ECMWF data was 2.5◦×2.5◦×21 levels and 12 h, re-spectively. The time step for calculation was 15 min, and the
0 20 40 60 80 100 0 5 10 O3 (ppbv) Al tit ud e (k m ) Dec.-Jul. (64) Aug.-Nov. (46) (a) 0 20 40 60 80 100 0 5 10 O3 (ppbv) Al tit ud e (k m ) (b) Jan.-May (102) Jun.-Dec. (104) 0 20 40 60 80 100 0 5 10 O3 (ppbv) Al tit ud e (k m ) (c) Dec.-Jun. (112) Jul.-Nov. (92)
Fig. 2. Vertical profiles of median ozone mixing ratios at (a) Watukosek, (b) Samoa and (c) San Cristobal. Black and white squares indicate
median values in two different periods of the year. The horizontal bars indicate the central 66.6% range for each 1-km altitude range. The numbers in parentheses are the numbers of observational data used for calculating median values in each period.
vertical displacement of air masses was calculated using the vertical wind component of the ECMWF data.
PV was used to indicate the transport of the midlatitude UT/LS air to the equatorial region. PV values were calcu-lated from the ECMWF operational analysis gridded data us-ing a computus-ing program developed by National Institute of Advanced Industrial Science and Technology (AIST). The spacial and temporal resolution of the used ECMWF data was 1.125◦×1.125◦×61 levels and 6 h, respectively. In this program, isentropic surface levels were evaluated from ver-tical temperature profiles at each grid. The horizontal wind vectors were linearly interpolated to the isentropic surfaces in the vertical direction to calculate PV values from them.
The location of convection, which can upwardly trans-port air in the planetary boundary layer (PBL), was inferred using outgoing longwave radiation (OLR) data. National Centers for Environmental Prediction (NCEP) operational OLR data (http://www.cdc.noaa.gov/Composites/Day/) were used in the analysis. The locations of biomass burning, which can emit O3 precursors, were shown using
satel-lite hot-spot data (spots indicating high temperature) ob-tained from the World Fire Atlas provided by the Euro-pean Space Agency (http://dup.esrin.esa.it/ionia/wfa/index. asp) using Along Track Scanning Radiometer (ATSR)-2 data.
3 Results and discussion
3.1 The occurrence of O3-enhanced layers
The tropospheric O3 concentrations measured at the three
sites showed a seasonal variation: it was higher in the pe-riods from August to November, June to December and July to November than the periods from December to July, Jan-uary to May and December to June at Watukosek, Samoa
0 20 40 60 80 100 0 5 10 O3 (ppbv), RH (%) O3 RH A lt it u d e ( k m ) (a) 0 20 40 60 80 100 0 5 10 O3 (ppbv), RH (%) A lt it u d e ( k m ) (b) O3 RH
Fig. 3. Vertical profiles of O3mixing ratio (solid line) and relative
humidity (dashed line) at Watukosek (a) on 3 December 2000, and
(b) on 7 June 2000. The median values of the O3mixing ratios in the period from December to July are shown by gray squares, and their central 66.6% ranges are shown by horizontal bars.
and San Cristobal, respectively. Median values and central 66.6% ranges of the observed mixing ratios were separately calculated in each 1-km altitude range between 0 and 12 km during these periods at each station, and are shown in Fig. 2. The median values of O3 mixing ratios over the equatorial
Pacific Ocean were between 20 and 40 ppbv.
When the measured O3 mixing ratio exceeded its lower
83.3 percentile range in the free troposphere at altitudes be-low 12 km, we regarded it as an O3-enhanced layer. If the O3
enhancement reached altitudes above 12 km, we excluded it from this analysis because of the possibility of its being a direct influence of the tropospheric tropopause layer (TTL), which is connected to the stratosphere. O3 enhancement
near the surface, probably in the PBL, was also excluded be-cause it was considered to be a result of O3production in the
0 10 20 30 40 50 60 70 80 90 10 0
Ja nFe bMa rAp rMa yJu nJu lAu gSepOctNovDec
O c c u r r e n c e ( % ) 52 (11 0) (a) 0 10 20 30 40 50 60 70 80 90 10 0 JanFe bMa rAp rMa yJu nJu lAu gSe pOc tNo vDec 94 (20 6) (b) 0 10 20 30 40 50 60 70 80 90 100
Ja nFe bMa rAp rMa yJu nJu lAu gSe pOctNovDec 11 5 (2 04)
(c)
Fig. 4. Occurrence of tropospheric O3-enhanced layers at (a) Watukosek, (b) Samoa and (c) San Cristobal by month. The number shown in
the upper right of each panel is the number of O3profiles with O3-enhanced layers in the whole data period, and the number in parenthesis
is the total number of observed O3profiles.
surface-polluted air. Figure 3a and b show vertical profiles of O3mixing ratios and RH at Watukosek on 3 December 2000
and on 7 June 2000, respectively. O3 mixing ratios
obvi-ously exceeded their lower 83.3 percentile range at altitudes between 2 and 6 km in Fig. 3a, and at altitudes between 2.5 and 4 km, between 4.5 and 5.5 km and between 6.5 and 8 km in Fig. 3b, and these altitude ranges are considered to be O3
-enhanced layers. We excluded the cases in which the vertical thickness of the layer was less than about 1 km, such as the layer at about 10.5 km in Fig. 3a, because it is difficult to in-vestigate these small-scale events by trajectory analyses. We consider that these thin peaks are insignificant because the number of these excluded peaks accounted for only 6% of all observed O3-enhanced layers and because these layers have
fewer O3molecules than those in thick layers. The increase
of O3up to about 50 ppbv below 1.5 km in Fig. 3b was also
excluded, because it occurred in the PBL.
Figure 4 shows the occurrence of O3-enhanced layers at
the three sites by month. The number of occurrence was calculated by dividing the number of profiles where one or more O3-enhanced layers appeared by the total number of
successful observations in each month. At these sites, the yearly average of the occurrence was about 50%, indicat-ing that O3-enhanced layers occurred frequently. This
oc-currence suggests that their formation processes are signifi-cant for the O3budget in the equatorial Pacific region. The
occurrence shows a seasonal variation. At Watukosek, it was about 40% in the periods from January to April and from Au-gust to November, while it exceeded about 70% in the other months. At Samoa, it was less than 40% between Febru-ary and April, while it was about 50% or more from May to January except for August. At San Cristobal, it was less than 30% in April, May and July, while it generally exceeded 50% in other months. These seasonal variations are connected to the processes by which O3-enhanced layers are formed, as
discussed in Sects. 3.2 and 3.3.
RH in the O3-enhanced layer is considered as an
indica-tor of the vertical displacement of O3-enhanced air masses.
If an O3-enhanced air mass were raised by convection just
before it was observed, its RH would be higher than those at the altitudes above and below the layer. On the contrary, if an O3-enhanced air mass was transported downward, RH
would be lower. Especially, if the O3-enhanced air mass was
transported from the UT/LS region, the RH should be very low. We found that the RH in more than 90% of the all O3
-enhanced layers was lower than those in altitudes above and below the layer, as in the three layers shown in Fig. 3b, at all three sites. This result suggests that downward transport of air masses, such as downward transport of the UT/LS air mass, is very important for the formation of O3-enhanced
layers. On the contrary, the RH in the O3-enhanced layer was
higher than those above and below the layer in about 40% of layers found in December and January at Watukosek, and in about 20% of layers found in March and October at San Cristobal. This result suggests that upward transport prob-ably due to active convection may produce an O3-enhanced
layer in some cases.
3.2 The formation process of O3-enhanced layers
3.2.1 Biomass burning
Transport of plumes from biomass burning and the O3
pho-tochemical production in them is one way the O3-enhanced
layers were assumed to form. As shown in Fig. 3a, an O3
-enhanced layer was observed at altitudes between 3.5 and 6 km at Watukosek on 3 December 2000. The RH also in-creased in this layer. Figure 5 shows 10-day backward tra-jectories calculated from nine grid points around Watukosek at 550 hPa (about 5 km) from the measurement time. A major part of the trajectories show that the air mass was transported from the boundary layer over northern Australia as shown by red curves. Higher RH in this layer is consistent with this result. Black squares in Fig. 6 show that there were many hot spots in northern and eastern Australia during the period when the trajectories passed over this region, indicating that
-30 0 30 N or th L at itu de (d eg ) 60 90 120 150 180 200 300 400 500 600 700 800 900 1000 P re ss ur e (h P a)
East Longitude (deg)
Fig. 5. Ten-day backward trajectories from Watukosek at 550 hPa
on 3 December 2000. The trajectories were calculated from 9 grid points, and the center of the grid points was over Watukosek. The
spatial interval of the grid points was 2.5◦ in latitude by 2.5◦ in
longitude. Upper and lower panels show the horizontal and vertical motion of air masses, respectively. Dots show the air mass position on a representative trajectory in each 24-h interval. Location of Watukosek is indicated by a star.
biomass burning was active there. The daily average OLR values on 30 November, when the trajectories suggested a rapid upward transport in the northern Australia, in Fig. 6 show that they were significantly low over this region, im-plying that active convection occurred there. These results strongly suggest that O3 precursors emitted from biomass
burning over northern Australia were upwardly transported by convection over the northwest of this region, and that O3
photochemical production during the transport formed the O3-enhanced layer found over Watukosek.
In this way, we categorized the O3-enhanced layers
result-ing from the biomass burnresult-ing by adoptresult-ing followresult-ing crite-ria: 1) a major part of the backward trajectories from the layer were passed over a convection region of low-OLR val-ues less than about 200 Wm−2, 2) the backward trajectories suggests upward transport from the lower troposphere in the low-OLR region, and 3) hot-spot distribution suggests that biomass burning occurred on the windward side of the low-OLR region in the lower troposphere. We considered that significant biomass burning occurred when more than 5 hot-spots were found in a 5◦×5◦area. Although the numbers in the above criteria are rather arbitrarily chosen, the result does not critically depend on them.
Fig. 6. A contour map of the daily average OLR value on 30
November 2000. The color bar refers to the OLR values in Wm−2.
Black squares indicate the hot-spot distribution derived from the European Space Agency World Fire Atlas for the period from 24 November to 30 November 2000. Location of Watukosek is indi-cated by a star.
3.2.2 Transport of midlatitude UT/LS air
Because of the frequent stratosphere-troposphere exchange, active O3 photochemical production in the urban polluted
air, and less O3 destruction due to lower water vapor
con-centration, the O3concentration in the midlatitude is
gener-ally higher than that in the tropics. The transport of midlat-itude UT/LS air can form O3-enhanced layers with
signifi-cantly low RH in the tropical middle troposphere. As shown in Fig. 3b, O3-enhanced layers at altitudes between 2.5 and
4 km, between 4.5 and 5.5 km and between 6.5 and 8 km, were observed at Watukosek on 7 June 2000. The RH neg-atively correlated with O3 in these layers. Figure 7a shows
nine 10-day backward trajectories calculated from the center layer at 550 hPa (about 5 km) from the measurement time. Backward trajectories calculated from upper (about 7 km) and lower (about 3.5 km) layers were similar to those in Fig. 7a. The trajectories can be categorized into two groups: trajectories coming from a region along the subtropical jet stream at about 25◦S over the Indian Ocean (shown by red curves) and those coming from eastern Indonesia/north of Australia (shown by blue curves). The former trajectories show a downward motion from about the 300 hPa level, and the latter trajectories show an upward motion from the PBL (not shown). Low-RH values in this layer are consistent with the former trajectories, indicating that the air masses in these layers were transported eastward along the subtropical jet stream at about 25◦S several days and were transported equatorward and downward after that.
In similar way, we categorized the O3-enhanced layer
re-sulting from the transport of midlatitude UT/LS air by adopt-ing the criteria: 1) a major part of backward trajectories from the layer indicated that the air masses in the layer were
0 60 120 180 -60 -30 0 30 60 N or th L at itu de (d eg )
East Longitude (deg)
(a) 0 60 120 180 -60 -30 0 30 60 (b) N or th L at itu de (d eg )
East Longitude (deg)
60 120 180 240 -60 -30 0 30 60 N or th L at itu de (d eg )
East Longitude (deg)
(c) 180 240 300 -60 -30 0 30 60 N or th L at itu de (d eg )
East Longitude (deg)
(d) 36% 31% 22% 88% 7% 81%
Fig. 7. Ten-day backward trajectories from the altitude of O3-enhanced layers with low relative humidity. (a) Trajectory from Watukosek on
7 June. Dots show the air mass position on a representative trajectory in each 24-h interval. (b), (c) and (d) Thirty representative trajectories tracing back to the subtropical jet stream region from Watukosek, Samoa, and San Cristobal, respectively. Blue and red curves in (b) show the trajectories classified into the transport routes as shown in Fig. 13a and b. Red, blue and green curves in (d) show the trajectories classified into the transport routes as shown in Fig. 13d, e and f, respectively. The numbers shown in (b), (c) and (d) are the percentage of “transport of midlatitude UT/LS air” cases along the route as shown in Fig. 13a–f to all “transport of midlatitude UT/LS air” cases at each station. The colors of the numbers correspond to those of the trajectory curves. Location of observational sites is indicated by a square.
transported from latitudes higher than 20◦near the subtrop-ical jet stream and from UT region higher than the 300 hPa level, which is close to the midlatitude tropopause where in-fluence of the LS air is significant, and 2) no low-OLR (less than about 200 Wm−2)region was found along the transport
route from the subtropical jet region to the layer. The re-sult does not critically depend on the numbers in these crite-ria. As shown in Sect. 3.1, O3-enhanced layers with low RH,
similar to those in Fig. 3b, accounted for about 90% of all O3
-enhanced layers observed at the three sites. A significant part of these O3-enhanced layers with low RH were categorized
into that resulting from the transport of midlatitude UT/LS air. Figure 7b–d show representative examples of 10-day backward trajectories calculated from these layers, showing that the high-O3, low-RH air masses observed in these layers
were transported from latitudes higher than 20◦near the sub-tropical jet stream and from altitudes higher than the 300 hPa level to the equatorial middle troposphere. No low-OLR re-gion was found along the trajectories (not shown), implying that convection did not affect these air masses.
3.2.3 Contribution of each formation process
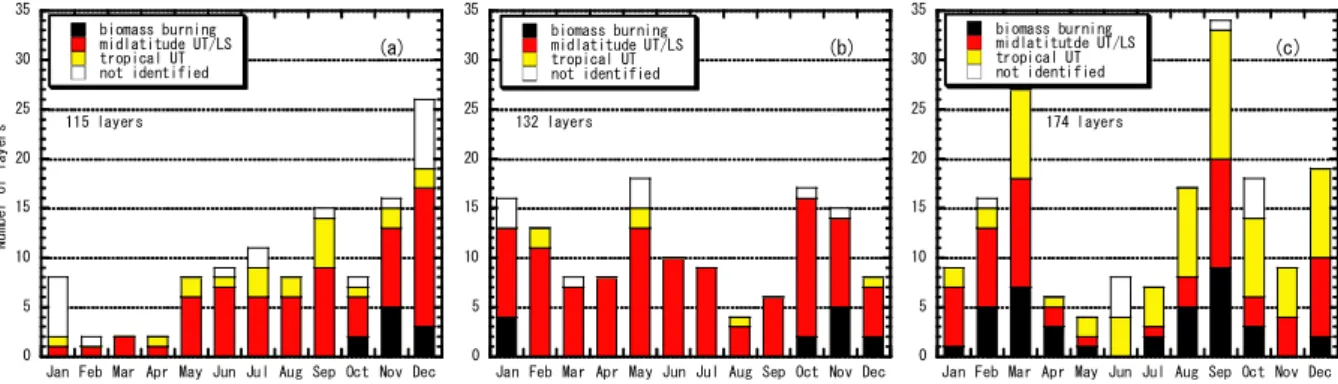
Figure 8 shows the number of O3-enhanced layers observed
at Watukosek, Samoa, and San Cristobal in each month. The number of layers resulting from biomass burning is shown by black bars. The contribution of biomass burning was rel-atively large (about 30%) at San Cristobal during the periods from February to April and from August to September, prob-ably due to the influence of biomass burning in South Amer-ica. At Watukosek and Samoa, it was relatively small (less than 10%). The small contribution of biomass burning in the western Pacific region was partly because biomass burning was inactive over this region including Indonesia between 1998 and 2002, when the La Ni˜na tendency dominated. Sig-nificant O3increases in this region were reported in the El
Ni˜no periods (Chandra et al., 1998; Fujiwara et al., 1999; Kita et al., 2000; Yonemura et al., 2002b).
Red bars in Fig. 8a–c show the number of layers result-ing from the transport of midlatitude UT/LS air, indicatresult-ing that this process significantly contributed to the formation of O3-enhanced layers in the equatorial Pacific region. At
0 5 10 15 20 25 30
JanFebMarAprMayJunJu lAu gSepOc tNo vDec not identified tropical UT midlatitude UT/LS biomass burning N u m b e r o f l a y e r s 11 5 lay ers (a) 0 5 10 15 20 25 30
Ja nFebMa rAp rMa yJunJulAugSepOctNo vDec not identifie d tropical UT midlatitude U T/LS biomass burni ng 132 layers (b) 0 5 10 15 20 25 30
Ja nFebMa rAp rMayJunJulAugSepOc tNo vDec no t i denti fie d
tr opi cal U T mi dla titut de UT/LS bi oma ss bu rni ng
174 l ayers
(c)
Fig. 8. Number of O3-enhanced layers by month at (a) Watukosek, (b) Samoa and (c) San Cristobal. Black, red, and yellow bars indicate the
number of layers resulting from biomass burning, the transport of midlatitude UT/LS air, and the transport of tropical UT air, respectively. White bars show the number of layers whose formation process was not identified. The number shown in each panel is the total number of
O3-enhanced layers.
attributed to this process in the periods from June to Septem-ber and from NovemSeptem-ber to DecemSeptem-ber. At Samoa, this pro-cess accounted for a major part of the O3-enhanced layers
throughout the year, and the contribution of this process was about 80% on yearly average. At San Cristobal, the O3
-enhanced layers resulting from this process contributed about 40–70% in the period from November to March, and about 30% between August and September. Seasonal variation in the contribution of this process would be connected with that of the transport route of the midlatitude UT/LS air, as dis-cussed in the next section.
The formation process of the other O3-enhanced layers
re-mains uncertain. Backward trajectories calculated from these layers show that the high-O3, low-RH air masses in these
lay-ers were often transported within tropical latitudes between 20◦N and 20◦S and in the UT higher than the 300 hPa level for about a week. They did not pass over a low OLR re-gion in this period. In these cases, the layers were cate-gorized as “tropical UT air”. As shown by yellow bars in Fig. 8a–c, it accounted for more than 30% in March and June-December periods at San Cristobal, while this category accounted for insignificant percent of all the O3-enhanced
layers at Watukosek and Samoa. In this category case, the source of the O3-enhanced air masses can not be traced back
by the backward trajectories. The ozone increase might be attributed to long-range transport of air masses affected by the biomass burning and by the upward transport due to convection, mixing of stratospheric air in the tropospheric tropopause layer (TTL), and nitric oxide (NO) production by lightning discharge. The rest of the O3-enhanced
lay-ers were categorized as “not identified” laylay-ers. This cate-gory included various cases. For example, backward trajec-tories suggest that some O3-enhanced air masses passed over
a low OLR region without biomass burning area, and that other air masses were transported from lower troposphere over the tropical ocean, where O3 concentration is
gener-ally low. In some cases, transport routes of O3-enhanced air
Fig. 9. A contour map of PV on the 327 K isentropic surface on 5
June 2000. Location of Watukosek is indicated by a star. The color bar indicates the PV values in PVU.
masses could not be identified because backward trajectories from 9 grid points around the layers diverged significantly. As shown by white bars in Fig. 8a–c, percentages of these “not identified” layers were not very large at the three sites. 3.3 The transport process of the midlatitude UT/LS air to
the equatorial region
In order to understand the transport process of the midlati-tude UT/LS air masses to the equatorial Pacific region, we investigated the transport route of the air masses and con-nections with the meteorological condition by using the data derived in 2000. We have adopted absolute PV (|PV|) values larger than 1 PV unit (PVU: 1 PVU=10−6m2s−1K kg−1)to indicate the midlatitude UT/LS air. |PV| values about 1 PVU are usually found in the UT region close to tropopause. “The transport of the midlatitude UT/LS air” in this study is mainly attributed to the transport of midlatitude UT air, although the cross-tropopause transport of stratospheric air
-30 0 30 N or th L at itu de (d eg ) 60 90 120 150 180 200 300 400 500 600 700 800 900 1000 P re ss ur e (h P a)
East Longitude (deg)
Fig. 10. Three-day forward trajectories calculated from the region
of PV=-1 PVU shown in Fig. 9 on the 327 K isentropic surface on 5 June 2000. Open circles indicate the air mass position on repre-sentative trajectories in each 24-h interval. Location of Watukosek is indicated by a star.
may contribute to it. Figure 9 is a contour map of PV on the 327 K isentropic surface on 5 June 2000, 2 days before the layer was observed at Watukosek. The trajectory shown in Fig. 7a show that the air mass in the O3-enhanced layer
in Fig. 3b at 5 km was located at about 20◦S near the sub-tropical jet stream at 327 K. Although high |PV| (larger than 1 PVU) air masses projected into the tropics at about 17◦S latitude and 120◦E longitude, no high |PV| values calculated from the ECMWF data were found near the equator even when the O3-enhanced layer was observed over Watukosek.
Figure 10 shows the 3-day forward trajectories indicating the transport of |PV|=1 PVU air masses. Black dots indi-cate the position of the air masses at longitudinal intervals of 1.125◦ between 75◦E and 130◦E on 5 June. The trajecto-ries calculated from these positions suggest that the transport of the midlatitude UT/LS air masses could be categorized into two groups: air masses west of 92◦E and north of 21◦S are transported equatorward and downward to Indonesia in-cluding Watukosek by a counterclockwise flow as shown by red curves, and the other air masses are transported eastward along the winding subtropical jet stream. The former result is consistent with the backward trajectories in Fig. 7a.
Figures 11 and 12 are wind fields and contour maps of the geopotential height at 400 hPa on 5 June around Indonesia, respectively. They suggest that the counterclockwise flow was due to the circulation around a high-pressure system in the west of northern Australia, roughly at (15◦S, 95◦E), and that the winding of the subtropical jet stream was due to a low-pressure system over central Australia. The equator-ward trajectories show that the midlatitude UT/LS air was
Fig. 11. A map indicating the daily average values of horizontal
wind vectors at 400 hPa on 5 June 2000. The wind data were ob-tained from the NOAA-CIRES Climate Diagnostics Center (http: //www.cdc.noaa.gov/Composites/Day/). The color bar indicates the
horizontal wind velocity in ms−1. Location of Watukosek is
indi-cated by a star.
Fig. 12. A contour map indicating the daily average value of the
geopotential height at 400 hPa on 5 June 2000. The data were ob-tained from the NOAA-CIRES Climate Diagnostics Center (http: //www.cdc.noaa.gov/Composites/Day/). The color bar indicates the geopotential height value in m. Location of Watukosek is indicated by a star.
transported into the equatorial region by way of a narrow re-gion between high- and low-pressure systems. The air tem-perature, RH and vertical pressure velocity over the same region at the same pressure level (not shown) indicated the downward transport of dry and cold air through this region, being consistent with the downward transport of the mid-latitude UT/LS air toward the equator. This meteorologi-cal condition in association with the transportation of mid-latitude UT/LS air into the equatorial middle troposphere is characterized by subsiding and intrusion of a dry air mass with high |PV| and high O3through the region between the
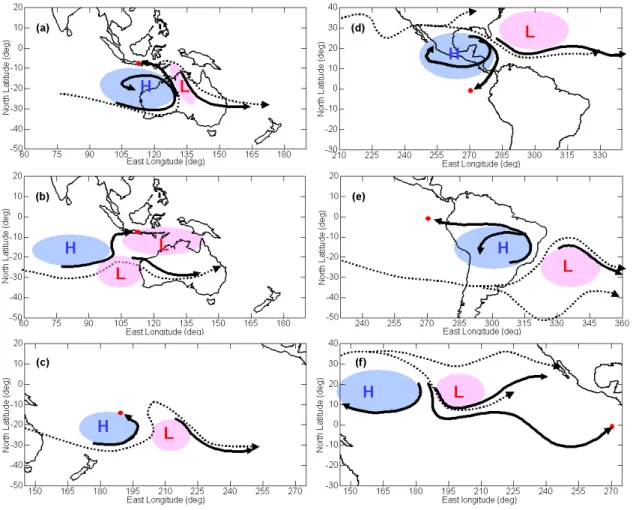
Fig. 13. Schematic illustrations of the transport processes of midlatitude UT/LS air masses to the equatorial Pacific region: (a) for Watukosek
in the dry season, between June and September; (b) for Watukosek in the period from October to December; (c) for Samoa all year around;
(d) for San Cristobal in the period from February to March; (e) for San Cristobal in the period from August to September; and (f) for San
Cristobal in the period from November to January. Solid curves with arrows are representative examples of the forward trajectories indicating motions of |PV|=1 PVU air masses. Red dots and dotted curves with arrows indicate the position of observational sites and the schematic path of the jet stream, respectively. The signs “H” and “L” indicate the rough positions of the high- and low-pressure systems which affected the transport of midlatitude UT/LS air masses to the observational sites.
high- and low-pressure systems in UT near the subtropical jet stream. It is analogous to those connected with the intru-sion of stratospheric air in the midlatitude (e.g., Palmen and Newton, 1969; Waugh and Funatsu, 2003; Waugh, 2005) by Rossby wave breaking around the jet stream, although it did not necessarily lead to cross-tropopause transport of strato-spheric air in this case.
Figure 13a schematically illustrates the transportation pro-cess of the midlatitude UT/LS air near Watukosek during the dry season between June and September. The solid curves with arrows are forward trajectories calculated from 13 June 2000, 1 day before an O3-enhanced layer was observed at
Watukosek. During the dry season, a steady high-pressure system existed over western Australia in association with the subsidence phase of the Hadley cell. When a low-pressure system developed east of this high- pressure system in the
middle- and upper-troposphere, the subtropical jet stream wound north and south as shown by the dotted curve, and the midlatitude UT/LS air mass was intruded equatorward and downward toward Watukosek through the region between the high- and low-pressure systems. Transport of the midlatitude UT/LS air along similar transport routes often occurred in the transition period from the dry season to the wet season between October and December.
Figure 13b illustrates the transportation process which sometimes occurred near Watukosek in the transition period to the wet season, between October and December. The solid curves with arrows are forward trajectories calculated from 3 December 2000, 6 days before an O3-enhanced layer was
observed at Watukosek. In the wet season, a steady low-pressure system existed over northern Australia. When a high-pressure system developing over the Indian Ocean at
about 17◦S extended eastward and a low-pressure system developed south-east of this high-pressure system at about 28◦S, the midlatitude UT/LS air mass was intruded equator-ward and downequator-ward over the Indian Ocean at about 100◦E through the region between these high- and low-pressure sys-tems. After that, the midlatitude UT/LS air mass was trans-ported eastward to Watukosek by cyclonic circulation around the low-pressure system over northern Australia. From Jan-uary to April, transport of the midlatitude UT/LS air seldom occurred at Watukosek, probably because the jet stream runs at latitudes considerably higher than those in the dry season. Transport of the midlatitude UT/LS air occured more fre-quently at Samoa than that at the other sites, probably be-cause it is located near the subtropical jet steam. As shown in Fig. 13c, a high-pressure system often existed over the south-west of Samoa, roughly at 175◦E, all the year around. The solid curves with arrows are forward trajectories calcu-lated from 15 May 2000, 4 days before an O3-enhanced layer
was observed at Samoa. As similar with the Fig. 13a case, the midlatitude UT/LS air mass was transported to Samoa when a low-pressure system occurred in the east of the high-pressure system.
At San Cristobal, the midlatitude UT/LS air was trans-ported from the northern or southern hemisphere, depend-ing on the positions of the intertropical convergence zone (ITCZ) and the subtropical jet stream. Figure 13d and e are schematic illustrations of the main transportation processes of the midlatitude UT/LS air near San Cristobal in the peri-ods from February to March, and from August to Septem-ber, respectively. The solid curves in these figures are for-ward trajectories calculated from 18 February and 15 Au-gust, respectively, 2000, 6 days and 9 days before an O3
-enhanced layer was observed at San Cristobal. From Febru-ary to March, the northern subtropical jet stream runs close to San Cristobal. When a high-pressure system existed over Central America at about 15◦N and a low-pressure system existed north-east of the high-pressure system, the midlat-itude UT/LS air was intruded equatorward and downward at around 280◦E and was transported westward toward San Cristobal by anticyclonic circulation. Between August and September, the austral subtropical jet stream runs close to San Cristobal. When the high-pressure system existed over South America at about 15◦S, 300◦E and the low-pressure system existed in the south-east of the high-pressure sys-tem, the midlatitude UT/LS air was intruded equatorward and downward through the region between the high- and low-pressure systems around 315◦E and was transported toward San Cristobal. Figure 13f illustrates the transportation pro-cess which often occurred in the period from November to January. The solid curves in figure are forward trajectories calculated from 5 December 2000, 9 days before an O3
-enhanced layer was observed at San Cristobal. In this pe-riod, the midlatitude UT/LS air was often intruded equator-ward and downequator-ward into the middle and upper troposphere through the region between high- and low-pressure systems
over the northern central Pacific Ocean roughly at 20◦N and 180◦E, or over the southern central Pacific Ocean roughly at 20◦S and 180◦E. After the intrusion, the midlatitude UT/LS air was transported eastward to San Cristobal. This transport occurred when the westerly wind prevailed over the eastern Pacific Ocean in the equatorial UT. Longitude-time section of the 30–70 day band-pass-filtered zonal wind anomaly (not shown) shows that the intrusion of midlatitude UT/LS air, which was transported to San Cristobal in this period, mostly occurred at the transition phase of the zonal wind from east-erly to westeast-erly, suggesting that it may be related to the Madden-Julian Oscillation (MJO) in UT over the equatorial central Pacific Ocean. In May, June, and July the transport of midlatitude UT/LS air seldom occurred at San Cristobal.
As shown by example backward trajectories with different color curves in Fig. 7b–d, most cases of “transport of midlat-itude UT/LS air” can be classified into the six typical trans-port routes shown in Fig. 13a–f. The percentage of the cases classified into each typical transport route to all “transport of midlatitude UT/LS air” cases is also indicated by numbers in Fig. 7b–d. The transport routes as shown in Fig. 13a and b accounted for 81% and 7% at Watukosek. Although the transport of midlatitude UT/LS air along the route as shown in Fig. 13b often occurred between November and December in 2000, it was transported mainly along the routes as shown in Fig. 13a in the same period of the other years. The trans-port routes as shown in Fig. 13c accounted for 88% at Samoa, and those as shown in Fig. 13d–f accounted for 36%, 31%, and 22% at San Cristobal, respectively. Seasonal variation of the occurrence of the transport of midlatitude UT/LS air, shown in Fig. 8a–c, was related to the meteorological con-ditions discussed above. The occurrence was relatively high in the period from May to December at Watukosek and in the three periods from February to March, from August to September, and from November to January at San Cristobal. These periods correspond to those when the transport of mid-latitude UT/LS air along the routes as shown in Fig. 13a, d, e, and f typically occurred.
4 Summary and conclusions
Ozonesonde data obtained in the western (Watukosek), cen-tral (Samoa) and eastern (San Cristobal) Pacific regions were analyzed to discuss the occurrence of O3-enhanced layers in
the troposphere over the equatorial Pacific Ocean and their formation processes. The median and lower 83.3% percentile values of O3mixing ratio between the surface and 12 km at
three sites were between 20 and 40 ppbv and between 30 and 55 ppbv, respectively. An O3-enhanced layer was
de-fined by O3mixing ratios in excess of the lower 83.3%
per-centile range at each altitude. At the three sites, the occur-rence of O3-enhanced layers was about 50% on yearly
av-erage, indicating that O3-enhanced layers occur frequently
January to April and August to November, while it exceeded 70% in the other months. At Samoa, it was less than 40% between February and April, while it was generally 50% or more from May to January except for in August. At San Cristobal, it was less than 30% in April, May and July, while it generally exceeded 50% in other months.
O3 photochemical production following biomass burning
is one of the processes by which O3-enhanced layers are
formed. Based on satellite hot-spot data, the OLR data and backward trajectory analyses, the contribution of biomass burning was estimated to be relatively high (about 30%) at San Cristobal during the periods from February to April and August to September, probably due to the influence of biomass burning in South America. In contrast, it was rel-atively low (about 10%) at Watukosek and Samoa. The lat-ter result is at least partly because La Ni˜na or La Ni˜na-like conditions prevailed in the period when the analyzed data were obtained (between 1998 and 2002). During La Ni˜na periods, biomass burning was inactive over the western Pa-cific region including Indonesia. Another significant process for the formation of O3-enhanced layers is the transport of
midlatitude UT/LS air. A major part of O3-enhanced layers
occurred with very low-RH, indicating downward displace-ment of the air masses and/or transport of dry air masses. Backward trajectory analyses showed that numerous dry, O3
-enhanced air masses were transported from latitudes higher than 25◦ around the subtropical jet stream region and from altitudes higher than the 300 hPa level. This process signif-icantly contributed to the formation of O3-enhanced layers
in the equatorial Pacific region. Its contribution was 50– 80% at Watukosek between May and December, about 80% at Samoa all year around, 40–70% between November and March at San Cristobal, and about 30% between August and September there. This result suggests that it was important for the O3budget over the equatorial Pacific Ocean.
The transport process of the midlatitude UT/LS air to-ward the equatorial region has been revealed by meteorolog-ical analyses including PV and trajectories. Forward trajec-tories calculated from the region of |PV|=1 PVU show that the midlatitude UT/LS air masses were drawn out from rela-tively narrow region between high- and low-pressure systems in the upper troposphere near the subtropical jet stream and transported to the equatorial region. These meteorological characteristics and the transportation process were analogous to those of the intrusion of stratospheric air in the midlati-tude (e.g., Palmen and Newman, 1969; Waugh and Funatsu, 2003; Waugh, 2005) in association with Rossby wave break-ing. Some previous studies (e.g., Baray et al., 1998; Waugh and Polvani, 2000) had already shown that the ozone in-crease attributable to the transport of higher |PV| (exceeding 1.5 PVU) air probably from the LS region occurred in the free troposphere at latitudes around 20◦and in the uppermost tro-posphere near the tropopause in equatorial region at latitudes less than 15◦. Based on the 6-year ozonesonde data, this
rectly transported to the equatorial middle/lower-troposphere lower than 12 km, and that significant part of the observed dry, O3-enhanced layers in this region were resulting from
the transport from the midlatitude UT region.
The transport route of midlatitude UT/LS air toward Watukosek and San Cristbal differed by seasons in associ-ation with a seasonal variassoci-ation of the meteorological con-dition. Midlatitude UT/LS air masses were transported to Watukosek along the route shown in Fig. 13a in the dry season between June and September, when stationary high-pressure system exists over north-west of Australia, corre-sponding to the subsiding phase of the Hadley cell. They were often transported along the similar transport route with that in Fig. 13a or along other transport routes as shown in Fig. 13b in the transition period from the dry season to the wet season between October and December. During the wet season from January to April, the transport of the midlati-tude UT/LS air seldom occurred around Watukosek proba-bly because the jet stream runs at latitudes higher than those in the dry season. At San Cristobal, the midlatitude UT/LS air masses were transported from the northern hemisphere in Februrary and March and southern hemisphere in August and September, as shown in Fig. 13d and e. In these periods, the northern and southern subtropical jet stream respectively approached to equator over the American continents in as-sociation with the seasonal shift of ITCZ position. Between November and January, the midlatitude UT/LS air masses were often intruded into the equatorial middle- and upper-troposphere over the central Pacific Ocean and were trans-ported eastward to San Cristobal, as shown in Fig. 13f. This transport route may be related with MJO.
To evaluate the contribution of the transport of midlaitude UT/LS air to the tropical tropospheric O3budget, additional
analyses similar to this study using long-term observational data over other equatorial regions such as the tropical Indian Ocean and Atlantic Ocean are necessary. In addition, a com-parison with results of chemical transport models would be significant to examine whether this process has been fully incorporated into the present model calculations.
Acknowledgements. The authors thank two anonymous referees
for their constructive comments for improving our work. The
trajectory calculation program used in this paper was developed by Y. Tomikawa and K. Sato at National Institute of Polar Research, Japan.
References
Baray, J.-L., Ancellet, G., Taupin, F. G., Bessafi, M., Baldy, S., and Keckhut, P.: Subtropical tropopause break as a possible strato-spheric source of ozone in the tropical troposphere, J. Atmos. Sol. Terr. Phys., 60, 27–36, 1998.
Baray, J.-L., Daniel, V., Ancellet, G., and Legras, B.: Planetary-scale tropopause folds in the southern subtropics, Geophys. Res. Lett., 27, 353–356, 2000.
Brasseur G. P., Orlando, J. J., and Tyndall, G. S. (Eds.): Atmo-spheric chemistry and global change, Oxford University Press, New York Oxford, 654 pp., 1999.
Chandra, S., Ziemke, J. R., Min, W., and Read, W. G.: Effects of 1997–1998 El Ni˜no on tropospheric ozone and water vapor, Geo-phys. Res. Lett., 25, 3867–3870, 1998.
Fishman, J., Watson, C. E., Larsen, J. C., and Logan, J. A.: Dis-tribution of tropospheric ozone determined from satellite data, J. Geophys. Res., 95, 3599–3617, doi:10.1029/89JD02784, 1990. Fujiwara, M., Kita, K., and Ogawa, T.: Stratosphere-troposphere
exchange of ozone associated with the equatorial Kelvin wave as observed with ozonesondes and rawinsondes, J. Geophys. Res., 103, 19 173–19 182, 1998.
Fujiwara, M., Kita, K., Kawakami, S., Ogawa, T., Komala, N., Saraspriya, S., and Suripto, A.: Tropospheric ozone enhance-ments during the Indonesian forest fire events in 1994 and in 1997 as revealed by ground-based observations, Geophys. Res. Lett., 26, 2417–2420, 1999.
Fujiwara, M., Kita, K., Ogawa, T., Kawakami, S., Sato, T., Komala, N., Saraspriya, S., and Suripto, A.: Seasonal variation of tro-pospheric ozone in Indonesia revealed by 5-year ground-based observations, J. Geophys. Res., 105, 1879–1888, 2000.
Fujiwara, M., Tomikawa, Y., Kita, K., Kondo, Y., Komala, N., Saraspriya, S., Manik, T., Suripto, A., Kawakami, S., Ogawa, T., Kelana, E., Suhardi, B., Harijono, S. W. B., Kudsy, M., Sribi-mawati, T., and Yamanaka, M. D.: Ozonesonde observations in the Indonesian maritime continent: a case study on ozone rich layer in the equatorial upper troposphere, Atmos. Environ., 37, 353–362, 2003.
Kita, K., Fujiwara, M., and Kawakami, S.: Total ozone increase associated with forest fires over the Indonesian region and its relation to the El Ni˜no-southern oscillation, Atmos. Environ., 34, 2681–2690, 2000.
Kita, K., Kawakami, S., Miyazaki, Y., Higashi, Y., Kondo, Y., Nishi, N., Koike, M., Blake, D. R., Machida, T., Sato, T., Hu, W., Ko, M., and Ogawa, T.: Photochemical production of ozone in the upper troposphere in association with cumu-lus convection over Indonesia, J. Geophys. Res., 107, 8400, doi:10.1029/2001JD000844, 2003.
Kiladis, G. N.: Observations of Rossby waves linked to convection over the eastern tropical Pacific, J. Atmos. Sci., 55, 321–339, 1998.
Komala, N., Saraspriya, S., Kita, K., and Ogawa, T.: Tropospheric ozone behavior observed in Indonesia, Atmos. Environ., 30, 1851–1856, 1996.
Kondo, Y., Koike, M., Kita, K., Ikeda, H., Takegawa, N., Kawakami, S., Blake, D., Liu, S. C., Ko, M., Miyazaki, Y., Irie, H., Higashi, Y., Liley, B., Nishi, N., Zhao, Y., and Ogawa, T.:
Effects of biomass burning, lightning, and convection on O3,
CO, and NOy over the tropical Pacific and Australia in August-October 1998 and 1999, J. Geophys. Res., 107(D3), 8402,
doi:10.1029/2001JD000820, 2002 [printed 108(D3), 2003]. Miloshevich, L. M., V¨omel, H., Paukkunen, A., Heymsfield, A.
J., and Oltmans, S. J.: Characterization and correction of rel-ative humidity measurements from Vaisala RS80-A radiosondes at cold temperatures, J. Atmos. Ocean. Tech., 18, 135–156, 2001. Newell, R. E., Wu, Z.-X., Zhu, Y., Hu, W., Browell, E. V., Gregory, G. L., Sachse, G. W., Collins Jr., J. E., Kelly, K. K., and Liu, S. C.: Vertical fine-scale atmospheric structure measured from NASA DC-8 during PEM-West A, J. Geophys. Res., 101, 1943– 1960, 1996.
Oltmans, S. J., Johnson, B. J., Harris, J. M., V¨omel, H., Thomp-son, A. M., Koshy, K., Simon, P., Bendura, R. J., Logan, J. A., Hasebe, F., Shiotani, M., Kirchhoff, V. W. J. H., Maata, M., Sami, G., Samad, A., Tabuadravu, J., Enriquez, H., Agama, M., Cornejo, J., and Paredes, F.: Ozone in the Pacific tropical tro-posphere from ozonesonde observations, J. Geophys. Res., 106, 32 503–32 525, 2001.
Palmen, E. and Newton, C. W.: Atmospheric Circulation Systems, Academic Press, London, 603 pp., 1969.
Postel, G. A. and Hitchman, M. H.: A climatology of Rossby wave breaking along the subtropical tropopause, J. Atmos. Sci., 56, 359–373, 1999.
Scott, R. K., Cammas, J.-P., Mascart, P., and Stolle, C.: Strato-spheric filamentation into the upper tropical troposphere, J. Geo-phys. Res., 106, 11 835–11 848, 2001.
Stoller, P., Cho, J. Y. N., Newell, R. E., Thouret, V., Zhu, Y., Carroll, M. A., Albercook, G. M., Anderson, B. E., Barrick, J. D. W., Browell, E. V., Gregory, G. L., Sachse, G. W., Vay, S., Bradshaw, J. D., and Sandholm, S.: Measurements of atmospheric layers from the NASA DC-8 and P-3B aircraft during PEM-Tropics A, J. Geophys. Res., 104, 5745–5764, 1999.
Thompson, A. M., Witte, J. C., McPeters, R. D., Oltmans, S. J., Schmidlin, F. J., Logan, J. A., Fujiwara, M., Kirch-hoff, V. W. J. H., Posny, F., Coetzee, G. J. R., Hoegger, B., Kawakami, S., Ogawa, T., Johnson, B. J., V¨omel, H., and Labow, G.: Southern Hemisphere Additional Ozoneson-des (SHADOZ) 1998-2000 tropical ozone climatology 1. Com-parison with Total Ozone Mapping Spectrometer (TOMS) and ground-based measurements, J. Geophys. Res., 108(D2), 8238, doi:10.1029/2001JD000967, 2003a.
Thompson, A. M., Witte, J. C., Oltmans, S. J., Schmidlin, F. J., Logan, J. A., Fujiwara, M., Kirchhoff, V. W. J. H., Posny, F., Coetzee, G. J. R., Hoegger, B., Kawakami, S., Ogawa, T., For-tuin, J. P. F., and Kelder, H. M.: Southern Hemisphere Additional Ozonesondes (SHADOZ) 1998–2000 tropical ozone climatology 2. Tropospheric variability and the zonal wave-one, J. Geophys. Res., 108(D2), 8241, doi:10.1029/2002JD002241, 2003b. Thouret, V., Cho, J. Y. N., Evans, M. J., Newell, R. E., Avery, M.
A., Barrick, J. D. W., Sachse, G. W., and Gregory, G. L.: Tro-pospheric ozone layers observed during PEM-Tropics B, J. Geo-phys. Res., 106, 32 527–32 538, 2001.
Tomikawa, Y. and Sato, K.: Design of the NIPR trajectory model, Polar Meteorol. Glaciol., 19, 120–137, 2005.
Waugh, D. W.: Impact of potential vorticity intrusions on subtropi-cal upper tropospheric humidity, J. Geophys. Res., 110, D11305, doi:10.1029/2004JD005664, 2005.
Waugh, D. W. and Funatsu, B. M.: Intrusions into the tropical up-per troposphere: Three-dimensional structure and accompanying ozone and OLR distributions, J. Atmos. Sci., 60, 637–653, 2003.
the tropical upper troposphere, Geophys. Res. Lett., 27, 3857– 3860, 2000.
Yonemura, S., Tsuruta, H., Kawashima, S., Sudo, S., Peng, L. C., Fook, L. S., Johar, Z., and Hayashi, M.: Tropospheric ozone cli-matology over Peninsular Malaysia from 1992 to 1999, J. Geo-phys. Res., 107(D15), 4229, doi:10.1029/2001JD000993, 2002a. Yonemura, S., Tsuruta, H., Maeda, T., Kawashima, S., Sudo, S., and Hayashi, M.: Tropospheric ozone variability over Singa-pore from August 1996 to December 1999, Atmos. Environ., 36, 2061–2070, 2002b.
intrusion of dry air into the tropical western Pacific region, J. Atmos. Sci., 56, 1524–1546, 1999.
Zachariasse, M., Smit, H. G. J., van Velthoven, P. F. J., and Kelder, H.: Cross-tropopause and interhemispheric transports into the tropical free troposphere over the Indian Ocean, J. Geophys. Res., 106, 28 441–28 452, 2001.