HAL Id: pastel-00005057
https://pastel.archives-ouvertes.fr/pastel-00005057
Submitted on 23 Apr 2009HAL is a multi-disciplinary open access archive for the deposit and dissemination of sci-entific research documents, whether they are pub-lished or not. The documents may come from teaching and research institutions in France or abroad, or from public or private research centers.
L’archive ouverte pluridisciplinaire HAL, est destinée au dépôt et à la diffusion de documents scientifiques de niveau recherche, publiés ou non, émanant des établissements d’enseignement et de recherche français ou étrangers, des laboratoires publics ou privés.
air-conditioning compressor shaft seals
David Sousa
To cite this version:
David Sousa. Study of refrigerant emissions from mobile air-conditioning compressor shaft seals. Engineering Sciences [physics]. École Nationale Supérieure des Mines de Paris, 2008. English. �NNT : 2008ENMP1597�. �pastel-00005057�
ED n° 432 : « Sciences des Métiers de l’Ingénieur »
N° attribué par la bibliothèque |__|__|__|__|__|__|__|__|__|__|
T H E S E
pour obtenir le grade de
DOCTEUR DE L’ECOLE NATIONALE SUPERIEURE DES MINES DE PARIS
Spécialité “Energétique”
présentée et soutenue publiquement par
David SOUSA
le 16 décembre 2008
STUDY OF REFRIGERANT EMISSIONS
FROM MOBILE AIR-CONDITIONING COMPRESSOR SHAFT SEALS
(ETUDE DES EMISSIONS DE FLUIDES FRIGORIGENES
DE JOINTS TOURNANTS DE COMPRESSEURS DE CLIMATISATION
AUTOMOBILE)
Directeur de thèse : Denis CLODIC
Jury :
M. Dominique MARCHIO, Mines ParisTech ... Président
M. René GRAS, LISMMA ... Rapporteur
M. Eckhart GROLL, Purdue University, USA ... Rapporteur
M. Denis CLODIC, Mines ParisTech ... Examinateur
M. Laurent GAGNEPAIN, ADEME ... Examinateur
Acknowledgements
This research work has been carried out at the Center for Energy and Processes of Ecole des Mines de Paris. This study could not have been completed without the support and help of many people, for which I am very grateful.
Foremost, I would like to thank Denis CLODIC for being a patient supervisor and for supporting this work with ideas, criticism, and for sharing his experience.
Anne-Marie POUGIN, for her administrative support.
Yingzhong YU, for friendship, the support during the experiments and the fruitful advises. Franck FAYOLLE, for all his help in the preparation of experiments.
I would like to extend my professional acknowledgements to all my colleagues of the Center for Energy and Processes for creating an enjoyable and stimulating environment.
Last but not least, Célia, who gave me the personal support and love, without her none of this would have been possible. To my parents, for their patience and encouragement when it was most required. To my uncles and aunts for their support when I arrived in France. This thesis is dedicated to you all.
Contents
NOMENCLATURE ... I
INTRODUCTION ... 1
1. MOBILE AIR CONDITIONING (MAC) SYSTEM REFRIGERANT EMISSIONS ... 4
1.1. ENVIRONMENTAL IMPACT OF MAC EMISSIONS ... 4
1.2. MAC SYSTEM DESIGN ... 5 1.2.1 The system vehicle integration ... 6 1.2.2 Heat exchangers and expansion valve ... 7 1.2.3 Open‐type compressor ... 8 1.2.4 Fittings ... 8 1.2.5 Hoses ... 9 1.2.6 Working fluid and lubricating oil ... 9 1.3. SYSTEM AND COMPONENTS EMISSIONS LEVEL ... 10
1.4. EMISSIONS DURING THE MACS LIFETIME ... 11
1.4.1 Direct emissions ... 11 1.4.1.1 Regular emissions ... 12 1.4.1.2 Irregular emissions ... 14 1.4.2 Total direct emissions ... 15 1.5. MARKET EVOLUTION ... 15 1.6. LEAK DETECTION TOOLS ... 16 1.6.1 Electronic leak detectors ... 17 1.6.2 Soap bubble testing ... 17 1.6.3 Fluorescent leak detector dye ... 18
1.7. POLICIES TO CONTROL MAC REFRIGERANT EMISSIONS ... 19
1.8. DESIGN OF NEW MAC SYSTEMS ... 20
1.9. CONCLUSIONS ... 20 1.10. REFERENCES ... 22 2. COMPRESSOR REFRIGERANT EMISSIONS ... 26 2.1. THE COMPRESSION MECHANISM ... 26 2.1.1 Rotary vane compressor ... 27 2.1.2 Scroll compressor ... 27 2.1.3 Piston compressor... 27 2.2. COMPRESSOR LUBRICATION ... 29 2.3. THE SEALING SYSTEM ... 32 2.3.1 Static seals ... 33 2.3.2 Shaft seal ... 34 2.3.3 Mechanisms of gas flow through static seals ... 36 2.3.3.1 Seal interface mechanism ... 36 2.3.3.2 Permeation ... 37 2.3.4 Shaft seal dynamic sealing mechanism ... 38 2.3.4.1 Lubrication regime ... 39 2.3.4.2 Fluid viscosity ... 41 2.4. EXPERIMENTAL SETUP ... 41 2.5. UNCERTAINTY ANALYSIS ... 44 2.5.1 Temperature ... 45 2.5.2 Pressure ... 45 2.5.3 Volume ... 45 2.5.4 Concentration variation with time ... 45 2.6. TEST PROCEDURE ... 46
2.6.2 Gas analyzer calibration ... 47 2.6.3 Accumulation volume tightness ... 48 2.6.4 Compressor lines preparation ... 48 2.6.5 Compressor installation ... 49 2.7. HOUSING FLUID PRESSURE AND TEMPERATURE ... 49 2.7.1 Variable displacement mechanism ... 49 2.8. COMPRESSOR EMISSIONS ... 52 2.8.1 Standstill mode ... 52 2.8.1.1 Unused compressors ... 52 2.8.1.2 Aged compressors ... 53 2.8.2 Running mode ... 54 2.8.2.1 Unused compressors ... 54 2.8.2.2 Aged compressors ... 56 2.9. SHAFT SEAL OIL EFFECT ... 57 2.10. ENDURANCE TESTS ... 58 2.10.1 The NEDC cycle ... 58 2.10.2 Compressor B1 test results ... 59 2.10.3 Compressor B2 test results ... 63 2.11. SHAFT SEAL REFRIGERANT EMISSIONS OF AGED COMPRESSORS ... 66 2.11.1 Measurement principle ... 66 2.11.2 Test results ... 67 2.12. WEAR ... 68 2.12.1 Shaft parameters ... 69 2.12.2 Wear rate ... 69 2.12.3 Shaft surface texture ... 70 2.12.4 Polymer transfer ... 72 2.13. SHAFT SEAL OIL LEAKAGE ... 72 2.14. CONCLUSIONS ... 74 2.15. BIBLIOGRAPHY ... 75 3. SHAFT SEAL REFRIGERANT EMISSIONS ... 78 3.1. SHAFT SEAL DESIGN ... 78 3.1.1 Closing forces ... 79 3.1.1.1 Preload ... 79 3.1.1.2 Pressure load ... 79 3.1.2 Sealing modes ... 80 3.1.3 Polymeric materials ... 80 3.1.4 Interface characteristics ... 81 3.1.4.1 Polymer surfaces ... 81 3.1.4.2 Metallic surfaces ... 82 3.1.5 Permeation ... 83 3.2. STATIC INTERFACE SEALING MECHANISM ... 83 3.3. WET CONTACT ... 85 3.3.1 Surface tension ... 85 3.3.2 Wettability ... 86 3.3.3 Meniscus formation ... 86 3.4. DESIGN EVOLUTION ... 87 3.5. SHAFT SEAL EXPERIMENTAL SETUP ... 90 3.5.1 Layout ... 91 3.5.1 The visualization system ... 93 3.5.3 The gas analyzer ... 93 3.5.4 Uncertainty analysis ... 93 3.5.5 Test procedure ... 94 3.6. TESTED SHAFT SEALS ... 94
3.6.2 Dimensions ... 95 3.7. SHAFT SEAL GAS EMISSIONS ... 96 3.7.1 Dry contact ... 96 3.7.2 Sample A ... 97 3.7.3 Shaft surface with leads ... 98 3.7.4 Wavy profile ... 99 3.7.5 Wet contact ... 100 3.7.6 Polished shaft ... 103 3.8. SEAL CONTACT VISUALIZATION ... 104 3.8.1 Deformation of lip rings ... 104 3.8.1.1 Samples A and B ... 104 3.8.1.2 Samples C and D ... 107 3.8.1.3 Sample E ... 109 3.8.2 Flow visualization ... 111 3.9. CONCLUSIONS ... 111 3.10. REFERENCES ... 113 4. SHAFT SEAL STRESS ANALYSIS ... 116 4.1. MATERIALS PROPERTIES ... 116 4.1.1 Metallic ... 116 4.1.2 Polymeric ... 116 4.2. STRESS ANALYSIS SOFTWARE ... 117 4.2.1 Element stiffness ... 118 4.2.2 Linear analysis ... 118 4.2.3 Nonlinear analysis ... 118 4.3. GEOMETRY DEFINITION AND BOUNDARY CONDITIONS ... 119 4.4. SOURCES OF UNCERTAINTIES ... 121 4.5. RESULTS AND DISCUSSIONS ... 121 4.6. CONCLUSIONS ... 124 4.7. REFERENCES ... 125 CONCLUSIONS ... 127 PERSPECTIVES ... 129 FRENCH SUMMARY ... 131
i A Surface m2 C Concentration ppm D Diameter m Dc Diffusion Coefficient m2s-1 E Young modulus Pa
E’ Effective elastic modulus Pa
F Force N
h Thickness m
H Hardness -
J Gas flux Mol s-1m-2
k Wear rate mm3 N-1 m-1
K Wear coefficient -
K Stiffness N m-1
l Leakage tube length m
M Gas molar mass g mol-1
Mass flow rate kgs-1
P Pressure Pa
Pe Permeability coefficient Mol mm-2s-1 MPa-1
Q Heat transfer W m-2
G Gas quantity mol
r Radius m T Temperature K t Time s u Uncertainty - u Displacement m V Volume m3 W Compressor work J w Strain energy J X Mole fraction - Greek letters
λ Mean free path m
ρ Density kg m-3
ν Velocity m s-1
τ Compression ratio -
η Viscosity Pa.s
ω Rotational speed rad s-1
µ Coefficient of friction -
σ Stress Pa
υ Poisson ratio -
ii
θ wetting angle rad
ε Strain -
Constants
MHFC-134a Molar mass of HFC-134a (=102.03) gmol-1
R Universal gas constant (=8.314x10³) kj kmol-1 K-1
Non dimensional numbers
Hs Hersey number Re Reynolds number Subscripts abs Absolute ac Accumulation Volume amb Ambient av Net c Chamber ch Channel g Gas g Glass Transition h Case HFC Hydrofluorocarbon LA Liquid/Air max Maximum min Minimum mix Mixture o Case oil Oil p Rubber pr Peripheral Rides ref Refrigerant SA Solid/Air sc Plastic
sh Seal Outer Case
iii
A/C Air Conditioning
ACEA European Automobile Manufacturers Association
ACN Acrylonitrile
ASEAN Southeast Asian Nations CCD Charge Coupled Device CEP Center for Energy and Process
CFC Chlorofluorocarbon
CIPM Committee for Weights and Measures
CL Contact Line
CMOS Metal Oxide Semiconductor
EHL Elasto-Hydrodynamic Lubrication
EU European Union
FEM Finite Element Method GWP Global Warming Potential
HFC Hydrofluorocarbon
HL Hydrodynamic Lubrication
HNBR Hydrogenated Nitrile Butadiene Rubber HVAC Heating Ventilation and Air Conditioning
ID Inner Diameter
LCCP Life Cycle Climate Performance
LED Light-Emitting Diode
LFR Leak Flow Rate
MAC Mobile Air Conditioning NBR Nitrile Butadiene Rubber NDEC New Europeen Drive Cycle OCR Oil Circulation Ratio
OD Outer Diameter
PAG Polyalkylene Glycol oil
PID Proportional–Integral–Derivative PMMA Poly-methyl Methacrylate
POE Polyol-ester oil
PTFE Polytetrafluoroethylene
PWM Pulse-width Modulation
Ra Center Line Average Roughness
Rmax Maximum Height Roughness
Rz Peak-to-valley Height Roughness
TEWI Total Equivalent Warming Impact USA United States of America
1 The air-conditioning system is today worldwide standard equipment in the automotive industry improving not only the thermal comfort but also the safety of passengers. This refrigerant system uses HFC-134a, a hydro-fluorocarbon refrigerant, whose emissions contribute to global warming as they accumulate in the atmosphere. The automotive air-conditioning system differs from stationary refrigerant systems, since the components are installed all around the vehicle engine compartment; the compressor is externally driven by the engine and is a so-called open-type compressor. This system configuration results in the use of an important number of seal components, which are the origin of refrigerant gas emissions. Among these components, the compressor has been identified as the most leak prone component representing 50 to 60% of the system emissions. The compressor most emissive component is the shaft seal that represents up to 50% of the compressor emissions, as it will be demonstrated in this dissertation.
The objectives of this thesis are to study the physical principles and to analyze the experimental results of gas emissions in order to contribute to the knowledge on the fundamental mechanisms and the important parameters of the compressor shaft seal gas emissions.
The environmental impacts of the mobile air-conditioning (MAC) system gas emissions are analyzed in Chapter 1. The different types of gas emissions during the system lifetime are described, as well as the leak detection tools used in the field to detect the system leak points. The first chapter ends with the European policies that have been recently approved to control the MAC system emissions.
The physical and experimental study of the compressor gas emissions are presented in Chapter 2. The original experimental setup developed to measure gas emissions when the compressor is at rest as well as when its shaft is rotating are detailed. Unused and aged compressors are tested to demonstrate the major increase in gas emissions with the shaft seal wear process.
The compressor shaft seal emissions are studied in more details in Chapter 3. The evolution of the shaft seal design is presented followed by the description of the original experimental setup developed to study gas emissions in standstill mode. Different shaft seal designs and shaft surface textures have been tested under dry and wet conditions. An experimental setup allows visualizing the shaft seal contact through a transparent shaft and so verifying the seal deformation under different working conditions.
The last chapter presents the beginning of the shaft seal stress analysis study using a finite element method software. The deformation and stress analysis results are presented and compared to gas emissions obtained in Chapter 3.
3
Chapter 1
M
OBILE
A
IR
C
ONDITIONING
(MAC)
SYSTEM REFRIGERANT
EMISSIONS
Introduction
The first chapter of this study aims at answering the question: Why is it important to study refrigerant emissions from the MAC compressor?
The chapter starts with the description of HFC-134a refrigerant emissions and their contribution to global warming. A description of the MAC system and its leak sources is performed.
Section 3 presents the leak flow rate (LFR) of new MAC systems as well as the contribution of each component to the system emissions. The compressor contribution varies between 50 and 60% of the total system emissions, depending on the system design, making it the most leak prone component.
A description of the different types of gas emissions during the system lifetime is performed and the market growth of air conditioning vehicles is presented. Section 5 introduces the leak detection tools used by professional technicians to search the system leak points and evidences their low sensitivity, as well as the inappropriate use with the shaft seal design. The chapter ends with the European policies to control MAC system emissions of new vehicles and the most recent designs. The high leak rates due to the aging process, in combination to an increasing impact on the environment, increase the importance of emissions from MAC compressors.
4 The Mobile Air Conditioning (MAC) System is an important part of the vehicle Heating Ventilation and Air Conditioning (HVAC) system. The cooling capacity is mainly used to compensate the latent and sensible thermal loads improving comfort of passengers and avoiding the windshield fogging regardless of the external weather conditions.
The air conditioning system is based on a vapor compression cycle that uses a hydrofluorocarbon (HFC) refrigerant, usually HFC-134a, whose emissions contribute to the human induced global warming as they accumulate in the atmosphere. The study of these refrigerant emissions is the main motivation of this work.
As it will be presented, a MAC system emits from leak sources. This chapter examines the MAC system refrigerant emission levels as well as the leak test methods to detect and locate the leaky points. The contributions of each component to the system overall refrigerant emissions are also presented as well as its environmental impact.
1.1. Environmental impact of MAC emissions
The HFC-134a is the most used refrigerant representing 80% of the market [WOR02], and it has been the first HFC introduced in the market, especially in MAC systems, in domestic refrigeration and small commercial systems. Mobile air conditioning has been identified as the most emissive refrigerant domain (see Figure 1-1). The MAC system represents 78% of the worldwide HFC emissions followed by the stationary A/C with 9%. This fact is related to the MAC system design with an open type compressor, and elastomer hoses and fittings to connect the system components, as presented in Section 1.2.
The Global Warming Potential (GWP) of HFC-134a is 1,430 to a time horizon of 100 years [AFE06], which means that one gram of HFC-134a released to the atmosphere is the equivalent of 1.4 kg of carbon dioxide (CO2). Since HFC-134a does not contain chlorine or
bromine, it does not contribute to the ozone depletion. However, HFCs are active gases that contribute to the human induced global warming. HFCs are included in the group of gases listed in the Kyoto Protocol, which has been ratified by the European Union.
The worldwide demand of HFC-134a was about 121,000 tons in 2003 [CLO05] and it is expected to continue to increase mainly due to the rapid growth of the China automobile industry (passenger cars, minibus, other buses and trucks). The passenger cars are highly demanded in China with a growth rate of 24% per year.
HFCs are active gases in the atmosphere. A relatively simple way to verify the global emissions of HFC-134a is to measure its concentration in the atmosphere. Figure 1-2 shows
1. Mobile Air Conditioning (MAC) system refrigerant emissions
Figure 1-1 Worldwide HFC emissions in 2003 split by domain [CLO05]. Mobile A/C 78% Domestic 0% Commercial 7% Transport 3% Industry 3% Stationary A/C 9%
5 the evolution of HFC-134a concentration in parts per trillion (ppt) between 1995 and 2007 all around the world: Ireland (Europe), California (West Coast of the United States); Barbados (East of the Caribbean Sea), Samoa (Pacific Ocean) and Tasmania (Australian island).
Figure 1-2 Atmospheric concentration of HFC-134a [AGA08].
These measures show that the HFC-134a concentration in the atmosphere has an exponential evolution since 1995 and in 2007 has a value of 38 ppt in Tasmania and 44 ppt in Ireland and California. Therefore, in 12 years, the HFC-134a concentration has been multiplied by a factor of 23 worldwide. The question is: what is inducing such important release of gas to the atmosphere? As mentioned before, the main user of HFC-134a is the refrigeration industry with 80% of the market. Among the different refrigerant applications, the MAC system is clearly the most emissive equipment of the refrigeration industry (see Figure 1-1). Therefore, the air conditioning system used in the automotive industry is the main contributor to HFC-134a emissions.
The next two sections present the MAC system design and its components, as well as the refrigerant emissions at the system and components levels.
1.2. MAC system design
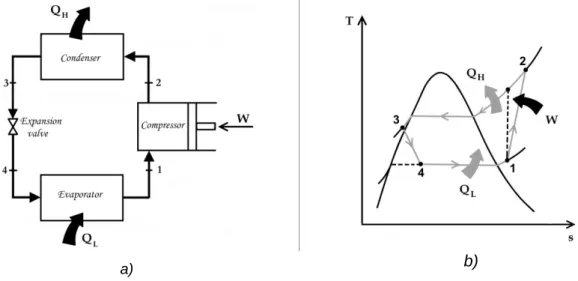
The MAC system is based on the refrigerant vapor compression cycle. Typically, a refrigerant vapor compression cycle is composed of a compressor, two heat exchangers, an expansion device, an accumulator and the working fluid, the refrigerant, that evaporates and condensates during the cycle (see Figure 1-3).
The saturated vapor at low pressure enters the compressor and undergoes an irreversible near adiabatic compression, evolution 1 to 2. Heat is then rejected at constant pressure in evolution 2 to 3 and the working fluid exits the condenser as a slightly sub-cooled liquid. The refrigerant at state 3 enters the expansion valve and expands to the evaporating pressure. The working fluid is then evaporated at constant pressure, evolution 4 to 1, to complete the cycle. Compressor moving parts are oil lubricated to avoid metal-to-metal contact, thus reducing energy losses and wear.
6
a) b)
Figure 1-3 a) Refrigerating system lay-out b) T-s diagram for a vapor compression refrigeration cycle.
1.2.1 The system vehicle integration
For a stationary refrigerating vapor compression cycle as used in refrigerators, the compressor work is generated by an electrical motor located inside the hermetical compressor casing. The MAC system differs from these stationary refrigerating systems, since the components are installed all around the vehicle engine compartment and the compressor is driven by the engine through a belt-pulley mechanism (see Figure 1-4). The compressor speed is then proportional to the engine speed. The evaporator is a micro-channel heat exchanger and is normally located inside the dashboard, so that it can absorb heat from the vehicle cabin. The condenser is placed at the vehicle front to ensure a free air flow over it to condensate the refrigerant. Rigid and flexible hoses are used to transport the refrigerant throughout the system. All these components are linked by fittings to allow components replacement during the vehicle life time.
7 The compressor is attached to the engine and connected by two flexible hoses to the thermal expansion valve and the condenser (see Figure 1-5). The flexible hoses reduce vibrations coming from the compressor, facilitate assemblage of components and, more importantly, disconnect engine movements from the MAC components fixed on the walls of the engine compartment or inside the dashboard. The liquid refrigerant flows from the condenser to the expansion valve via a rigid aluminum hose. The expansion valve and the evaporator are assembled in the HVAC unit. The pressure sensor and the service valves are brazed on the aluminum hoses, and the receiver is usually coupled with the condenser. If an orifice tube is used as expansion device, the receiver is replaced by an accumulator and placed in the compressor suction line to prevent liquid refrigerant from being drawn into the compressor. Each component and connections have a sealing system to avoid fluid (refrigerant/oil mixture) to flow out of the circuit. The sealing system is composed by an elastomer seal and its casing. Often the seal is the weakest link in the system and allows losses of fluid that can make the system stop. Any clearance, however small, allows the passage of refrigerant molecules. The fluid flows through micro gaps, the driving forces being the differences of pressures. The seal performance also depends on other variables such as temperature, mating surface topography, seal material properties, seal design, and applied loads.
Some examples of components and fittings sealing technology are presented hereafter.
Figure 1-5 Perspective of a single evaporator car refrigerating system.
1.2.2 Heat exchangers and expansion valve
The two compact heat exchangers are located one in the front of the vehicle, the condenser, and the other in the vehicle cabin dashboard, the evaporator. Usually, the thermal expansion valve is fixed to the evaporator and the accumulator to the condenser (see Figure 1-6). The sealing system is composed of one or several elastomer o-rings that are compressed during assemblage to create a static seal effect. The elastomer o-rings require a low compression force, less stringent machining tolerances and surface finish than metal-gasket seals.
8
a) b)
Figure 1-6 Examples of heat exchangers and expansion device sealing system.
1.2.3 Open-type compressor
The compressor is the main component of the MAC system. The compressor body is made of three blocks: rear, cylinder, and front. It encloses the compression mechanism that is belt driven by the vehicle engine. The clutch assembly controls the compressor operation (see Figure 1-7).
Gasket and o-ring static seals are used to seal the compressor body blocks and fittings. As mentioned before, the compressor mechanism is externally driven by the engine (open type), so a particular seal is necessary to seal the space between the shaft and the casing. This particular seal is called the shaft seal. The shaft seal is placed in the compressor front block followed by a felt ring that absorbs the lubricating oil that leaks through the shaft seal.
The complexity of the shaft seal is related to its double working mode: static seal when the shaft is at rest and dynamic seal when the shaft is rotating thus exposed to the wear effect. That is the reason why the shaft seal is the most leak prone component, not only of the compressor, but also of the MAC system, as it will be demonstrated throughout this study.
Figure 1-7 MAC compressor exploded view.
1.2.4 Fittings
The component fittings are composed of two aluminum flanges and one or more static seals. Flanges are screwed and seals change of shape in order to contain the refrigerant (see Figure 1-8).
Axial and radial applications are the most common types of o-rings in a MAC system. Figure 1-8a presents a connection with both configurations. The gasket seal can also be found in a connection and it is the combination of two materials: elastomer and metal (see Figure 1-8b).
9 The number of fittings in a MAC system is variable. A minimum number of 8 to 16 can be found in a single or double evaporator system respectively.
a) b)
Figure 1-8 Fittings sealing system; a) o-ring type; b) gasket type.
1.2.5 Hoses
The MAC system hoses can be flexible or rigid. The flexible hoses are used to facilitate component assemblage and to avoid compressor and engine vibrations to be transmitted to the refrigerant system.
The size of a typical gas molecule is less than one nanometer. The gas molecules can therefore diffuse through the smallest gap or material pores. The flexible hoses are particularly sensitive to the diffusion phenomenon due to their important elastomer surface in contact with the refrigerant.
The flexible part is linked to the rigid aluminum hose by means of crimps (see Figure 1-9). The flexible hoses are made of one or multiple layers of materials in order to reduce refrigerant permeation and to better absorb vibrations.
Figure 1-9 MAC system discharge line.
1.2.6 Working fluid and lubricating oil
Before the Montreal Protocol, the MAC systems used CFC-12 as a refrigerant. Since 1990, CFC-12 has been replaced by HFC-134a in developed countries. Today, it is assumed that all vehicles including cars, light commercial vehicles, and truck cabins sold in developed countries have been retrofitted or initially charged with HFC-134a.
HFC-134a is a pure, non flammable refrigerant used primarily as a refrigerant in the refrigeration industry and automobile air conditioners. Another potential use can be the application in plastic foam as a blowing agent, as a solvent for special cleaning applications, and as a propellant in aerosols.
10 HFC-134a has a strong polarity and is no longer compatible with conventional mineral oils. This fact has led to the introduction of new synthetic lubricants, such as POE (polyol-ester) or polyalkylene glycol (PAG) oil. PAGs are used in the MAC system due to the low water absorption, but they are not used in stationary applications due to their low electric resistivity, which is not compatible with hermetic motor-compressors.
The primary function of the refrigeration lubricant is to provide good compressor lubrication. However, the lubricant oil is miscible with refrigerant and circulates all along the system, so depending on the clearance of the compressor, the oil circulation ratio (average ratio of oil mixed with the refrigerant) varies from 2 to 5%.
1.3. System and components emissions level
An extensive study has been performed by the Center for Energy and Process (CEP) in collaboration with the European Automobile Manufacturers Association (ACEA) in 2006 in order to determine the refrigerant emission levels of new MAC systems [CLO06]. The conclusions point out an annual leak flow rate average value of 10 g/yr for a fleet of 39 vehicles of 10 different types. A comparison study has also been performed to compare the system and the components emission levels. It has been proven that the sum of each component Leak Flow Rate (LFR) is equal to the system LFR and, in all systems, the compressor is the most leak prone component. The compressor contribution varies between 50 to 60%, the lower value corresponding to the use of flexible hoses with high permeation rates.
Figure 1-10 shows the average contribution of components to the system emissions. The compressor represents 57% of refrigerant emissions. It is followed by the suction line and the expansion device with 16% and 10% respectively. The high LFR of the MAC compressor is explained by its complex sealing system, in particular, the shaft seal that performs static and dynamic sealing.
Figure 1-10 Contribution of components to the system emissions at 1020 kPa.
According to the ACEA report [ACE07], the average age of a European car is about 12 years and the average annual distance travelled is about 15,000 km. This means that the vehicle annual operating time is only 300 to 500 hours, which represents only 3 to 6% of the yearly hours. Furthermore, the percentage of the time the air conditioning is switched on never exceeds 70% in the United States and 60% in Europe [JOH04]. Therefore, a MAC system in Europe is 95 to 98% of its lifetime at rest. For that reason, the emission rates at rest define the system leak flow rate as it will be demonstrated further on.
Compressor with fittings 57% Discharge line 3% Condenser with fittings 8% Expansion valve 10% Evaporator with fittings 2% suction line 16% Others 4%
11 Table 1-1 presents the leak test results in standstill and running modes for three different new MAC systems. The running tests have been done by repeating NDEC cycles.
It is observed that the system refrigerant emissions in running mode are 2 to 3 times higher than those at rest. Nevertheless, as explained before, the running mode represents only 2 to 5% of the vehicle lifetime, so the refrigerant emissions at rest define the system leak flow rate. Notwithstanding, the running mode is extremely important to define the system emissions during the lifetime, since it will change the compressor sealing ability, more particularly, the shaft seal performance (see Chapter 2).
Table 1-1 Annual Leak Flow Rate of new MAC systems.
1.4. Emissions during the MACs lifetime
Emissions are defined as substances emitted to the atmosphere. Those associated to MAC systems are divided in two groups: the refrigerant emissions called direct emissions and the CO2 emissions called indirect emissions.
The indirect emissions are related to the additional CO2 emissions due to the vehicle engine
fuel consumption while the MAC system operates. They result from two mechanisms: first, by the direct transfer of the mechanical power to the compressor and the increase of vehicle weight and, second, the electrical power used by the fans, blowers, actuators and the control system. The Total Equivalent Warming Impact (TEWI) and the Life Cycle Climate Performance (LCCP) are values used to evaluate these emissions.
1.4.1 Direct emissions
The refrigerant emissions due to MAC systems can occur in three different phases [IPCC06]: manufacturing process,
vehicle lifetime, and end-of-life.
At the manufacturing process, refrigerant emissions are usually very low as they result from the charging process. However, at the vehicle end-of-life, emissions depend on the national regulatory policies and on the recovery efficiency. If technicians are not equipped and trained to recover the refrigerant, they will simply vent all the system charge to the atmosphere. The system emissions during the vehicle lifetime are difficult to evaluate as they depend on many issues described hereafter.
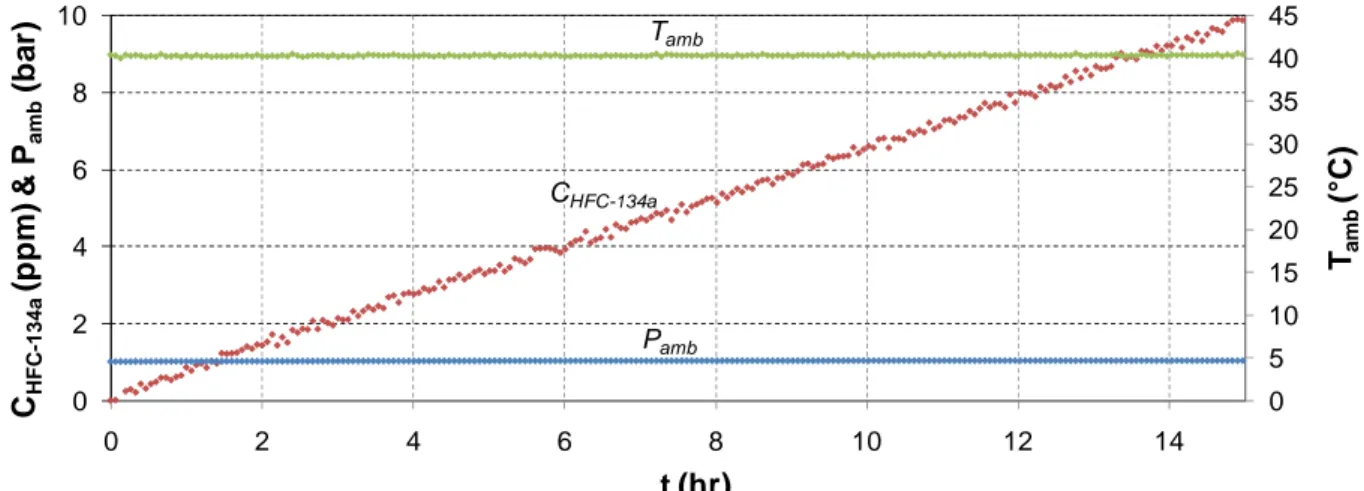
The MAC system is permanently pressurized and, in standstill mode, the system emission level is mainly dependent on the refrigerant pressure. The system emissions lead to a progressive reduction of the system refrigerant charge. A computer simulation has been done using REFPROP 7® to calculate the system pressure evolution with the refrigerant charge in standstill mode. Figure 1-11 shows the evolution of pressure and vapor quality with the refrigerant charge for a MAC system with an internal volume of 5.2 liters and an initial charge of 940 g. It can be observed that the system pressure is constant while there is
Annual LFR [g/yr]
Vehicle Duration [hr] Refrigerant loss@20 °C [g] LFR [g/hr] Duration [hr] Refrigerant loss [g] LFR [g/hr] (rest + running mode)
V1 8529 8.57 1.00E‐03 231 0.52 2.25E‐03 9.1
V2 8524 7.49 8.79E‐04 236 0.54 2.29E‐03 8.0
V3 8543 5.07 5.93E‐04 217 0.25 1.15E‐03 5.3
12 two-phase equilibrium (vapor quality < 100%). After losing 80% of the charge, there is no more liquid refrigerant in the system and the system pressure drops rapidly.
Unless there is a component failure or an accident, the refrigerant charge will not be lower than 50% since the vehicle owner will recharge it due to the lack of cooled air (see Section 1.4.1.1). Therefore, during the vehicle lifetime, the MAC system refrigerant emissions in standstill mode do not depend on the refrigerant charge. So, as refrigerant is always in the equilibrium phase, the pressure only depends on the temperature of the system coldest point.
Figure 1-11 System pressure and vapor quality evolution with refrigerant charge at 23°C in
standstill mode.
It is more difficult to limit refrigerant emissions during the vehicle lifetime than those emitted during the manufacturing process and at the end-of-life of the refrigerating system. Emissions during the manufacturing process and at end-of-life are only related to the refrigerant charge and recovery process, while those produced during the vehicle lifetime can be divided in:
• regular, and • irregular.
These different types of MAC refrigerant emissions are discussed hereafter.
1.4.1.1 Regular emissions
Refrigerant leakage is mainly due to a pressure differential between the refrigerant and the atmosphere, separated by a pressure boundary. This pressure boundary can be a seal component or an elastomer hose. The MAC system has an important number of leak sources, see Section 1.2, which are the causes of the refrigerant regular emissions. These emissions depend also on the number of leak points, the leak geometry, the component temperature, and the presence of the compressor lubricating oil in the seal contact.
A leak is defined as a hole or porosity in the wall of an enclosure capable of passing a fluid from one side of the wall to the other. The leakage rate describes the number of molecules leaking per unit of time and is defined both by the leakage rate and the pressure difference across the leak path.
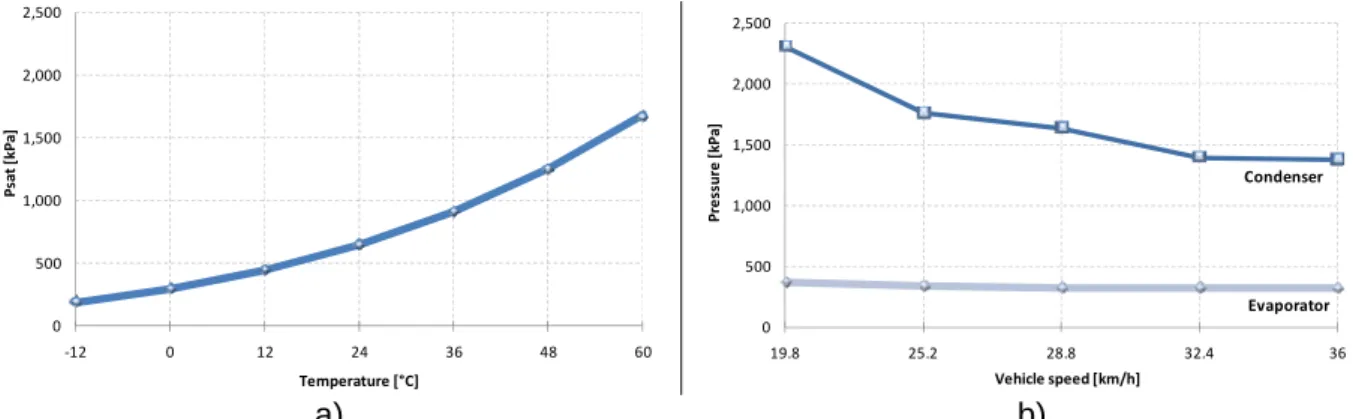
When the refrigeration system is at rest, the refrigerant temperature reaches the equilibrium with the ambient temperature and the system pressure corresponds to the saturating pressure. Figure 1-12a presents the variation of the system pressure with ambient
80 82 84 86 88 90 92 94 96 98 100 150 250 350 450 550 650 750 940 840 740 640 540 440 340 240 200 180 160 150 140 100 50 Va p o r qua lit y [% ] Sys te m pre ss u re [k P a] System refrigerant charge [gr] Pressure Vapor quality
13 temperature. Therefore, the system average pressure will be higher in hot climates than in colder ones and, for the same sealing system technology, refrigerant emissions will decrease at lower outdoor temperatures.
When the compressor starts running, a pressure difference is rapidly established: the evaporator pressure (low-pressure side) and the condenser pressure (high-pressure side), see Figure 1-12b. The low-pressure side is relatively stable around 340 kPa and the condenser pressure is strongly dependent on the condenser heat exchange and the outdoor temperature, as well as the air speed. Components bearing the high pressure are parts of the compressor rear block, the discharge hose, the condenser, the receiver, the liquid hose, and partially the expansion valve. The evaporator, the suction hose, and the compressor housing are at the evaporator pressure. Therefore, the compressor housing pressure is generally lower in running mode than at rest.
a) b)
Figure 1-12 MAC system pressure evolution in a) standstill and b) running mode.
Tightness degradation is of major importance to the MAC system regular emissions since it increases refrigerant emissions. Degradation of seals can be caused by their natural ageing or by incorrect servicing procedures.
For static seals, like the o-rings and gaskets, the seal ageing results from the temperature variation in the engine compartment during the year and the switch between running and standstill modes, as well as the pressure cycling and vibrations produced by the compressor and the engine.
For the dynamic seal, the shaft seal, the tightness degradation is related to those factors described for static seals plus the wear of the sealing interface. The shaft seal wear depends on the lubrication during the shaft rotation and, more importantly, when shaft starts running to avoid running under dry conditions, thus increasing the wear rate. This thesis will address this issue in detail in next chapter.
Regular emissions result in a progressive loss of the refrigerant charge. The consequence is the reduction of the system cooling capacity at a given threshold. For a vehicle owner, the single parameter to evaluate the functionality of the refrigerating system is the supply air temperature in the cabin.
A laboratory experiment simulating a slow leak in a steady state regime has been done in order to determine the MAC system performance degradation with the decrease in the system refrigerant charge (see Figure 1-13).
Figure 1-13 shows the evolution of the cabin supplied air temperature with the refrigerant charge variation. When the refrigerant charge is lower than 40 to 50% of the initial charge, the refrigerant mass flow rate delivered by the expansion valve is lower than required and the supply air temperature increases. Therefore, the vehicle owner could not feel significant
0 500 1,000 1,500 2,000 2,500 ‐12 0 12 24 36 48 60 Ps at [k P a] Temperature [°C] 0 500 1,000 1,500 2,000 2,500 19.8 25.2 28.8 32.4 36 P re ssu re [k P a] Vehicle speed [km/h] Condenser Evaporator
14 changes in the blown air temperature until the system reaches the mid charge and in hot conditions. After that, he will go to a garage to recharge it.
Figure 1-13 Supply air temperature evolution with refrigerant charge in steady state regime.
During the recharge, the potential leak sources occur at the service valves because each time a hose connection is installed or removed, there is a release of refrigerant. This leak is estimated at less than 10 grams. The use of special refrigerant containers, small cans, with emissive valve systems, also contributes to emissions during the system recharge. The refrigerant emissions during service are more pronounced for aged vehicles. As the compressor shaft seal wears out, the refrigerant emissions increase rapidly making the vehicle owner going often to the garage for repair, thus increasing refrigerant emissions during servicing.
1.4.1.2 Irregular emissions
Irregular emissions can take place by seal failures or by accidents. The component failure can generate the complete refrigerant loss of the system. It can be caused by the incorrect design of the sealing system or even by its incorrect installation. The high porosity and cracks of brazed joints, and sealing surfaces with material deposits are characteristic defaults that take place during the manufacturing process of system components, and their levels depend on the quality process. For the compressor shaft seal, an excessive wear of the mating surfaces causes the seal failure. During this study, emissions higher than 1000 g/yr have been measured for aged compressors at rest (see Section 2.8).
Accidents generally affect the integrity of the fittings and components installed in the vehicle front. According to the vehicle impact strength, the MAC system damages can go from the total refrigerant loss in a few seconds to very small perforations in the condenser, which can also be the result of the road or stones impacts. Accidents can lead to a component failure resulting in the release of the total refrigerant charge to the atmosphere.
It is difficult to detect and locate damages caused by the small impacts on the condenser, since the leak points are situated in a vast surface area compared to a component connection. The affordable leak detection tools used by professional technicians are not adapted to detect small leak levels, especially on the shaft seal. The leak detection tools are analyzed in Section 2.6.
The average refrigerant charge of a MAC system depends on the vehicle type. Nowadays, typical values are 500 grams for a single evaporating system and 900 grams for a double evaporating system. If a seal failure of a charged system occurs, the equivalent of 650 kt to 1170 kt of carbon dioxide will be rejected to the atmosphere.
8 10 12 14 16 18 20 22 24 26 28 550 518 485 452 420 387 355 322 289 257 224 191 159 126 Te m p e rat u re [° C ] System refrigerant charge [gr]
15 1.4.2 Total direct emissions
In 2003, the total HFC direct emissions have been estimated to 138 kt whereof 85% results from HFC-134a [CLO05]. The two major contributors are the USA with 87 kt and the EU25 with 22 kt, both representing nearly 80% of the total HFC direct emissions.
If only HFCs are considered, the MAC system is the most emissive refrigerating equipment representing 78% of the total emissions followed by stationary refrigerating systems (see Figure 1-1). This fact is related to the rapid switch from CFC-12 to HFC-134a and to the relatively high emission rate of MACs considering all direct emissions.
China has banned the use of CFC-12 in new vehicles as of January 1st, 2002. The same trend has been followed in India where all new MAC systems use HFC-134a.
In order to consider the impact of HFCs in the atmosphere, CO2 equivalent emissions can be
calculated by multiplying HFC emissions by the associated GWP. Values of 115 and 47 million tonnes of CO2 equivalent emissions are found for USA and EU25 respectively (see
Figure 1-14). These high refrigerant emissions and their impact on the environment justify the study of the system sealing mechanism. Next chapter will focus on emissions from the compressor, the most leak prone component, with a specific interest in the shaft seal behavior.
Figure 1-14 Refrigerant CO2 equivalent emissions in 2003.
1.5. Market evolution
The car industry is the first user of MAC systems. However, the MAC system can also be found in light commercial vehicles, truck cabins, agricultural machines, buses, and coaches. The worldwide production of motor vehicles in 2006 was 69.2 million units. In 2000, in Europe, 85% of passenger transport was carried by cars, buses and coaches, and 70% of goods were transported by road. The transport activity in EU25 by the horizon of 2000-2020 is expected to growth 55% for road freight transport and 36% for private car transport [ACE07].
Between 2001 and 2006, new car registrations rose 395% in Ukraine and 114% in India. Registration rates higher than 60% can also be found in the Southeast Asian Nations (ASEAN) and in Russia (see Table 1-2). In 2007, 6.2 million passenger vehicles have been
0 20,000,000 40,000,000 60,000,000 80,000,000 100,000,000 120,000,000 [t ]
16 sold in China, around 20% more than in 2006, and only 4% of the population owns a car, compared to 60% in Europe and 80% in America [ECO08].
Safety and thermal comfort of passengers have been considered the most important factors in developing the automobile air conditioning system. The car industry was the first using such a system. In fact, first it has been a large American phenomenon and then in Japan after the ‘70s. By 1980, more than 80% of American new cars had factory-installed air conditioning system and a large portion of the Asian car industry as well. The number of air-conditioned cars in Europe started to significantly increase in the ‘90s and it is expected that 9 vehicles in 10 will be air-conditioning equipped by 2010 [BAR03].
The number of automobile air conditioning systems in China has been multiplied by four in seven years (see Figure 1-15) and this market continues to grow. In 2003, the sales of cars in India were 900,000 units and 68% of them were equipped with a MAC system [IPC05]. These facts allow concluding that the automobile air conditioning is a worldwide phenomenon with very high market penetration rates. Therefore, it is essential to study the leak prone component of the MAC system, i.e. the compressor, in order to reduce its emission levels as well as the system direct impact on the environment.
Table 1-2 New car registrations (in thousands) [ACE07].
Figure 1-15 Evolution of MACs in buses, trucks, and cars in China (CFC-12 and HFC-134a) [IPC05].
1.6. Leak detection tools
The leak test, usually a non-destructive test, is used for two purposes: the detection and the location of leaks, and the measurement of the fluid flow through a leak, the fluid leakage. The test methods described hereafter are not exhaustive and can only be used to detect and locate component leaks in the field. These test methods have the particularity of using the system operating fluid as the tracer gas: electronic leak detector, soap bubble, and fluorescent leak detector dye.
2001 2006 Change
South Korea 1468 1218 -17%
ASEAN 1167 1893 62%
India 818 1750 114%
Ukraine 75 371 395%
Russia (light vehicles) 1272 2129 67%
MERCOSUR 1778 2389 34% 0 1 2 3 4 5 6 7 1995 1996 1997 1998 1999 2000 2001 2002 Th o u sa n d uni ts Year
17 1.6.1 Electronic leak detectors
The electronic leak detector is a portable equipment used to qualify refrigerant leaks (see Figure 1-16b). There are different leak detector technologies and sensitivities. However, the majority of professional technicians will use inexpensive leak detectors, like the one presented hereafter, which is based on a heated diode technology.
The refrigerant detection is achieved by using a heater and a detector unit (see Figure 1-16a). The detector unit is composed of a cylinder covered externally by a platinum coil and internally by a ceramic layer. The mixture air/refrigerant is sucked from the leak point surroundings, heated, and then reaches the heated detector. If refrigerant concentration is below a certain level, the alkaline atoms from the ceramic layer will naturally travel to the platinum coil. As refrigerant concentration increases, the halogen refrigerant inside the detector ionizes the alkaline atoms and a voltage difference is created between the ceramic layer and the platinum coil. The generated electrical current is proportional to the refrigerant concentration resulting in an audible alarm, which intensifies with refrigerant concentration.
a) b)
Figure 1-16 a) Schematic drawing of the heated diode technology; b) electronic leak detector with
heated diode technology.
The detector sensitivity is a concentration measure that gives a minimum measurable signal and depends on the minimum gas molecules entering the detector. The operating principle of the heated diode technology implies the degradation of the detector and its consequent replacement.
When the refrigerant passes through a seal, the molecules will diffuse into the atmosphere and, as the distance between the leak point and sniffer increases, the refrigerant concentration decreases rapidly. Therefore, if the sniffer is not close enough to the leak source, the leak will not be detected. Professional technicians must pay attention to the sniffer positioning in order to detect the smallest possible leaks. But, how to detect a compressor shaft seal leak problem? In fact, as the shaft seal is hidden by the clutch assembly, the sniffer will always stay too far away from the leak point, thus making impossible to detect the leak of the shaft seal except large leak (> 50 g/yr). The only way is to disassemble in order to have direct access to the seal, which is never done in the field. Therefore, it can be concluded that the electronic leak detectors are not adapted to leak check the compressor shaft seal.
1.6.2 Soap bubble testing
The soap bubble testing is a wet testing method, which consists in the observation of a pressurized component that has been sprayed or brushed with a soap solution. If the pressure at the end of the leak path is enough to overcome the surface tension forces, then bubbles will be formed and the amount of bubbles per minute can signify the size of the leak.
18 The bubble size is crucial to the leak detection. Different MAC system component connections can be leak tested using the refrigerant accumulation method. However, this test method is not adapted to the shaft seal because it is hidden by the pulley. Bubbles are visible only for leak rates higher than 120 g/yr. On a connection presenting a leak rate of 120 g/yr, bubble sizes are very small and almost impossible to visualize in the engine compartment environment (see Figure 1-17).
The soap bubble testing is not expensive, but has a very low sensitivity and is not adapted to leak check the shaft seal.
1.6.3 Fluorescent leak detector dye
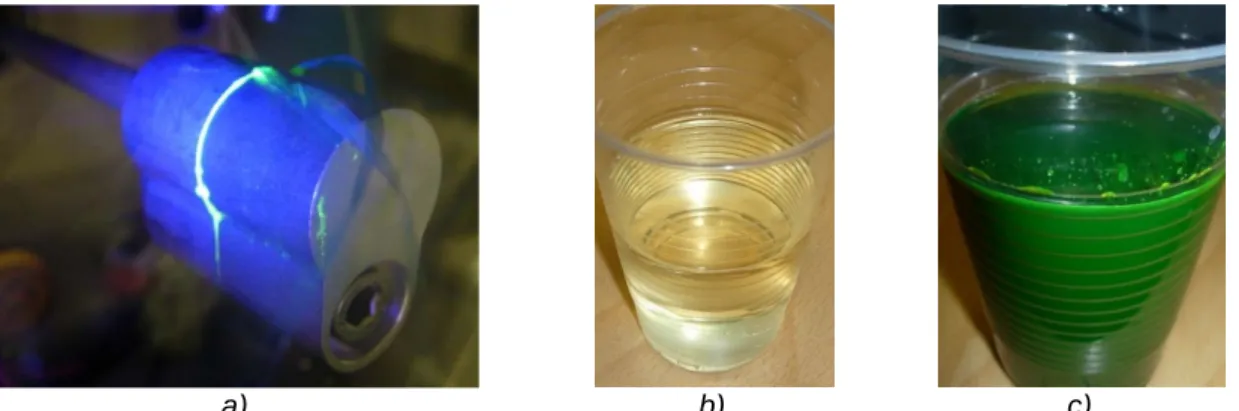
Another leak test method consists in introducing a colored fluid in the MAC system, which is carried by the compressor lubricating oil. When the compressor is running, the lubricating oil travels around the system producing an oil layer around the internal walls. When the oil finds a gap, it will flow through it and reach the exterior. Afterward, an UV blue light is turned to the leaky component and is absorbed by the dye which will emit a visible yellow/green light (see Figure 1-18a).
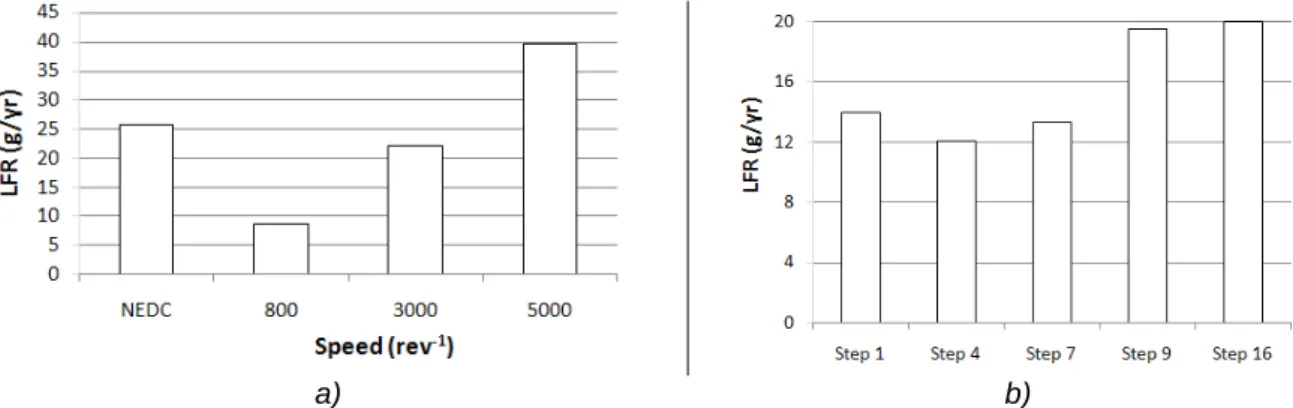
The dye visualization time mainly depends on the gap dimensions. Table 1-3 summarizes test results for different leak rates using a fluorescent leak detector. The LFR presented in Table 1-3 was calculated with a dry seal contact.
The fluorescent leak detector dye is used by a large number of auto technicians. The dye visualization time increases exponentially with the LFR decrease. It is expected that for low leak rates the oil cannot penetrate the gap and the detection will not be possible.
Table 1-3 Fluorescent leak visualization time.
Another drawback of this test method is that if too much dye is added to the circuit, the oil viscosity changes and this can adversely affect the compressor life. Disassembled compressors from used cars have shown a glowed yellow/green color even without a UV light, due to the excess of dye (see Figure 1-18c).
Similarly to the electronic leak detector and the soap bubble, the fluorescent leak detector dye is not adapted to leak check the compressor shaft seal since the dye will be hidden by
LFR [g/yr] 662,000 1,490 515 300 7.2 0.28
Visualization time [hr] 0.8 3 11 * ** ** * No evidence of dye after 14 days of test ** no evidence of dye after 20 days of test
a) b)
19 the clutch assembly. The dye will be visible only if the oil flow through the shaft is very important to reach the clutch.
Three different leak test methods used by professional technicians have been presented: electronic leak detector, soap bubble, and fluorescent leak detector dye. It was observed that none of them is adapted to leak check the shaft seal since it is hidden by the clutch assembly. Therefore, leaky compressors are not replaced increasing not only the system emissions but also the number of system recharges with the additional emissions during servicing.
1.7. Policies to control MAC refrigerant emissions
The fluorinated greenhouse gas (F-gas) HFC-134a is included in the basket of gases whose emissions are controlled by the Kyoto Protocol, which was ratified by the European Union (EU) in May 2002. The EU is taking measures to reduce F-gas emissions by 8% from 1990 levels during the period 2008-2012.
The EU has identified the MAC system as one of the major sources of HFC emissions and decided to prohibit the homologation of MAC systems filled with a refrigerant gas with a GWP higher than 150 from January 1st, 2011. From January 1st, 2017, vehicles equipped with a MAC system using an F-gas with a GWP higher than 150 (GWPHFC-134a = 1300) cannot be
sold on the European market. The recharging process of HFC-134a systems will be authorized after that date. Between 2011 and 2017, only MAC systems homologated before 2011 will be filled with HFC-134a [DIR06].
The EU Commission Regulation 706/2007 identifies the components to be leak tested, as well as the leak test method and conditions to determine the system or component leak flow rates. The test method chosen was the refrigerant accumulation method described in Section 1.10.1. The leak test starts with the system pre-conditioning followed by the refrigerant concentration measurement during 24 hours. The calculated leak flow rate is then multiplied by a correlation factor of 0.277. The correlation factor is based on the results of fleet tests of 40 European vehicles [CLO07].
The EU Directive 2006/40/EC also establishes a limit to the leak rate of MAC systems. Nowadays, refrigerating systems filled with a refrigerant whose GWP is higher than 150 are approved if the refrigerant leak flow rate value is smaller than 40 g/yr for systems with a single evaporator or 60 g/yr for double evaporator systems.
The phasing out of HFC-134a from MAC systems is only effective in Europe. Therefore, the use of the HFC-134a as an automotive refrigerant is expected to continue outside Europe.
a) b) c)
Figure 1-18 a) Tracer dye visualization; b) New PAG oil; c) Excess of dye in the PAG oil from a used
20 1.8. Design of new MAC systems
MAC systems have significantly improved since the first comfort cooling system was installed in 1990 [IPC05]. MAC system installations have been progressively improved based on three design criteria: thermal comfort improvements, lower fuel consumption, and refrigerant emissions reduction.
In terms of direct emissions, there are two ways to limit the impact of refrigerant emissions on the atmosphere:
• improve the leak tightness of actual systems and refrigerant recovery at end-of-life or • replace HFC-134a by a low GWP refrigerant.
The system tightness is directly related to its leak prone component, the compressor. More particularly, the shaft seal, as it will be demonstrated in Chapter 3.
The European HFC-134a phasing-out is accelerating the development of MAC systems with low GWP refrigerants. One of the possible candidates is carbon dioxide (R-744) with a GWP of 1, which is negligible compared to HFC-134a. R-744 is a refrigerant whose properties are very well known and documented, but the system pressure is 10 times higher than that of HFC-134a systems representing a technological challenge to maintain the system leak tightness.
New refrigerant R-1234yf with a GWP of 4 is also under development. It presents a system pressure similar to the HFC-134a, but it is not yet in mass production. Regardless of the refrigerant chosen, the system refrigerant tightness will be fundamental to maintain the initial system performance during the vehicle lifetime.
The development of hybrid vehicles gives the possibility to use hermetic electric compressors and, so, to decouple the MAC system from the engine. The market of electrical vehicles is still irrelevant, but the use of electrical compressors will facilitate considerably the refrigerant containment.
1.9. Conclusions
The MAC system is a permanent pressurized equipment that continuously releases refrigerant to the atmosphere. This release is mainly due to the use of an open-type compressor responsible for 50 to 60% of the system emissions. It has been noticed that HFC-134a atmospheric concentration has been multiplied by 23 in 12 years and these refrigerant emissions are essentially due to MAC systems.
Emission rates at rest define the system leak flow rate because the compressor will run 2 to 5% during the vehicle lifetime in Europe. The refrigerant pressure at rest depends on the ambient temperature, so refrigerant emissions will decrease at lower ambient temperatures and vice-versa. Nevertheless, the component ageing due to the running mode is critical to the compressor dynamic seal degradation.
Several field leak test methods used by car technicians have been compared and it was noticed that they are not adapted to leak check the compressor shaft seal nor sufficiently sensitive to leak test other components. Therefore, leaky compressors are not replaced increasing not only the system emissions, but also the number of system recharges with the additional emissions during servicing. The impossibility to detect relatively small leak rates of the shaft seal gives more importance to the study of the seal degradation due to wear.
21 In the last decades, there have been significant advances in MAC systems. However, most of the research work has been focused to improve the hose permeation and the fittings. There has been little published work on the compressor refrigerant emissions, particularly, the shaft seal.
The control of MAC system refrigerant emissions is essential to reduce its environmental impact. The EU is phasing-out HFC-134a in the automobile industry. This decision is speeding up the development of new MAC systems with low GWP refrigerants. For R-744 with a GWP of 1 but with a system pressure 10 times higher than that of HFC-134a systems, leak tightness is a challenge and especially for the compressor shaft seal. New blend refrigerants are also under development with saturating pressure in the same range as R-134a.
Regardless of the system refrigerant, the system tightness is fundamental to maintain the initial system performance during the vehicle lifetime and to avoid refrigerant recharging. This work aims at studying the refrigerant emissions of the most leak prone component, the compressor, and more particularly the compressor shaft seal.
Next chapter will detail the compressor emissions in standstill and running modes. The compressor ageing due to the running mode will also be analyzed.
22 1.10. References
[ACE07] European Automobile Manufacturers Association (ACEA), 2007. European automobile industry report 07/08.
[AFE06] Alternative Fluorocarbons Environmental Acceptability Study (AFEAS), 2006. Contribution of Greenhouse Gases to Climate Forcing Relative to CO2. www.afeas.org/greenhouse_gases.html.
[AGA08] Advanced Global Atmospheric Gases Experiment (AGAGE).
http://agage.eas.gatech.edu/data.htm.
[BAR03] Barbusse, S., Gagnepain, L., 2003. La climatisation automobile: impact énergétique et environnemental. ADEME, ref. 4343.
[CLO05] Clodic, D., Palandre, L., Saba, S., 2005. Inventories of the Woldwide Fleets of Refrigerant and Air-Conditioning Equipment in Order to Determine Refrigerant Emissions. ADEME/ARMINES.
[CLO06] Clodic, D, Yu, Y, 2006. Research study on the definition of the implementation of a method of measurement of annual leak rates (LFRs) of MAC systems. [CLO07] Clodic, D., Yu, Y., 2007. Elaboration of a correlation factor based on the fleet
tests and Mobile Air Conditioning (MAC) system laboratory tests. SAE technical paper 2007-01-1187.
[CLO96] Clodic, D., 1996. Zero leaks-Limiting emissions of refrigerants. Ashrae. 189 p. [DIR06] Directive 2006/40/EC. Emissions from air-conditioning systems in motor
vehicles. Official Journal of the European Union, June 14, L161-12. [ECO08] The Economist, 2008. April 26, pp. 73.
[FRO06] Frost & Sullivan, 2006. U.S. Consumer Buying Behaviors of R-134a Refrigerant for Light Vehicle Applications. Automotive Refrigeration Products Institute (ARPI).
[IPC05] Intergovernmental Panel on Climate Change (IPCC), 2005. Safeguarding the Ozone Layer and the Global Climate System: Issues related to hydrofluorocarbons and perfluorocarbons. pp. 295-314.
[JOH04] John, R., Valerie, H., Stephen, A., 2004. Significant Fuel Savings and Emissions Reductions by Improuving Vehicle Air Conditioning. Proceedings of the 15th Annual Earth Technology Forum and Mobile Air Conditioning Summit, Washington, D.C., April 13-15.
[KHO05] Khoury, G., Clodic, D., 2005. Method of Test and Measurements of Fuel Consumption Due to Air Conditioning Operation on the New Prius II Hybride Vehicle. SAE technical paper 2005-01-2049.
[MOR98] Moran, M. J., Shapiro, H. N., 1998. Fundamentals of Engineering Thermodynamics. John Wiley & Sons.
[PAL03] Palandre, L., Zoughaib, A., Clodic, D., Kuijpers, L., 2003. Estimation of the World-Wide Fleets of Refrigerant and Air-Conditioning Equipment in Order to Determine Forecasts of Refrigerant Emissions. The Earth Technology Forum,
23 Washington, April.
[WOR02] World Banc, 2002. Production sector presentation. The 19th Ozone Operations Resources Group (OORG), Washington, D.C., March 28.
25
Chapter 2
C
OMPRESSOR
R
EFRIGERANT
E
MISSIONS
Introduction
In this second chapter, gas emissions of new and aged compressors are studied. The chapter begins with the description of the compressor components, its compressor technology and its sealing system.
It goes on with the presentation of an original experimental setup developed to measure gas emissions when the compressor is at rest as well as when its shaft is rotating. Section eight includes the leak test results of new and aged compressors followed by the study of the lubricant oil effect on the shaft seal tightness.
In Section 10, the compressor aging process is investigated by performing endurance tests and analyzing gas emissions changes along the aging process.
A new experimental setup is presented in Section 11 to study the shaft seal emissions directly from the compressor. The shaft seal contribution to the compressor gas emissions is also calculated.
Finally, effects of shaft surface wear in the sealing region as well as of oil leakage resulting from the aging process are pointed out.
26 The compressor is the most important component of the MAC system because it makes the system running. As shown in the previous chapter, the compressor is the most leak prone component of the refrigerating system, representing in between 50 and 60% of the system refrigerant emissions. Therefore, the understanding of its refrigerant emissions is vital to reduce the system direct impact on global warming.
The literature regarding the MAC compressor is not abundant, even less for its sealing system. This may be due to the fact that this is a technological and production oriented field and very much influenced by the market competition. The compressor market reached about 60 million in 2005; it is shared by several MAC system manufacturers. Sales of the world largest provider of MAC compressors were set to 20.45 million units in 2007, which represented an increase of 6% compared to the previous year [TOY07].
The compressor is an aluminum structure usually composed of three different housings that are assembled and enclose the compression system (see Figure 2-1a). The assembly of the compressor different parts (rear housing, valve plate, oil plug, middle housing, front housing and shaft) introduces seals that are responsible for the compressor gas emissions. The number of parts to be sealed differs depending on the manufacturer and compression mechanism affecting the number of static seals. The dynamic seal, the shaft seal, is always a single one in an open-type compressor.
The compressor is activated by the vehicle engine by means of a belt-pulley driven mechanism. Usually, a clutch is added to the compressor pulley to control the compressor working mode (see Figure 2-1b). When only the pulley/bearing assembly is used, the compressor is designated as clutchless and runs continuously with the vehicle engine.
a) Compressor body b) Clutch assembly
Figure 2-1 The MAC compressor main parts.
2.1. The compression mechanism
MAC compressors are designated according to their compression mechanism. In terms of refrigerant emissions, the compression mechanism is important because it will define the fluid pressure acting on the seals as well as the number of seals used.
27 In the history of MAC systems, various types of compressors were used. Nowadays, there are three different types of compressors in use: rotary vane, scroll, and reciprocating.
2.1.1 Rotary vane compressor
The rotary vane compressor consists of a rotor with vanes mounted eccentrically in a case placed in the middle housing (see Figure 2-2a). As the compressor is operating, the refrigerant inside the chambers formed in between the vanes is compressed as the chamber volume decreases. This compressor type is used on small vehicles and is characterized by smooth operation.
2.1.2 Scroll compressor
The scroll mechanism, also called spiral or orbital, is composed of a fixed and an orbiting scroll (see Figure 2-2b). The orbiting scroll is attached to the driveshaft in an eccentric position and circles around the fixed scroll with an orbital path. The refrigerant at the scroll enters at the periphery and is compressed as it reaches the scroll center. The displacement volume of a scroll compressor varies from 50 cc to 120 cc according to the spiral dimensions.
a) b)
Figure 2-2 a) Rotary vane mechanisms b) Scroll compression mechanisms.
2.1.3 Piston compressor
The reciprocating type is an axial compressor with pistons arranged around a planetary base and parallel to the driveshaft (see Figure 2-3). The displacement volume of a piston compressor is higher than scroll and rotary vane technology and varies from 100 cc to 180 cc.
Depending on the design, the pistons can be driven by a wobble plate or a swash plate. In the wobble plate mechanism (see Figure 2-3a), a wobble plate with a fixed angle is placed on the driveshaft and makes the planetary base wobble, when the shaft rotates, driving the pistons back and forth in their bores. In a swash plate compressor (see Figure 2-3b), the plate rotates itself with the driveshaft. The swash plate is set at an angle to the shaft, so as when it rotates, the pistons are forced back and forth in their bores.
28 One-way reed valves are placed in a valve plate located between the rear and the middle housings to control refrigerant flow into and out of each cylinder. The discharged refrigerant flow is constant and depends on the number of pistons, its stroke and diameter. The cooling capacity can be adjusted only by on/off cycling of the compressor.
a) b)
Figure 2-3 Piston type compression mechanism; a) wobble plate; b) swash plate.
In the 80s, a new piston type compressor was introduced, the variable displacement compressor (see Figure 2-4). It is called variable displacement because it has a variable wobble plate angle that changes the piston stroke length and, therefore, the discharge refrigerant flow. This mechanism controls the compressor capacity and is capable to match the cooling demand without compressor cycling.
The wobble plate angle is adjusted by changing the housing pressure. When the housing pressure increases, the pressure exerted on the back side of the pistons keeps them close to the cylinder head, reducing the stroke and the displacement volume. When the housing pressure is reduced, a return spring pushes the wobble plate linkage away increasing the plate angle as well as the piston displacements.
Figure 2-4 Variable displacement compression mechanism.
The housing pressure is adjusted using a control valve with ports and passages that link the suction, discharge, and housing chambers. There are two different types of control valves: mechanical and solenoid (see Figure 2-5).
The mechanical valve (see Figure 2-5a) has a pressure sensitive diaphragm that controls the housing pressure according to the suction pressure level. When evaporator temperature increases (low cooling capacity), the suction pressure increases too. This pushes on the diaphragm, opening a port that vents a small quantity of refrigerant at the housing pressure to