Publisher’s version / Version de l'éditeur:
Vous avez des questions? Nous pouvons vous aider. Pour communiquer directement avec un auteur, consultez la
première page de la revue dans laquelle son article a été publié afin de trouver ses coordonnées. Si vous n’arrivez pas à les repérer, communiquez avec nous à [email protected].
Questions? Contact the NRC Publications Archive team at
[email protected]. If you wish to email the authors directly, please see the first page of the publication for their contact information.
https://publications-cnrc.canada.ca/fra/droits
L’accès à ce site Web et l’utilisation de son contenu sont assujettis aux conditions présentées dans le site
LISEZ CES CONDITIONS ATTENTIVEMENT AVANT D’UTILISER CE SITE WEB.
Internal Report (National Research Council of Canada. Division of Building
Research), 1967-01-01
READ THESE TERMS AND CONDITIONS CAREFULLY BEFORE USING THIS WEBSITE.
https://nrc-publications.canada.ca/eng/copyright
NRC Publications Archive Record / Notice des Archives des publications du CNRC : https://nrc-publications.canada.ca/eng/view/object/?id=37444b83-6a09-4f7c-8b86-cad7f9955806 https://publications-cnrc.canada.ca/fra/voir/objet/?id=37444b83-6a09-4f7c-8b86-cad7f9955806
Archives des publications du CNRC
For the publisher’s version, please access the DOI link below./ Pour consulter la version de l’éditeur, utilisez le lien DOI ci-dessous.
https://doi.org/10.4224/20337864
Access and use of this website and the material on it are subject to the Terms and Conditions set forth at
Some thoughts on the present state and future of the snow load survey
Plewes, W. G.
NATIONAL RESEARCH COUNCIL CANADA
DIVISION OF BUILDING RESEARCH
SOME THOUGHTS ON THE PRESENT STATE AND FUTURE OF THE SNOW LOAD SUR VEY
by
ANAlYZEO'-W. G. Plewes
Inte rnal Report No. 326 of the
Division of Building Research
OTTAWA
This report is intended to be read in conjunction with the Snow Loads on Roofs 1963-1964, Eighth Progress Report, DBR
Internal Report No. 324. The latter document is one of a series
that report the snow loads observed on roofs during a winter of obse rvations.
This project of the Division of Building Research to study the que stion of snow loading on roofs has yielded much valuable information which has already been instrumental in bringing about improvements in the snow load requirements of the National Building
Code. At the pre sent time the project is being reviewed to determine
in which way further refinements in the snow load requirements of the National Building Code can be st be made and whethe r the type and
scope of observations now being made should be continued in their present form or on an adjusted basis.
The thoughts expre ssed in this report are a contribution by
the author intended to stimulate ideas and discussion. Comments on
the report are invited and may be addressed to the Division of Building Re search, National Re search Council, Ottawa, Attention: W. G. Plewes, Building Structures Section.
Ottawa
January 1967
R. F. Legget Director
SOME THOUGHTS ON THE PRESENT STATE AND FUTURE OF THE SNOW LOAD SURVEY
by W. G. Plewes
One of the principal aims of structural designers is to provide adequate safety for the various parts of a structure taking into account the loads, the function of each part and the consequences
of its failure. Among elements having the same purpose it is usually
desired that the safety should be uniform among them. Similarly, it
is intended that structures in one city should be as safe as those in
other cities across the country. Building codes and standards play
a major role in determining to what degree those objectives are attained.
Total knowledge does not come in a day - if ever - and it is only through continuous effort that there is more known today about
loads and structures than, say 30 years ago. Nevertheless, engineers
and code authorities of former days took the knowledge existing then and, combining it with judgement, achieved generally safe structures. Judgement often indicated, however, that in view of the uncertainties of loads, materials and analysis, structures should be given a
substantial margin of safety to make sure that in the wor st conditions
they would have "adequate" safety. By the same token those
uncertain-ties meant that the actual safety provided was generally not "uniform".
This situation still pertains by and large today; but it is also
becoming realized that, even though a substantial nominal margin of safety is given to structures by conventional analysis, there is always a possibility, however remote, that the uncertainties may, on occasion, combine to produce failure in a structure or structural element.
Although the ultimate solution can only be seen rather dimly in the future, it is generally held now that future progress in handling the problem of loads and strengths will only come about by analysing the unce rtaintie s or variable s indi viduall y as the fir st step in as se s sing the
risks or probabilitie s of failure. NEED FOR SNOW LOAD DATA
In Canada one of the major factors governing the safety of
roofs is the "design snow load". It has long been realized, even by the
casual observer, that the snow load on roofs is not necessarily the
the roof load may vary from roof to roof, year to year and from
one part of the country to another. These were the main reasons
why this study of actual snow loads on roofs was initiated. A
further reason for desiring more factual and accurate information was that it seemed reasonable that better quality control and
knowledge of materials. and the improved methods of analysis and construction now evolving should be accompanied by a correspondingly better estimate of the loads.
Now that the DBR survey has been in progress for eight years there appears to be enough accumulated data to turn to more accurate
methods of analysis. This could be done by plotting conventional
tables and curves, but it is apparent that the results become by far the most meaningful when they are examined by the logic as sociated
with statistical analysis. It is only by such means that the risks or
probabilities can rationally be assessed. OBSERVATIONS ON RESULTS TO DATE
In the Eighth Progre s s Report of the Snow Load Survey
(DBR Internal Report No.
SRTセセIL
certain curves have been displayedwhich by themselves show interesting and informative trends. For
instance the probability plots in Figure s 32 to 36 of that report (Figures 1 to 5 of this report) indicate that the average snow loads on roofs and the factors affecting these loads are essentially random
and for' all practical purpose s nearly "normally" distributed. This is
shown when the points plotted on probability paper fall on a straight
line. The assumption of normal distribution simplifies analysis and
is perhaps accurate enough at this stage.
Examining the curves further, Figure 2 shows that present
average snow loads given in the NBC certainly seem safe. This is
indicated by the graph,as equal measured and NBC loads are
repre sented by 1. 0 on the ordinate and all point s in the survey fall
below this. The probability of getting a ratio .greater than 1. 0 is not
quite clear because extrapolation of the curve is not definite, but the
probability is evidently small. Thus, the pre sent as sumption which
takes 0.8 of the ground load for the NBC roof load seems safe if we wish to generalize for all of Canada .
.
'. ','Pernica, G. and B.G. W. Peter. Snow loads on roofs 1963-64,
Eighth Progress Report. National Research Council, Division of
3
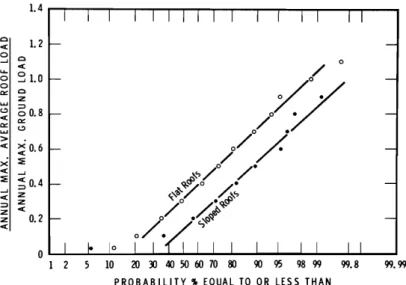
-Figures 3 and 4 demonstrate other interesting facts. Figure 3 shows that all the data for maximum average snow loads
on flat roofs fall on practically a straight line indicating a normal
distribution of roof to ground load ratios among all the test roofs
taken as a group. On the other hand, in Figure 4 the curves for a
few particular roofs are shown and they have a variety of curve
slope s , Difference s in curve slope and position indicate that the
loads for all roofs do not have the same magnitude or variability and if lines were drawn showing the results from all roofs observed,
pr e aurriab ly a whole network of such lines would be obtained. The
line s shown, however, are sufficient to raise seve ral que stions.
Fir stly , what caused the difference s between the roof to ground load
ratios for the three flat roofs in Ottawa? From what is known of the
buildings they are due to variations in such factors as exposure to
wind, orientation, and heat los s , Secondly, is the large difference
between the curves for Goose Bay and Gander versus Ottawa a function of climate and snow conditions or was it simply due to
another combination of the factors previously mentioned? Finally,
it is noteworthy to observe again that when the results of many different roofs, which themselves have normally distributed roof loads, are mas sed together in Figure 3 a normal distribution is again obtained.
Figure 5 shows the measured roof and ground snow loads for
Goose Bay and Gander. The results give reasonably straight lines on
the probability plots and can be projected to any chosen probability. We cannot with confidence take the ratio of roof to ground loads from this curve, however, by selecting values·directly in line vertically
from the selected probability. The reason for this is that we do not
yet know whether the maximum snow load on a roof necessarily occurs
when the ground snow load is maximum. Probably it does not, as it
may depend on the sequence of winds, temperatures, snowfalls,
rain-falls, etc. that led up to the maximum load on the roof. What affects
roof load would not necessarily affect ground load to the same extent or in the same way under all conditions.
Because of the points just discussed, it is evident that any further changes to the snow loads in the NBC should not be made on the basis of simple uniform adjustments applied to all parts of the
country. Experience with traditional, albeit inaccurate, design
loads and stresses formerly has led to a qualitative, normally adequate, and sometimes overconservative, level in the safety of
or oversimplified, we may go beyond the range of our experience
and lose sight of the safety actually being obtained. Also, we
would not be any closer to arriving at uniform safety among
building s in diffe rent parts of the country, or even among buildings in the same place but under slightly different environmental
con-ditions. Clearly, continued improvements in de sign snow loads
must depend on a closer analysis of the loads and the effects of such reductions.
These questions will need continuing thought and discussion, and the purpose of the remainder of this report is to try to obtain further insight into what the ultimate objectives of the snow load
survey should be. This will be done by postulating the sort of analysis
that might be expected in the future and what information would be
needed for such analysis. Working backwards from this, one can
perhaps see how well the present survey fits into the long-term picture. THE DIRECTION OF FUTURE ANALYSIS OF FAILURE
The argument, as evolved here, begins with consideration of
Figure 6. In normal present practice a structure will be designed
for a given snow load, L, which is usually given in a code. This will
in all likelihood, but not necessarily, have been chosen on the con-servative side and if the data determined from an actual study of snow on such roofs are plotted the curve would appear somewhat as shown by curve A.
In Working Stress Design the a l l owab l e stress level, f, is set so that the nominal calculated strength, S, has a value in the
order of twice L. With concrete, for example, the presently allowed
stress is 0.45 f I . It is known, however, that the actual concrete will
c
not have its nominal strength (say, 3000 psi) but the strengths from
batch to batch will vary normally in most cases. Assuming that
material strength is the sale factor affecting strength, the actual strength capacitie s of similar structure s will vary much as shown by
curve B. (Other factors determining strength such as tolerances,
workmanship, analysis, etc. could also be introduced, but will not be dealt with here, although some sort of similar distribution curve would undoubtedly be obtained. )
Continuing the discus sian, failure of any structure will occur
when the strength capacity is less than the applied load. Referring to
Figure 6 it is seen that the degree of overlapping of the tails of the
5
-will cause failure. By a suitable mathematical analysis, the actual
probability of failure can be determined. The parameters needed
are the mean value s, L m and 8 m, for the loads and strengths and their coefficients of variation, VL and V8, representing the spread of the data.
The problem of acceptable risk of failure is probably the
most difficult que stion to be decided regarding safety. Should it
be 1/10, 000, 1/100, 000, 1/1, 000, 000 or greater? This is very
much a subjective matter, but the question must be decided eventu-ally before the process of reasoning can proceed to its conclusion.
It must be a group decision. Suppose for pre sent purpose s that a
Committee decided on a value of 1/100, 000.
If the position of the curves representing the observed loads and the actual strengths is such that the calculated probability of failure is greater or less than 1/100,000 then the curves must be
moved closer or farther apart. The curve of loads represents climate
data and cannot be shifted, but the curve of strengths can. This can
be done by shifting the nominal de sign load, L, or the nominal
calculated strength, S. The latter involves altering the allowable
de sign stre s s or the load factor. Pre sumably it might be decided to
achieve the desired result by adjusting both the nominal load, L, and the allowable stre s s until the de sired overlap is obtained.
COLLECTION OF SNOW LOAD DATA
For the sake of discussion let it be assumed that the
adjustment of Land S results in a position of L such that there is a
1/100 probability of the snow load ever exceeding L, i.e. havinga
value to the right of L. We may now proceed to consider the kind
of data we would like to have from a study of snow loads on the roofs of all similar buildings in an area under consideration.
If in a given city, records were kept of the snow loads on a given flat roof for say 15 years, the results would most likely plot on
a probability paper as essentially a straight line (Figure 7). The
slope of the line would indicate the spread or variability of the data
as expre s sed by the coefficient of variation, V L. If the acceptable
risk of overload is 1/100, we may proceed to the appropriate point on the abscissa of the graph, then vertically to the curve and thence horizontally to the ordinate where the snow load having that risk of occurrence on that roof would be found.
A second roof observed would likely have a different protective environment, a different orientation and a different
heat loss. Consequently the graph representing 15 years of
observations would have a different position and slope, and the load having a 1/100 probability of being exceeded would be different.
If a large number of such different roofs (say, 30) were observed, then supposedly a random sample would be obtained
of all possible protections, orientations and heat losses. These
themselves seem to be random variables. Therefore,if the
data from the random selection of 30 roofs were put together and
analysed, a straight line should again be obtained(Figure 8). (This
in fact was obtained for flat roofs in the survey to dat.e , ] Hence, from this curve the load could be obtained which has a 1/100
probability of being exceeded on any roof in the locality. This
would be a conservative procedure, but examination of the data would likely show that it was grossly unfair to certain roofs having a favourable environment and orientation, etc.
A practical procedure would be to select the de sign load from the curve of the massed data and to correct it to take into account the effects of protection, orientation and environment as
determined by special studies. The object would be to reduce the
loads for individual roofs to the chosen risk (in this discussion 1/100)
with uniform safety in view. This has the advantage that a safe,
conservative procedure would be used at the start which could be continuously refined in an organized way as more and more knowledge of the variables is gained.
For the purposes of this discussion, a load having a 1/100
risk of being exceeded was as au rne d , Ultimately it may turn out to be
something quite different. It is evident though that any committee
having a plot of 30 or more roofs (or the L m and VL) would have all the information needed for selecting the basic 'average snow load for flat roofs in the locality to suit any probability of overload they
wished to entertain. The argument considered flat roofs, but it can
equally be applied to sloped roofs. In this case a factor would have
to be worked out from special studies to correct the load obtained from mas sed data to take into account variations of slope.
In summary, what is needed for a given locality are
observations on a large number of roofs to obtain L m and V L values
7
-out for protection, orientation, heat loss and slope. Armed with
this data a committee would be in a position to deal with the
que stion of actual risk of failure so far as snow loads are concerned. The question now arises whether this same information could be used in connection with the design of roofs at other
locations. In the first place, the actual maximum average snow
load on roofs, L m, in the second location would nearly always be different and it may be that, due to differences of temperature and topography, the- variation, VL, of the data would be different in the
second locality than in the first. Hence, the loads having any given
probability of being exceeded would not be directly related. In the past, it has been the habit for various reasons to
express the snow loads on roofs as a fraction of the 30-year maximum
snow load on the ground at a given location. This fraction was assumed
as a constant for most parts of the country. It appears now that this
procedure will not lead to uniform safety among structures all across
the country. In point of fact, no con stant ratio can do thi s and a
different ratio to the 30-year ground load should apply at each location. One reason for employing the 30 -year ground load is that it is the
only extensive information we have at the present time, and also we have not yet tackled the problem of design snow loads from the point
of view of the safety actually obtained. Of course, until such time
as much more extensive snow-load data are obtained the present
system may be the only practical procedure. It appears that one
should not attempt to refine the snow load design procedures further on the basis of a single arbitrarily-adjusted roof load to ground load ratio applicable to the whole country.
In conclusion, it seems possible to propose some changes in the snow load survey, which on the basis of this discussion would provide the information necessary for the application of a probability
analysis to the question of failure for all parts of Canada. Such a
proposal might be as follows:
1. Divide the country into a number of zones that might be expected to be reasonably climatically homogeneous regarding snowfall,
temperature, topography, etc. (Perhaps 10 or rno r e , )
2. Establish at least one major observation station in each zone. 3. At each station, observe the average maximum snow load on 30 or
more flat roofs and 30 or more sloped roofs. Continue observations
4. Continue special studies of the reduction or magnification factor s to be applied to the average roof loads to take into account
difference s in elevations, slope, projections, degree of protection, orientation, heat loss, etc.
5. Expand studies of very large flat roofs.
6.
Consider how refined (detailed) an approach can be expected to bepracticable for the National Building Code.
This proposed plan is suppositional as yet. Further thought
would have to be given to the number of zones and the number of
buildings to be observed in each. New observation techniques might
have to be developed to speed up the process of data collection. It
may not even be a practical proposal, but it may help to obtain some perspective on the work already done and promote discussion .
.
, , " ,."-セN _.-..-.
--
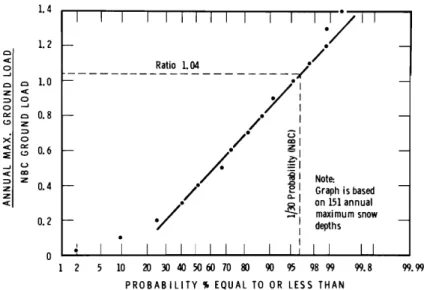
...1.4 1.2 Cl c:( セ Cl Cl 1.0 z c:( :::l セ 0 e:: Cl 0.8 (.? z X :::l0 c:( e:: 0.6 :i: (.? ....J U c:( a:l :::l z 0.4 z z c:( 0.2 0 Note: Graph is based on 151 annual maximum snow depths 10 20 30 40 50 60 70 &l 90 95 98 99 99.8 99.99
PROBABILITY' EQUAL TO OR LESS THAN
Figure 1 Comparison of the maximum ground load
each winter at A and C Stations (1957 -1964) and the NBC (1960) ground snow loads.
1.2 1.0 Cl Cl c:( c:( セ 0.8 0 ....J ... ... 0 0 0 0 e:: 0.6 e:: UJ ;; (.? -0 0-c:( セ 0.4 e:: UJ u > c:( a:l Z 0.2 0 1
/ :
/e
-:
セs・、 on 404 max. average /e roof load measurements
e from"A" & "C" stations 1957-64
e
10 20 30 40 50 60 70 &l 90 95 98 99 99.8 99.99
PROBABILITY' EQUAL TO OR LESS THAN
Figur e 2 Pr obability of maximum aver age
セ 0
0
... < / a セ 1.0/'l
a 0 a::: .... z c.::l セ 0.8 < a::: a::: c.::l ..../ / 0 /
> < セ 0.6x
:!: < ...J#,->/0 / .
:!: セ 0.4 セ0
•
...J |GセO セGM^ < z セ z o Nセ z <0/:
Nセ
z 0.2 < 0 1 10 20 30 40 50 60 70 so セ 95 98 99 99.8 99.99PROBABILITY" EQUAL TO OR LESS THAN
Figure 3 Roof load to ground load ratios for A and C Stations (1957-1964).
10 20 30 40 50 60 70 so セ 95 98 99 99.8 99.99
PROBABILITY" EQUAL TO OR GREATER THAN
0.8 0.7 0 < セ セ 0.6 ... セ a a セ 0.5 a::: .... セ c.::l a < a::: a::: c.::l0.4 .... > x < < x セ 0.3 < :!: < ...J セ < セ 0.2 セ z < z < 0.1 0 1
Figure 4 Annual maximum average roof
to maximum gr ound load ratios for five flat roofs.
20 40 120 130 140 ,...,.-.,....--r----r--r-,--r-,..-r--r--.,...,..---r-r---:/
rl
Iセセ
iセ ..'t セ.. j. セ qセ セ セセ|[NO / : v,("Q'V / / I セセGエHB / . I カLセセ/
1/
• ,. /?.
/
/ :
/ 0 I / 0/ I/.
0'"
セZ / / -;:;-1 • r , / I/
r "
0 :gooウ・b。セ
/ /セ ウ
o _ . _ . - - . : Gander o '---""--...Oセセ
0 1 10 20 30 40 50 60 70 tll 90 95 98 99 99. 8 99.99PROBABILITY'" EQUAL TO OR LESS THAN
c < o tll - l LL. V'l 100 a.
Figure 5 Probability of maximum average
roof and gr ound loads at Gander and Goose Bay based on seven years of A-Station measurements.
:z
"A"
LLJ ::> 0-LLJ e:::: u.Capacities
liB
IIFORCE PER UNIT AREA
セLm
u.
o
o
セ
1
z Load Having a 100 Probability of Being Exceeded
o
o «o
- J 3i:o
z Vl 0.01 . 1.2
.5 12
5 1020 30 40
5060
7080
90
95 98 99PROBABILITY OF SNOW LOAD EQUAL TO OR LESS THAN, %
99.8
FIGURE 7
SNOW LOAD OBSERVATIONS ON A SINGLE FLAT ROOF FOR 15 YEARS (HYPOTHET I CAL)
Z
o
Cl«
o
...J x«
セ_1_
Load Having a 100 Probability of Being Exceeded on Any Flat Roof
Lm
...J«
:::> z z«
z«
I.LJ セ 0.01 .1.2.5 1 2 5 1020
30 40
50 6070 80
90
95 98 99 99.8PROBABILITY OF SNOW LOAD EQUAL TO OR LESS THAN, %
FIGURE 8
MASSED SNOW LOAD OBSERVATIONS FOR 30 FLAT ROOFS OBSERVED FOR 15 YEARS AT STATION "A" (HYPOTHETICAL)