COMPARATIVE URBAN PERFORMANCE SIMULATIONS
by
Robert James Farrell III Bachelors of Design
Boston Architectural College, 2014
MASSACHUSETTS INSTITUTE OF TECHNOLOGY
JUN 2
0
7o17
LIBRARIES
ARCHIVES
Submitted to the Department of Architecture
in Partial Fulfillment of the Requirements for the Degree of
Masters of Science in Architecture Studies at the
Massachusetts Institute of Technology June 2017
C 2017 Robert James Farrell. All rights reserved
The author hereby grants to MIT permission to reproduce and to distribute publicly paper and electronic copies of this thesis
document in whole or in part in any medium now known or hereafter created.
Signature of the Author:
__Signature
redacted
Department of Architecture May 24, 2017
Certified by:
Signature redacted
Christoph Reinhart, Associate Professor of Building Technology
Signature redacted
Miho Mazereeuw, Assistant Professor of Architecture and Urbanism
Accepted by: ---
Signature redacted
COMMITTEE
Thesis Supervisors: Christoph Reinhart
Associate Professor of Building Technology Miho Mazereeuw
Comparative Urban Performance Simulation By
Robert James Farrell III
Submitted to the Department of Architecture on May 24, 2017 in Partial Fulfillment of the Requirements for the Degree of Master of
Science in Architecture Studies
ABSTRACT
This research is concerned with applying environmental urban performance analysis methods to comparative urban master planning. Using bottom-up physics-based urban simulation algorithms, the author established a repeatable methodology for computationally analyzing and comparing urban environments. Conditions simulated included, individual building operational energy use, floor-by-floor spatial daylight autonomy, and site wide occupant mobility. The study area is the Interstate 195 redevelopment site in Providence, Rhode Island. Four historic master planning documents were sampled from 1992 to 2012. The predominate instrument for geometric modeling and simulation was the MIT Urban Modeling Interface(UMI). The methodology proposed in this study provides both, a specific framework of values for performance optimization in Providence as well as a more general framework for the automation of urban simulations in disparate regions. Results from this experiment were processed using custom instrumentation, built using web-based network architecture, to provide rapid result visualization and interactive urban data display. The research concludes by proposing a new architecture of urban system modeling.
Thesis Supervisors: Christoph Reinhart
Tile: Associate Professor of Building Technology
Thesis Supervisors: Miho Mazereeuw
ACKNOWLEDGEMENTS
I would like to thank Professor Christoph Reinhart and Professor Miho
Mazereeuw for their extraordinary support and wisdom during this thesis process.
I would also like to thank my classmates, lab colleagues, and the BT softball team.
It has been a pleasure to learn and grow with you.
I would like to thank Professor Michael Dennis, for his continued contribution to
my education.
To my family and partner Beth Savrann, I could not have done this without you. You are my trim tab -always helping me find center.
TABLE OF CONTENTS
0 A BSTRA CT ... 5
1 INTRO D UCTIO N ... 11
BACKG ROUND ... 13
URBAN SYSTEMS LABORATORY...16
BOTTOM-UP MODELING...19
URBAN MODELING INTERFACE...21
EXPERIMENTAL SETUP...23
METRICS OF URBAN PERFORMANCE ... 24
2 PRO V ID EN C E ... 28
3 STUDY METHODOLOGY...35
DATA COLLECTION...37
EXISTING CONDITIONS...38
GEOMETRY AND USETYPE...41
PLANNING DOCUMENTS...44 M ODEL BUILDING...48 SIM ULATION ... 49 4 R ESU LT S...52 5 REPORTING TOOLS...59 6 CONCLUSION ... 63
INTRODUCTION
design designer tool
process box
decisions
cisions
design support
designer process environment
implicalions
Figure 1: MacCallum, Diagrams of Computer-supported Design Environments (1993)
After the rapid decline of the textile and jewelry industry , the city of
Providence, Rhode Island, commissioned several major planning documents.2 During the period of 1990 to 2012 and following the interstate 195-highway relocation3, considerable planning resources were directed towards the redevelopment of the reclamation land and the Providence Jewelry District. Following the proposal of a local architect, William Warner4, the Rhode Island Department of Transportation demolished an ageing elevated highway and redirected traffic around the core of the city. "The highway engineers who chose the original alignment for 1-195 could not have done a better job in dividing downtown Providence." Said Gene Bunnell author of Transforming Providence: Rebirth of a Post-Industrial City.
'Motte, Weil, Of railroads and regime shifts: Downtown renewal in Providence, Rhode Island. (2000)
2 Ryan, Incomplete and incremental plan implementation in Downtown Providence, Rhode Island. 1960-2000. (2006)
3 Obara, Culture, Community Development, and Sustainability in a Post-Freeway City. (2012) CHAPTER I
A Providence, Rhode Island NAIPM2006
Figure 2: Arial imagery of Providence, RI (2006).
In the years following the highway relocation, many major master plans have been commissioned with similar and competing visions. To understand the many proposed future urban environments of the Providence Jewelry District this thesis analyzes four sampled master plans using contemporary computational valuation methods5.
Each of the proposed planning documents were reviewed in detail and simulated for comparison. The predominate focus of the simulations were on energy use, access to daylight, and connectivity of the site. The term simulation was used here to describe an artificial and active model used to produce and record measurable data on the design and performance of an urban environment.
5 Reinhart, Davila, Urban building energy modeling-A review of a nascentfield. (Building and Environment 2016)
12
S1W 2W0 ADO amo WO
BACKGROUND
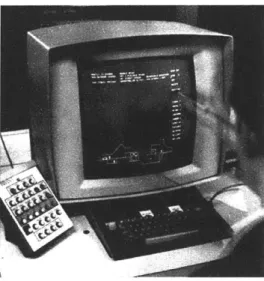
The Massachusetts Institute of Technology School of Architecture and Planning has a long tradition of urban simulation and modeling. The peak of inflated expectations was fueled by the advent of time-sharing computers at academic and research institutions. The advantage computation gave to urban simulations was the same advantage computation gave to many domains, the ability to do precise measurement quickly.
The scale of the city, difficult to model by hand -building by building -could be modeled systematically using a set of rules or procedures. In the 1970s project titled, URBAN 5, a machine that discusses urban design by Negroponte and Groisser6, digital blocks with assigned attributes were used to represent
microworlds, or simplified areas of inquiry that allowed researchers to focus on specific problems while abstracting out other details7.
' See Moore, Emerging methods in environmental design and planning: based on the proceedings of The Design
Methods Group First International Conference. (Cambridge: MIT Press, 1973) 7 Steenson, Microwor/d and Mesoscale. (July-August 2015), 58-60
The ubiquity of urban computer modeling increased rapidly in this period. Initially these advances came from of top-down statistical techniques, used to quantify and assess urban performance. Massachusetts Institute of Technology Professor of Management, and pioneering American computer engineer and systems scientist, Jay W. Forrester, presented research that would be published in
1969 as Urban Dynamics8. Forester built a large-scale, interactive, computational model of a hypothetical urban environment9. Forester used his model of a city like a laboratory for the study of urban social structures, processes, and systems.
Urban Dynamics used system dynamics, common in industrial design, to address population, housing, and industry within an urban area. Forester's work, complex and highly dependent on computation, Using IBM Systems/360 Model 67
hardware installed at MIT in 1968, opened a new branch of system dynamics studies and birthed the program language called DYNAMO.
8 Forester, Urban Dynamics. (Pegasus Communications, 1969)
9 Wood, The Engineers and the Urban System. 1968-1974. (MIT SM Thesis 2012)
Figure 3: Negroponte and Groisser, URBAN 5 (1970)
DYNAMO -DYNAamic MOdeling - was a language formed at MIT that took the general and popular programming language FORTRAN and provided a library for system modeling10 These dynamic system models, because of vast complexities, were highly interdisciplinary, often straddling the traditional academic fields of mathematics, psychology, engineering, and business. With each discipline doing its part in a larger system dynamic, many innovations were to follow. Around this time, urban affairs became a target issue and grant funding followed'". American cities were deemed damaged and close to failure.
Governments nationwide were reassessing the design and role of cities post-suburbanization.
At MIT this lead to a formal decree from President, Howard W. Johnson12, and the appointment of ex-Boston mayor, John F. Collins, to the faculty, and the formation of the Urban Systems Laboratory.
'0 Pugh, DYNAMO: User's Manual. (MIT Press, Cambridge, 1963)
" Ibid., 9
12 "Letter from Howard W. Johnson to Mr. McGeorge Bundy, President of The Ford Foundation, February
24, 1967," 1, Ford Foundation -Urban Studies Proposal, MIT Corporation, Office of the Chairman, Records,
1965-1983, AC-I 18, Box 167, Folder 1, Massachusetts Institute of Technology, Institute Archives and Special Collections, Cambridge, Massachusetts.
URBAN SYSTEMS LABORATORY
The Urban Systems Laboratory (USL) was a group of researchers focused on studying the city using system dynamics and urban simulations. This group was seminal to the MIT School Of Architecture and Planning, as it marked its entry into the grantsmanship and big science endeavors of the time.'3
Correspondence from USL Executive Director and Professor C. L. Miller to MIT President Dr. Jerome Wisner
Subject: Architecture Computer Lab
Date: July 22, 1969
"The three tube ARDS graphic unit, purchased by the USL through two Sloan Grants, will not be moved to the Webster Buildings but will be turned over to the Department of Architecture for use in their departmental computer lab..."
13 Ibid., 11
12 3 4 7 90 l 1 2 3 4 6 7 (1 1 2 J 4 $6 7 8 2 5 b 7 89V12
MittARX X
ATXHT AxGRIT X X XU K xLS 2) M. .XTIT ) '. . ..AV ..
2. ..... 2
17 .
....
... ... ....
2
Fiue :M.Rber Kiby A26uainMdl fteDvlpen rcs na
31
3 . . . . . . .. . . . ...
Urban Core (1970)
As computation progressed so did simulation technologies and the ubiquity of computing within the School of Architecture and Planning 14, record keeping of
shared computer time at MIT shows architectures introduction to the computer as an instrument of design and the Urban Systems Laboratory stands out as its own entity amongst electrical and civil engineering. 1
The Urban Systems Lab sponsored a range of projects; in addition to research in system modeling the USL sponsored research in computer-assisted design. In addition, to challenges of system modeling, there were axillary challenges of representation and user experience. Records from the Urban Systems Lab research agenda shows three main challenges, (1) data gathering and entry, (2) computational efficiency and accuracy, (3) result viewing and understanding.
" T urkle, Niel sen, Orsini, Project Athena at MIT: Computing in the School of Architecture and Planning.
(May 1988)
"s MIT Urban Systems Laboratory Records, 1968-1974, AC-366, Institute Archives and Special
d,&"Fe
food.ith
U. RVAeU - -- - _ _ -4 '- --x i
0
- lwl M U M I
Food F ood o'..
1111tWn LA ' Ia IM Pood poteIeia
-- - -d- -.
--- --- -- - - - - - -
--ro nionoi.(--- - %fm w
7olo
- -~4U -U~~oII - - -M -U,%- -- -- - - - - - t Oil
ImIf. =a~~ mgph -- - POLS
Ceplma 0Wva
C MOI Ie
PCRUvmmi ow CIAPT I
Captal .-- C~lo 0..I3dW .N
NAShen tIw oura *o~ CiAFN of We 0.-caplw -of we
fal 37 Ivl p " a ',
115a ~C~f ami~n
1.5515.,'Sin~a~gNvm~aest15110 M IS~
Figur 5:w" F*.rster Worl Dynamics(1973)
39 tro mum18
stnictilreof the MwAd Sillicinj 21
BOTTOM- UP MODELING
Many of the systems for data entry and display were foundational to
contemporary design applications. For example, the program, DISCOURSE, developed by William Porter, in 1969 was a program for the computer-aided design of cities and included a street network, parcels, and building footprints'6 and COGO or Coordinate Geometries by Betsy Schumacher and Charles Miller, was a system for describing geometry in Euclidean space.'7 Both of these technologies provided clear classification of the primitive data points for urban simulation and modeling. Schumacher declared a number of primitives still common in urban computing today. These primitives included points, curves, courses, chains (or parcels), profiles, networks, blocks and regions.18
16 Porter, The Development of Discourse: A Language for Computer Assisted City Design. (1969 PHD
Dissertation)
'7 Schumacker, URBAN COGO: A Geographic-Based Land Information System (1971)
8
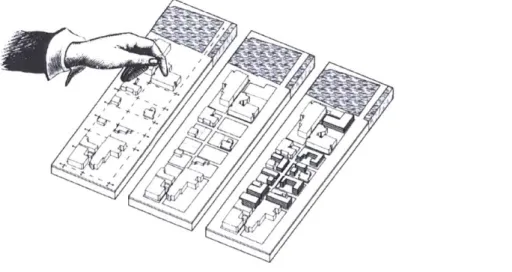
Figure 6: Bottom-up modeling process.
Much of the Urban Systems Laboratory research used an approach to urban modeling that can be classified as bottom-up modeling, where Individual base
19
elements are modeled in detail and connected to create a complex system These bottom-up models held an inherent understanding of geometric space
because of the spatial referencing and shared coordinate systems deployed. Bottom-up urban models differ from the top-down models where holistic systems are subdivided from the top down.
Figure:
19 Mario Bunge, A World of Systems (Dordrecht; Boston, Reidel, 1979)
URBAN MODELING INTERFACE
On May 6th 2013, almost forty years after the USL closed for lack of funding, during a public symposium on Sustainable Urban Design, the MIT Sustainable
Design Lab released UMI, the Urban Modeling Interface, an open platform for architects, urban planners, and real estate developers interested in modeling the environmental performance of new and existing settlements. "The objective of umi is to give users access to meaningful information that facilitates design interventions at the neighborhood, street and building scale."2 0
Much of the Urban Modeling Interface's base functionality was designed to reduce carbon emissions in urban environments; however, as of 2017, UMI was showing the beginnings of a collective ecosystem for developers around the world to introduce new simulation functionality. Evidence of this propagation was found in recent literature, for example outdoor thermal comfort, urban building-Integrated agriculture, and developer financial return.
20 Reinhart et al, UMI -An Urban Simulation Environment for Building Energy Use, Daylighting and
Walkability (Proceedings of BS2013, Chambery, France, 2013)
2 Khadija Benisa, Development of a simulation-based decision support workflow for the implementation
A ropg iift 01/? =&trd (ch*Vg*) e 1o the =Nth
of ApIIV'WSb4& , $48, S61. Aceordingly, we ae A 8mmawy f tho major usve MOw6:
e r s V G- I S .* 3 4 0 %
stem 74 ,745 &I TO 14
A I
AS Ofes *S.S 6".4 #11.484 f4 8.71
9Pwusey aa R.VVW*
Figure 7: Table from a monthly IBM 360 report by C.L. Miller (1969)
Fundamentally, there are two major avenues of development both in 1960 and today; (1) The development of the simulation engines and (2) the development of the graphics and result display and result processing. This remains similar to the research agenda of the Urban Systems Laboratory. It was also evident that in the last half-century, urban design has witnessed the rise of computational urban modeling, at first in the form of top down system models and more recently in the form of bottom-up geometric urban modeling such as the Urban Modeling Interface. By following repeatable steps, each urban structure can be represented and modeled with its surrounding context as a specific coefficient within a simulated environment. Whole neighborhoods or districts can be modeled and simulated to provide building-by-building performance data. Street networks, parks, and shading devices are included in the model and influence building performance.
Figure:
EXPERIMENTAL SETUP
This experiment used lessons learned researching the history of urban modeling and innovative environmental urban performance analysis methods to compare urban masterplans. This was done to test if comparing urban simulation results can help reduce carbon, increase livability, and influence the development of our built environments. There were three major research goals; (1) Compare
masterplans of new settlements; (2) Create the necessary tools for repeatable simulation analysis; (3) Survey areas where urban performance simulation can enter existing modes of practice. This experiment is performed using four historical master plans of Providence, Rhode Island. Each master plan was analyzed using a set of urban performance simulation techniques. The results of each experiment were then combined for project-to-project comparison. Results were then used to analyze the existing urban planning and policymaking process. In addition to exploring a new paradigm of comparative, multi-design evaluation, this model also aimed to assist in future computational urban design - including, but not limited to the coevolution and subsequent convergence of future
METRICS OF URBAN PERFORMANCE
This research simulated three major metrics of urban performance; (1) Building operational energy use; (2) floor-by-floor spatial daylight autonomy; (3) site wide occupant mobility. These metrics were chosen because of their simulation accuracy and their influence on the master planning process. The simulations produced monthly results for a full calendar year using local weather and urban attributes.
Operational Energy
Building operational energy use was defined as energy use intensity, as a representation of energy use per unit area [kWh/m2 this included heating, cooling, lighting, and equipment loads. Demand was calculated by aggregating the monthly simulation results of heating, cooling, lighting, and hot water energy usage for each building. The unit used, Energy Use Intensity (EUI), is an
established metric in mayoral offices around the world, projects like Boston's BERDO22 attempt to quantify and analyze a cities energy demand profiles to reduce carbon costs and increase grid resiliency. The common axiom is that, "you cannot manage what you do not measure."
22 Thomas Menino, May 08 2013, An Ordinance Amending the Air Pollution Control Commission
Ordinance in Relation to Reporting and Disclosing the Energy and Water Efficiency of Buildings.
-'I
/
WI
I!
/
Figure 8: [left] Frame from a solar path animation.
[right] Saratsis, Daylight Density (SMARCH Thesis 2014)
Spatial Daylight Autonomy
Floor-by-floor spatial daylight autonomy is a recently new urban performance metric, as it is a computationally expensive simulation to run. Whereas, Spatial daylight autonomy is measured by calculating the daylight that enters a building through windows and openings. Known as sDA, Spatial daylight autonomy Describes how much of a space receives sufficient daylight. [Unit: sDA300/50% (area that receives at least 300 lux for at least 50% of occupied hours)] sDA is an important urban performance metric because the metric quantifies a human perception of daylight and performance is highly dependent on the shape and form of the building and when the building is occupied.
lop so
OWN'~
Figure 9: Frame from a mobility animation.
Occupant Mobility
The last analyzed performance metric was site wide occupant mobility. Occupant mobility is an indication of site wide connectivity and centrality to amenities. The metric used here was the Walk Score percentage, a percentage of
connectivity each building has with surrounding amenities.
This metric was chosen because of the metrics dependency on the urban street grid, public parks, and open areas traversable by site occupants. This metric considers the form and fabric of the masterplan and distances between points of interest and individual buildings.
Each of these metrics were deemed important to the study area because of deep and extensive research on the forces shaping Providence. Energy, Daylight, and Walkability are all metrics that, if improved, could attract an innovative
workforce, shape Providence, and inspire confidence in redevelopment.
PROVIDENCE
Providence, Rhode Island, is more than an intermediate city that falls between New York and Boston. Many view Providence as the birthplace of American Industrialization. In 2011, U.S. Secretary of the Interior, Ken Salazar,
proclaimed, "The seeds of the Industrial Revolution were planted here in the fields of the Blackstone River Valley." Yet the city's industrial reputation has faded dramatically over the last half century.
There have been many historical forces that have shaped Providence in the settlement's short lifespan. Founded on religious freedom in 1636, Roger Williams stated "A place where you are free to worship or not worship."2 3
Providence slowly attracted colonists, it was bestowed with clean water and safe access to the Atlantic but little suitable farmland. Functioning as a subsistence economy, only having enough food to support itself, Providence was forced to take on more complex manufacturing to crystalize knowledge24 into tradable
goods.
23 Dickie, Margaret, Becoming a city; from fishing village to manufacturing center. (New York: Harcourt,
Brace & World, 1968)
24 Hidalgo, Why Information Grows: The Evolution of Order, from Atoms to Economies (Basic Books,
2015)
28
Down city, Providence committed local efforts on manufacturing. The soft running water was ideal for early water mills and textile washing. The British immigrant Samuel Slater, a machinist and forefather of American
industrialization, brought new technologies for advanced textile production. Moses Brown, a local businessperson and leader in Providence, hired Slater to run a textile mill. Slaters ingenuity and commitment to his craft fueled a manufacturing revolution in the region. Quickly the settlement became the center of a regional manufacturing network and it was reshaping their territory. The East bank and Great Salt Lake was slowly filled in and accommodated much of Providence's commercial and industrial growth as business attracted to
manufacturing expanded. This demand for manufacturing also increased demand for energy sources, initially relying on the waterpower of local rivers and the burning of whale oil candles, Providence quickly adopted electricity and hydrocarbon consumption. In 1827, Samuel Slater opened one of the first American cotton mills to run on steam26
25 Tucker, Samuel Slater and the Origins of the American Textile Industry, 1790-1860 (Cornell University
Press, 1984)
Providence's complex manufacturing economy was an advantage during the war of 1812 when America was forced to turn its trade inwards. Originally,
Providence's built environment was shaped by a network of sea wharfs and their relationship with local manufacturing, in the 1800s Providence began to shape itself to support a network of rail and road. Train tracks and steam trains
branched out from the center of Providence. In 1848 the Union Passenger Train Depot was built and the settlement rapidly turned its direction inwards and sea trade was momentarily less important to Providence. New roads connected Providence to the constellation of early American villages and a larger land network. Immigrants flocked to Providence -as opportunities were abundant
-laying strong cultural roots in the fresh land and forming new neighborhoods. Between 1880 and 1910 population doubled and jumped to 224,000 residents.
Figure 10: [top] Chester Smolski, Providence aerial image. (RIC Special Collections)
As the American civilization rapidly expanded and as technology rapidly increased, Providence, under the forces of competition, watched its hold on manufacturing decline. Cotton mills began to open in the American South, in proximity to raw cotton and farmers willing to take low wages. At first only producing coarse cotton goods, but quickly improving to the quality of
Providence's finer fabrics. At this point Providence's economy was extremely volatile, slumping under the pressures of competition but boosted by the First World War. This trend continued until 1948 -when the depression hit. At this point, it was finally clear that the 1900's marked the end of Providence's growth.
This development is not so surprising. Southern wages, at the time, were so low even New England investors were moving their money South2 7. Banks and investment left Providence and the mills and factories were stuck with outdated equipment and outdated practices. New England lost its importance as the nation and population moved westward; Providence's position between New York and Boston mattered less as materials, goods, and customers were located farther and farther west, it was then that Providence turned 180 degrees back to its
waterways and began to reinvent itself.
-P A W T-U4 X E T
abl" Cm
-0.
"...Providence, Rhode Island, was a gritty wasteland of neglected waterways, derelict railroad yards, and vast parking lots, derided as a smudge on the road from New York to Cape Cod" says Leazes and Motte in Providence; The Renaissance City. During the period of 1960-1980, from the Interface
Providence Plan, prepared by faculty members at the Rhode Island School of Design2 8
to the Capital Center Plan by Skidmore, Owings & Merrill LLP,
Providence begin to redesign interstate highways and rail lines and reconnect it's urban fabric.
As of 2014, Providence had a population of 179,154 residents. Approximately 40,000 residents left the city after peak population in the early twentieth century. William Warner, a Connecticut born, MIT educated, and already established architect and urban planner2 9 was partly responsible for what is called the
"Providence Renaissance".
28 Bunnell, Gene. Transforming Providence: rebirth of a post-industrial city. (Troy, NY 2016) 29 Leazes, Motte. Providence, the Renaissance city. (Boston: Northeastern University Press, 2004)
Warner's first major contribution to the city came in 1983 when Warner began promoting the idea of uncovering - covered by land bridges and transportation infrastructure - the Providence river, a confluence of the Woonasquatucket and Moshassuck rivers, soon after providence begin to reclaim its connection to water. Warner in 1992 proposed the Old Harbor plan a proposal to redirect traffic around the core of the city and continue the waterfront reclamation towards the head of the rivers and the beginning of the Narragansett Bay. The 1992 Old harbor plan and plans following were gathered for this experiment.
z . . MO &
M2 VS
I~.r.' AirX,9
1;
~~44~- raI-N~ "tj6,Figure 12: The four selected planning documents. Old Harbor Plan (1992); the Jewelry District Concept Plan (1999); Providence 2020 (2006); and the Knowledge District Plan (2012).
STUDY METHODOLOGY
The study methodology consisted of the following Inputs. Data regarding master plans issued by Providence from 1992 to 2012 were reviewed. Four documents in this time period included the required information to build a simulation model. The requirement of a simulation model are as follows: (1) The existing
conditions data, vector geographic information or raster satellite imagery, at the time of document publication. (2) The published and public Design Document, including plans, elevation, rendering, prescriptive or performative urban code, and implicit declared design intentions. (3) Local construction practices and materiality data. For the later, local construction practices, this study assumes all new construction is built using the same modern construction practices for all models, regardless of year the design was authored.
36
DATA COLLECTION
The data required to build an urban performance model is disparate and
decentralized and varies from city to city. In the case of the city of Providence, the major repository of urban planning data is owned by the City's department of
Planning and Development. Here the public can access recent archived urban masterplans and GIS, Geographical Information System, data.
Existing conditions data, documents and files regarding the site conditions such as existing street grid, existing building footprints, existing zoning, and existing infrastructure was public - but not easily assessable. The full datasets and files were requested from the sub department of GIS and Mapping, which along with federally owned satellite imagery in this study are classified as Semi-Public Existing Conditions Data. Urban planning data, provided as a Portable Document Format (PDF) file, was either city approved urban code, ie setbacks and zoning, or a planning document authored by a commissioned third party such as an architecture firm. These documents for the purpose of this study are classified as existing urban design documents.
EXISTING CONDITIONS
The existing conditions data, building and infrastructure, was crucial to the construction of an urban performance model as it functioned as the adjacent boundary of the site model. By combining satellite imagery, land zoning, GIS building and parcel footprints, and an additional building information sourced from the Providence jurisdiction's tax assessor online database, a three
dimensional model was constructed to serve as a base case that received the proposed master planning design document data from each of the samples.
Satellite imagery was important for the classification of building typology in addition to zoning and assessor data. Satellite imagery spanning the same study period of 1992 to 2012 was gathered through a federal repository of public raster images geolocated and projected to the geographical location on earth. These images are included in the appendix and show the stages to the 195 highway relocation.
-wit,... -tA. ... I' 1 - ~ 0 4. . AV 9&.in.IS ir * AIM' SO . WI* o~ ~r r t; *1. IL 0 A -el i Ve 1A'l i#0'.u 'Putf N 6wis CdwhWWjkd Y*~ V HwVYwMhffudO~id -~~~~~*4 -1 ~ . ~j * NdaoAd mDi a ~ 4 . ., *Op mDto -
*
-'~-~ ' - U h~.h~d~g.miI0Figure 13: GIS Existing Building Footprint Map, False Colored by Use Type. Data provided by Providence Planning and Development office.
GIS data provided by the city, included multiple years of vector building footprints, parcel outlines, and street networks. Each vector building footprint object included a unique Identifier that was retained to assist in the merging of external data. The parcel outlines included an attribute describing the zoning of each parcel. This attribute was propagated and assigned to the building footprint by using a geographic join function to associated each building footprint with it's associated parcel. The parcel data also served as land boundaries within the model, this land boundary defined elements such as sidewalks, parks, parking lots, and the water edge.
The street network provided by the city was discarded because of overlapping, inconsistent polyline data - meaning the street data provided was of low value and redrawing the street network manually was faster than cleaning the street data. Therefore, it was deemed best to rebuild the street network data needed for this site and this site only.
GEOMETRY AND USETYPE
The key to both existing conditions models and new design urban performance models are the general geometry of a building and that building's declared use type. Each of these attributes opens many other avenues of data gathering and analysis. In the case of the existing conditions model use type is less valuable because in this study existing buildings only influenced the simulation by shading adjacent new construction. Potential future urban performance models could consider the use of adjacent building to provide design insight; however, for this study existing buildings functioned only as shading devices to
The geometry LOD, or level of detail was classified as a 2.5D extrusion, the geometry was an extrusion of the footprint to the assessed building height and did not include architectural elements such as pitched roofs, dormers, sectional changes in shape, ect. Once a base case existing model was built it was then modified and adjusted according to the intentions decoded from the design data. This process required two major inputs, one input for the intentions of an
intervention and two the site specific data regarding the construction of new buildings. The process of extracting intentions from planning documents to design data was highly dependent on expert interpretation. To ensure consistency across samples, selected documents were reviewed in detail following an
established methodology to model precisely what each planning document proposed. The planning documents, provided as a Portable Document Format (PDF) files, followed a general structure: A message from the mayor, and executive summary, a set of guiding principles, existing conditions analysis, concepts, and plans. Each document had commonalities of graphical urban data communication elements; these elements included plans, renderings, elevation, sections, and diagrams. Each design document had differing scale and scope yet all documents addressed the 195 Redevelopment Site and Providence Jewelry District.
Only planning document data within the defined boundary of this experiment was extracted, additional master planning efforts outside of the experiment boundary were disregarded. This was necessary to provide a direct plan-to-plan comparison; however, future experiments could include a larger experiment boundary to recreate a more holistic and accurate interpretation of the planning documents.
In addition to the planning document, design data required local and specific methods of construction not defined in the planning documents but assumed by extracting information on contemporary and vernacular building construction in Providence, Rhode Island. Because each planning document did not explicitly declare construction methods, the experiment assumed the same construction methodologies for each plan. Because of the increase in building information modeling, future planning documents could, one day, include granular building data specific to construction methods and materiality. In this experiment,
generalizations were made, for example in all four samples commercial buildings had identical construction and material profiles.
Figure 14: Aerial Imagery of the study area. (Apple Maps 2016) Figure 15-18: Programmatic Distribution Axonometric Studies.
1992 Old Harbor Plan population: 7.911
/4
Programmatic Distribution 224,153 sqrn Floor Area
Commercial Residenial Industrial 0Aft Parking
PLANNING DOCUMENTS
The four selected planning documents were the following: the Old Harbor Plan (1992); the Jewelry District Concept Plan (1999); Providence 2020 (2006); and the Knowledge District Plan (2012). A short summary of each plan was prepared below.
Old Harbor Plan (1992)
Sponsored by the Providence Foundation, the Old Harbor Plan, proposed the removal of the aging 195 highway infrastructure and proposed the redirection of traffic around the core of the city. Designed by local architect, William Warner, the Old Harbor Plan proposed a new street grid connecting downtown
providence with the industrial Jewelry District. The street grid was infilled with residential and commercial program of similar density to the surrounding existing fabric. The plan also called for a waterfront park and small gardens throughout the intervention. Although the plan was never implemented, the proposal served as the beginning of a longer incremental planning process of the reclaimed land.30
30 For more information about the 1992 and 1999 plans see Ryan Ibid., 2
1999 Jewelery District Plan population: 6,975
**wl
Programmatic Distribution 240,136 sqrn Floor Area
Conimmercial Residential Hotel Parking
Civic
Jewelry District Concept Plan (1999)
In 1997 the Jewelry District Association was formed31 and in 1999 the association hired Thompson Design Group to author the Jewelry District Concept plan. The plan was modest and retained much of the existing street network, knitting downtown and the Jewelry District with a contextually scaled mixed-use neighborhood32.The plan focused on infilling existing parcels and introduced programing for a large waterfront hotel and a cultural museum. Both the 1992 and 1999 plans were referenced in a later 2008 Jewelry District/Old Harbor Planning Framework study a document sponsored by both the
Providence Foundation and the Jewelry District Association.
" Bunnell, Transforming Providence (2016,Troy, New York)
2006 Providence 2020 Plan population: 30,147
Programmatic Distribution 844, 556 sqm Floor Area
Commercial Residential Lhaoratory GWM Parking
Civic o
Providence 2020 (2006)
In 2006 the design firm Sasaki and Associates authored a comprehensive plan of Providence, titled Providence 2020. In this document a grand vision of the future of Providence is proposed. The document leads with the following vision of Providence; "In the future, Providence will be a waterfront city, where the water, continuous parks, and transit link the Valley to the Bay. Along this spine,
downtown will be a premier environment for a great variety of economic activities, with innovative industries, commerce, higher education and medical services, research, retail, culture, and housing for a diverse population." The plan called for high density infill and focused its resources on the 195 redevelopment
site, the jewelry district and a string of program outside the city core. The plan also came with a series of massing studies and proposed new building height restrictions, some as high as 300 feet, across the skyline of Providence.
2012 Knowledge District Plan population: 24,305
Programmatic Distribution 624,789 sqm Floor Area Commercial Residential Laboratory vw-w Parking =
Knowledge District Plan (2012)
The most recent plan examined was the 2012 Knowledge District Plan authored by design firm Perkins + Will. In the Knowledge District Plan, mixed-use
program was distributed along a linear path of Laboratory space. The Knowledge District Plan attempted to connect academic and private partnership to urban space for collaboration and commerce, as the Providence Planning and Development office describes it "The plan strives to establish an inspirational vision that will spur investment and facilitate new growth and prosperity in Providence."
A: Perimeter and core areas B Solar analysis C Clusering
hlh MmuOW bw 8 diL*W budweb
D Exract sanples E: Area-wegh of one sanple F Ray castfng
MODEL BUILDING
The sampled planning documents above were then interpreted and modeled within the previously mentioned existing conditions model. Building, streets, and parks planned in each sample that were located outside of the study area were disregarded. In this process there were there major inputs required for the modeling process: (1) The proposed street network; (2) The proposed building footprints; (3) the proposed building heights. After the proposed geometry was modeled using all available resources, data was associated to each building by its defined use type. In the case where a use type was not defined for a building an assumption of use type was made based on the following criteria, similar shaped geometry, renderings of the unclassified building, and the master plans' vision and goals. Few building were unclassified across the four sampled masterplans. Public parks are included as a method of travel and connect adjacent pathways. Areas that are not considered pathways of mobility are private parcels, building footprints, and unplanned interstitial places not explicitly denoted for travel or parkland.
Figure 19: [top] Dogan, Reinhart, Shoeboxer: An algorithm for abstracted rapid
multi-zone urban building energy model generation and simulation. (2017)
48
SIMULATION
The simulation process required climate data in addition to the previously mentioned, building geometry, construction standards and usage schedules associated to the proposed master plan sampled. Climate data sets for building performance simulation have been available for a number of years following the initial establishment of a viable data format, the typical meteorological year (TMY) 3 3 34, and the subsequent provision of data for the Energy Plus thermal
modeling engine in the form of an Energy Plus Weather (EPW) file. 35 An EPW
file from T.F. Green Airport outside of Providence was used to generate the necessary weather inputs for the simulation. Table 1, Lists the algorithms used for each performance metric studied. After simulation was complete, results were extracted for four different aspects of analysis: (1) General Observation; (2) Operational Energy Use; (3) Spatial Daylight Autonomy; (4) and Occupant Mobility. The results are listed in Table 2 and findings from each aspect of analysis are listed below.
Figure 20: [top] Floor-by-floor Spatial Daylight Autonomy Wireframe.
33 Hall, Prairie, Anderson, Boes. Generation de typical meteorological years for 26 SOLMET stations.
3 Crawley, Hand, Lawry, Improving the weather information available to simulation programs (Building
Simulation1999)
Spatial Daylight Autonomy
Received Davlilht sDA 300lux
0% 50%!0 100/
Function Algorithm Publication
Table 1: Algorithms used in the simulation methodology.
Energy Shoeboxer/ Dogan, T., & Reinhart, C. (2017). Shoeboxer: An
ArchSIM algorithm for abstracted rapid multi-zone urban building
energy model generation and simulation. Energy and Buildings.
Radiance/ Daysim "Street Smart" Walk Score
Dogan, T., Reinhart, C., & Michalatos, P. (2012). Urban daylight simulation calculating the daylit area of urban designs.
Rakha, T., & Reinhart, C. (2012). Generative urban modeling: a design work flow for walkability-optimized cities.
50
Daylight
I (6660) WldP?4K CIIDMo (90Kz) owz samoms.~ (zioz) uvid puslqs a~paimoum (Z661) uWI VofPWH nlo
A
g1 "I
IL
(p1p
AL
OT1
eqCHAPTER4
General Observations
Before parsing the results of the simulation, there were a series of observations that could be made in comparison of the geometric mass and programmatic distribution of the four samples. Over the period of 1992 to 2012 the masterplans of this area increased in density and building count. The Providence 2020 plan, proposed in 2006, introduced of over 800,000 square meters of new floor area, this was nearly four times the floor area proposed in the 1992 Old Harbor Plan. This increase of density however did not lead to an increase in energy use
intensity - energy use intensity is normalized for area. A general observation was also made about programmatic use type and the distribution of use types across the site. The 2012 Knowledge District plan included a strip of designated
laboratory space across the site. The 1992 Old Harbor plan was modest in size and building height compared to later samples and was modeled with only one parking structure. This observation was interesting in comparison to the 1999 Jewelry District Plan which declared nine parking structures across the site.
Observations of programmatic distribution suggested that operational energy -as overall site wide energy use intensity -would be difficult to quantify or predict without programmatic use type specific modeling and simulation.
52 RESULTS
Monthly Operational Energy Use Per Masterplan (MW) 12.5k 10k 7.5k - 992OldHarbor 1999JewleryDistrict 2006Providence2020 - 2012KnowledgeDistrict 5k 2.5k 0 1 2 3 4 5 6 7 8 9 10 11 12 Month Operational Energy
The four samples had a combined average energy use intensity of 116
kWh/m2/y. This was within the expected range of energy use intensity in this region and this climate zone. All samples -except the 1999 Jewelry District plan
-had a range of energy use intensity, EUI, from 50 kWh/m2/y to approximately 200 kWh/m2/y. The 1999 Jewelry District plan lacked this upper bound of energy intensity as it also lacked industrial programmatic use. This observation
-of identical energy use intensity minimums and maximums - was caused by energy demand of two different building types (1) the low energy intensive parking structure and (2) the high energy intensive industrial structure. This
observation, in addition to general observations of differing programmatic allocation and distribution, proves that direct project-to-project comparison of site wide energy use intensity lacks direct comparison, as energy use intensity was highly dependent on the unique recipe of program distributed across the site. A direct comparison was found by filtering programmatic use types and by isolating energy use intensity by programmatic use type, for example the 2012 Knowledge District residential building stock had the lowest average energy use intensity at 101 kWh/m2/y.
60% 60% M 1992OldHarbor M 1992OldHarbor 5 1999JewleryDistrict U 1999JewleryDistrict 2006Providence2020 2006Providcncc2020 ' 2012KnowlcdgcDistrict M 2012KnowledgcDistrict Caa 40% -40%-~30%30 o 0 20% 20% -10% 10%-0%- 0% 0 iM 2M 3M 4M 5M 6M 0 50 100 150 200
Total Energy Use (kWh) Normalized Energy Use (kwh/m2)
This is an interesting observation considering all construction of residential building across the four samples are identical and that all window to wall ratios are controlled for. The 1999 Jewelry District plan had an average energy use intensity of 7 kWh/m2/y higher than that of the 2012 Knowledge District. This proved that building footprint, building height, and building site location influenced energy use intensity in addition to overall energy consumption.
An additional observation was the 2006 Providence 2020 plan, the densest plan of the four, had the highest annual energy demand, 98776 MW, and a midrange site wide energy use intensity, 18 kWh/m2/y lower than that of the 2012
Knowledge District. This observation illuminates the benefit of gaging both the total energy demand and a normalized metric of energy intensity, as again the programmatic distribution is the main driver of variances within comparative operational energy use.
Figure 22: [previous] Operation Energy Use Over Time.
Figure 23: [top] Operational Energy and Energy Use Intensity Frequency Distributions.
54
Spatial Daylight Autonomy
The four samples had a combined average spatial daylight autonomy of 42% sDA 300Iux. The sensitive inputs for this metric were the combined average window-to-wall ratio, controlled for at 40%, the density of adjacent buildings, and building form. Considering all windows opening equal, it was interesting that the 1992 Old Harbor Plan outperformed the spatial daylight autonomy of all samples with an average residential spatial daylight autonomy of 52% sDA 300lux, an order of magnitude higher than the site wide spatial daylight autonomy. Prompting the question, what was special about the design of residential building stock in the 1992 Old Harbor Plan? On closer visual inspection of the form and shape of all building across all samples it was clear that the 1992 Old Harbor plan had highly resolved building footprints, this
meant that building footprints articulated geometric conditions to increase the performance of both individual buildings and the neighborhood as a whole.
Figure 24: [left] Providence 2020 [right] 2012 Knowledge District sDA studies.
Further evidence of the importance of highly resolved building footprints can be found in low performing buildings such as the buildings shown in figure 24.
Wide and deep floor plates struggled to receive daylight across the bulk of the floor area. This finding suggested that spatial daylight autonomy, in addition to functioning as a metric of received daylight, could also function as a metric of
resolution. This also means that spatial daylight autonomy could function as an indication of a masterplan's magnitude of building location and shape
prescription, as highly resolved plans may be viewed as highly prescriptive plans.
Frequency Distribution of Occupant Mobility I I I 10 20 30 id lI 40 50 Site Motility I I 1 1 60 70 so 90 Occupant Mobility
The four samples had a combined average occupant mobility of 61 % Walk Score and showed correlation to site density. A frequency distribution of occupant mobility of all four samples was off-center to the right and the curve showed a long tail and a large range of underperforming mobility in buildings across all samples. This suggested that occupant mobility had many occurrences far from the head of distribution and by isolating occurrences - few additional pathways -could push the occurrences past a tipping point therefore improving performance. To test this observation four additional pathways were added to the 2012 Knowledge District plan at a location of low performance. The additional pathways bisected the original street network and increased site wide occupant mobility by a considerable 8% Walk Score. This finding suggested that
unplanned interstitial places not explicitly denoted for travel or parkland could be used to optimize the results of an occupant mobility simulation.
Figure 25: [top] Frequency Distribution of Occupant Mobility.
0S -0 0% 0 201 2KnowledgeDistrict N 2006Providcnc2020 - 1999JewleryDistrict N 199201d [arbor 0
Table 2: Simulation Results for the four selected samples.
58
Sample FAR New Total Floor Mean Building Residential Site Total Buildings Area Area Occupants Population
count Floor m2 Floor m2 people people
1992 Old Harbor 0.85 47 224153 4769 2584 7911
1999 Jewelry District 0.95 46 240136 5220 1986 6975
2006 Providence 2020 1.92 77 844556 10968 9211 30147
2012 Knowledge District 1.36 61 624798 10243 1732 24305
Use Site Residential Commercial Industrial Site Total Types EUI EUI EUI EUI Demand
Total kWh/y/m2
Total kWh/y/m2 Total kWh/y/m 2 Total kWh/y/m2 Yearly MW
1992 Old Harbor 4 123 104 138 207 27594
1999 Jewelry District 7 104 108 135 0 24905
2006 Providence 2020 5 117 102 133 205 98776
2012 Knowledge District 4 135 101 206 84475
Site Residential Commercial Industrial SDA SDA SDA SDA
%sDA 300lux %sDA 300lux %sDA 300lux %sDA 300lux
1992 Old Harbor 49 52 44 45
1999 Jewelry District 37 44 36 0 2006 Providence 2020 40 44 34 23
2012 Knowledge District 40 50 46 24
Site Residential Commercial Industrial
WA WA WA WA
% Walk Score % Walk Score % Walk Score % Walk Score
1992 Old Harbor 49 62 53 10
1999 Jewelry District 37 73 36 0 2006 Providence 2020 40 68 53 27
REPORTING TOOLS
Two proof-of-concept data-viewers were used in this study: (1) the UMI
Dashboard a client-side single-project dashboard used for quick simulation result analysis. The dashboard allowed the ability to drill-down to calibrate and
communicate results. The dashboard provided a scorecard view with high-level site wide averages and an orthographic plan false colored by selected
performance metric or programmatic distribution. The "Data View" feature provided stacked bar charts and scatterplots for drilling down and investigating the high-level site wide averages.
(2) CUPS: Comparative Urban Performance Simulations web viewer was a server-side multi-project data store that used a micro services architecture and allowed drag-and-drop file upload of n amount of simulation files. This tool served as a comparison engine and included combined frequency distribution charts, combined bar charts, and a module for 3D geometry display integrated from a third party.
Both dashboards were enabled by the Urban Modeling Interface's unique data model, which packaged all results and dependencies into one singular result file. Each of the sampled master plans were stored and parsed using this innovative method. Previous experiments would have required bespoke and complicated result analysis workflows. The Providence experiment could be reproduced or shared easily because of portability and standardization of the file's initial dependencies and outputs. Data regarding model geometry, dependent files, and simulation results were parsed using JavaScript Object Notation - see figure xx.
The dashboard also provided a collection of automatic visualizations
-interactive and ready for external presentation. This reduced the time of production of charts and figures while maintaining a continuous graphical
standard, and also illuminated unexpected observation by providing a large range of initial visualizations. The tool shown in figures XX and XX were fundamental to the comparative analysis performed on each sample and the experiment as a whole. It was clear during the experiments that the public, specifically urban simulation stakeholders, would benefit from these tools.
Figure 27: Elevation of the UMI Dashboard displayed on a touchscreen.
CONCLUSION
In conclusion, historical masterplans were compared using computational analysis methods. The findings were as follows: There exists a series of
worthwhile observations that could be made when comparing the geometric mass and programmatic distribution of proposed masterplans. Both the total energy demand and a normalized metric of energy intensity are required to reasonably understand site wide operation energy use.
The energy profile of a masterplan is highly dependent on the programmatic distribution. Comparison of operational energy use is best when isolated by programmatic use. When site wide window-to-wall ratio is controlled for and a spatial daylight autonomy simulation is executed, the outputs are indications of received internal daylight and additional measures -such as an indication of building footprint resolution and a magnitude of building location and shape prescription by the master plan.
Wide and deep floor plates performed poorly when simulated for spatial daylight autonomy. Occupant mobility simulations can be used as an indication of site wide connectivity and centrality to amenities with potential areas of
optimization, depending on street network topology. Expertise in each masterplan was tested by all metrics and weak points or hot spots were only identifiable when a masterplan sample was compared to a field of samples.
A repeatable method for physics-based bottom up modeling was achieved and supplemented by two analysis tools. The major difference of the two tools was that one was a single sample analysis tool and one was a multi-sample analysis tool. Different data visualization strategies were required for each.
Figure 27: [top] Providence 2020 with infill.
Many potential applications for this methodology emerged during this
experiment. There were applications that fit into existing modes of practice and applications that suggested new modes of practice.
Entry to existing modes of practice included: (1) site analysis and site selection due diligence (2) multi-asset portfolio simulation and property management analysis. (3) Centralized management of proposed masterplans for comparative design competition or commissioning. (4) Masterplan document quality
assurance and control during the design phase.
The application of centralized management of proposed masterplans for comparative design competition or commissioning could function as a design proposal requirement and by deploying, a similar repeatable methodology as described above would provide deep and fair quantitative analysis to the already qualitative masterplan competition phase.
A
In closing, the data required to build urban performance simulations is abundant. Previous work in this field has advanced the technology to maturity, it is now time that these methods enter existing modes of practice. Cities need to quantify their planning efforts beyond the traditional metrics. To reduce carbon, increase livability, and make the most of planning resources, urban stakeholder across the globe need to rethink the way masterplans are procured, delivered, and designed to live on.
Figure 28: [top] Author and sister on site in 1996.


![Figure 8: [left] Frame from a solar path animation.](https://thumb-eu.123doks.com/thumbv2/123doknet/14405934.510793/25.917.238.651.89.353/figure-left-frame-solar-path-animation.webp)