HAL Id: inserm-01155177
https://www.hal.inserm.fr/inserm-01155177
Submitted on 26 May 2015
HAL is a multi-disciplinary open access
archive for the deposit and dissemination of
sci-entific research documents, whether they are
pub-lished or not. The documents may come from
teaching and research institutions in France or
abroad, or from public or private research centers.
L’archive ouverte pluridisciplinaire HAL, est
destinée au dépôt et à la diffusion de documents
scientifiques de niveau recherche, publiés ou non,
émanant des établissements d’enseignement et de
recherche français ou étrangers, des laboratoires
publics ou privés.
Utility of Elastography and Contrast-enhanced
Ultrasound For The Differentiation of Tumor
Modifications Between Antiangiogenic and Cytotoxic
Therapy
Alexandre Dizeux, Thomas Payen, Guillaume Barrois, Capucine Baldini,
Michele Lamuraglia, Delphine Le Guillou Buffello, Eva Comperat, Jean-Luc
Gennisson, Mickael Tanter, S. Lori Bridal
To cite this version:
Alexandre Dizeux, Thomas Payen, Guillaume Barrois, Capucine Baldini, Michele Lamuraglia, et al..
Utility of Elastography and Contrast-enhanced Ultrasound For The Differentiation of Tumor
Modifi-cations Between Antiangiogenic and Cytotoxic Therapy. Journées RITS 2015, May 2015, Dourdan,
France. �inserm-01155177�
Actes des Journées Recherche en Imagerie et Technologies pour la Santé - RITS 2015 66
Abstract – Robust, novel information on tumor microenvironment would improve therapeutic follow-up in oncology. Shear wave elastography (SWE) evaluates Young’s modulus (stiffness) based on shear wave velocity. Dynamic contrast-enhanced ultrasound (CEUS) traces microvascular flow with intravascular microbubbles. In this study, an ectopic tumor model was modified using two different types of drugs a cytotoxic (cyclophosphamide) and an anti-angiogenic (sunitinib). Both CEUS and SWE imaging were sensitive to functional, physiological and mechanical modifications of the tumor and provided complementarity information to describe these modifications.
Keywords – Therapy monitoring, Contrast-Enhanced Ultrasound, Shear Wave Elastography, Tumor microenvironment.
I. INTRODUCTION
Solid tumors are comprised of cancer cells and stromal cells embedded in an altered extra-cellular matrix (ECM) and fed by a vascular network. Hypoxic regions of tumors and the tumor microenvironment (TME) can provoke the expression of HIF!-factor which initiates synthesis of growth factors such as VEGF, PDGF, FGF implicated in neovascularization [1]. In
vivo follow-up of TME modifications will increase
understanding of mechanisms underlying tumor development. For example, the functional properties of the new microvascular network can be quantified by contrast-enhanced ultrasound CEUS (contrast agent remains in vascular compartment) [2] and the formation of necrosis and fibrosis in the tumor can be assessed by SWE [3]. Our goal was to evaluate sensitivity and complementarity for dynamic contrast-enhanced ultrasound (CEUS) and shear wave elastography (SWE) to modifications of the TME during cytotoxic and antiangiogenic therapies in ectopic, murine Lewis Lung Carcinoma (LLC) tumors. The cytotoxic drug (cyclophosphamide) prevents cancer-cell duplication. The antiangiogenic drug (sunitinib) effects the TME by inhibiting several receptors involved in tumor vascularization. Modifications detected by imaging were compared to modifications in the TME (fibrosis and necrosis).
II. MATERIALS & METHODS II.1. Pre-clinical tumor model & therapies
Lewis Lung Carcinoma (LLC) fragments (20-40 mm3) were implanted in the right flank of 7-week-old female mice. Three groups were defined, a group of 24 mice were treated with sunitinib (antiangiogenic). Another of 26 mice were treated with cyclophosphamide (cytotoxic) and a placebo group with 26 mice was treated only with drug vehicle. Six days after implantation of fragments, sunitinib was administrated orally at a concentration of 40mg/kg/day and cyclophosphamide was administrated by intraperitoneal injection at a concentration of 150mg/kg for 3 days.
II.2. Shear Wave Elastogdraphy (SWE)
SWE measurements were carried out with a clinical ultrasound system (Aixplorer, SuperSonic Imagine) using an SL15-4 probe with a bandwidth of 4-15MHz and a central frequency around 8 MHz. For each tumor, SWE data were acquired from 3 independent planes along both the longitudinal and transverse directions (6 SWE measurements per tumor). Data were acquired using penetration mode with a color scale ranging from 0 to 50 kPa.
II.3. CEUS & data processing
Contrast imaging was performed with another clinical ultrasound system (Sequoia 512; Siemens) with a broadband 7-14 MHz transducer in cadence contrast pulse sequencing mode. A commercially available contrast agent, SonoVueTM, was used. Regions with no contrast-enhancement were then excluded and the echo-power from the perfused region was measured [4]. A lognormal bolus model was fit to the resulting echo-power curve.
Figure 1: Functional parameters extracted from perfused area. Several perfusion parameters were estimated (Fig. 1): peak-enhancement (PE), mean transit time (MTT), wash-in and washout rates (WIR, WOR). CEUS was followed for 13 days from the initiation of cytotoxic (N=16), anti-angiogenic (N=16), and placebo (N =18) therapy.
II.4. Immunohistochemistry
Blind evaluation of histological slides was made by a pathologist with 12 years of experience. Tumors that were not used for other analysis were prepared for histology at the end of follow-up study (Day 13). Thus, percentage of necrosis and fibrosis were assessed with HES and Red Sirius staining respectively for: 8 tumors in the cytotoxic group, 14 in the anti-angiogenic group and 19 in the placebo group.
III. RESULTS
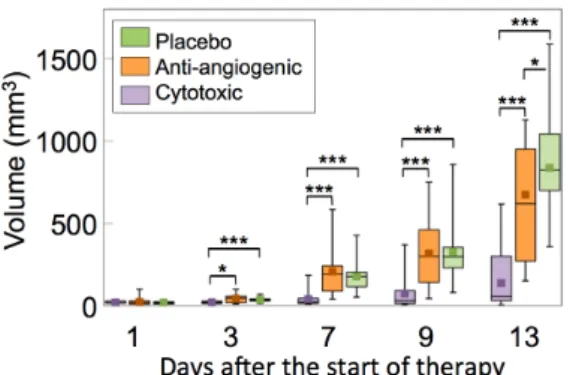
Tumor volumes are summarized in Figure 2. From Day 3 after the beginning of therapy, tumor volume of the cytotoxic group (20 ± 10mm3) was significantly lower compared to both the anti-angiogenic (42 ± 24mm3, p=0.02) and the placebo (37 ± 16 mm3, p=0.003) groups. This difference was maintained throughout the follow-up to Day 13. The tumor volume of the placebo group was only significantly higher than for the anti-angiogenic group (p=0.046) on Day 13.
Utility of Elastography and Contrast-enhanced Ultrasound For The Differentiation of
Tumor Modifications Between Antiangiogenic and Cytotoxic Therapy
Alexandre Dizeux
1, Thomas Payen
1, Guillaume Barrois
1, Capucine Baldini
1,
Michele Lamuraglia
1,2Delphine Le Guillou Buffello
1, Eva Comperat
2, Jean-Luc Gennisson
4, Mickael Tanter
4, S. Lori Bridal
11
Laboratoire d’Imagerie Biomédicale UPMC, CNRS UMR7371, INSERM U1146, Paris, France
2
Service d’Oncologie, Departement de Medecine Interne, APHP Louis-Mourier, Colombes, France
3
Central Department of Pathological Anatomy and Cytology, GH Pitié-Salpêtrière, AP-HP, Paris, France
4
Institut Langevin ESPCI ParisTech, CNRS UMR7587, INSERM U979, Paris, France
67 Actes des Journées Recherche en Imagerie et Technologies pour la Santé - RITS 2015
Figure 2: Tumor volume estimated for an ellipsoid with axes lengths equal to measurements made along the longitudinal, transversal and thickness of the tumor.
SWE measurements are shown in Figure 3. From Day 7 after the beginning of therapy, tumor stiffness for the anti-angiogenic group (14.1 ± 3.6 kPa) was significantly higher than for the cytotoxic group (9.8 ± 2.8 kPa, p<0.005) and the placebo group (12.0 ± 2.4 kPa, p=0.002). Differences remained significant from Days 7 to 13 (anti-angiogenic vs. cytotoxic, p=0.003; vs. placebo, p=0.002).
Figure 3 shows the percentage of the unperfused area in the tumor determined with CEUS. This percentage is significantly higher for the anti-angiogenic group at Day 13 (29 ± 21 %) compared to the cytotoxic (7.3 ± 15 %, p=0.004) and placebo (7.5 ± 13 %, p=0.002) groups.
The percentage of necrosis and fibrosis as assessed by histology on Day 13 are presented in Figure 3. The level of necrosis and fibrosis, respectively, in the anti-angiogenic group (n=14, HES = 20.5 ± 11.3 %; Sirius red = 14.5 ± 9.9 %) is significantly higher than in the cytotoxic (n=8, HES = 7.8 ± 5.3 %, p=0.01; Sirius red = 5.6 ± 5.0 %, p=0.04) and the placebo (n=19, HES = 7.6 ± 5.5 %, p=0.0004; Sirius red = 6.4 ± 6.9 %, p = 0.01) groups.
Figure 3: In vivo (SWE, CEUS) and ex vivo (necrosis and fibrosis) quantification of biomarkers. Cytotoxic group in purple, antiangiogenic group in orange and placebo group in green. Wilcoxon test
IV. DISCUSSION & CONCLUSION
Longitudinal follow-up of tumor modifications was performed in vivo using CEUS, SWE and ex vivo with immunohistochemistry. One of the main objectives was to understand how the two imaging modalities reflect changes in the tumor produced by a cytotoxic drug (cyclophosphamide) vs. changes in the TME produced by an anti-angiogenic drug (sunitinib).
The high mean stiffness of tumors in the anti-angiogenic group compared to the others is associated with a higher proportion of fibrosis (Figure 3). This is consistent with results described by Chamming’s et al [3] showing a very significant correlation between stiffness and percentage of fibrosis (Spearmans correlation test, ! ! !!!", p<0.0001).
At Day 13, the percentage of both necrosis and fibrosis of the anti-angiogenic group (20.5 ± 11.3 %; 14.5 ± 9.9 %, respectively) is significantly higher than for cytotoxic (7.8 ± 5.3 %, p=0.01; 5.6 ± 5.0 %, p=0.04) and placebo groups (7.6 ± 5.5 %, p=0.0004; 6.4 ± 6.9 %, p=0.01). At the same time during therapeutic follow-up, the percentage of unperfused area is significantly higher in the anti-angiogenic group (29 ± 21 %) compared to the cytotoxic (7.3 ± 15 %, p=0.004) and placebo groups (7.5 ± 13 %, p=0.002).
Table 1 summarizes the % variation of each measured parameter from the start to the end of therapy. During cytotoxic therapy, only the SWE was significantly modified. The variation of tumor stiffness for the cytotoxic group was 3 to 4 times lower than that for other groups.
!"#$#$%&'( )*#&+,*-&$-.*&'( /0,'.1$(
!"#2( $%&"'()** !"#+* $%&"'()* !"#+* $%&"'()*
345( ,-.* -/-01* 2-.* 3-/---4* 15.* 3-/---4*
/5( %2/6* -/25,* %12.* 3-/---4* %72.* 3-/--8*
467( %05* -/41,* %20.* 3-/---4* %62.* 3-/---4*
487( %-/,* -/878* %61.* 3-/---4* %71.* 3-/--4*
9::( 4/4* -/18-* 48.* 3-/--8* 46.* 3-/--8*
Table 1: Variation between baseline and Day 13 of mean values of each parameter for each group. P-values were calculated using a Wilcoxon signed-rank paired test. Asterisks indicate that the variation from baseline values was significant.
Between the baseline and Day 13, no significant variation of the mean value of functional parameters (PE, WIR, WOR, MTT) was observed for the cytotoxic group whereas all the functional parameters for the anti-angiogenic and placebo group underwent significant variations. For anti-angiogenic and placebo groups, the variation of all parameters, SWE included, between baseline and Day 13 were strongly significant (Table 1). As expected, the anti-angiogenic drug strongly reduced vascularization in term of vascular distribution (unperfused area, Fig 3) and functionality (Table 1).
Finally, modifications of parameters observed with CEUS were associated with changes in the flow and distribution in the functional microvessels. Modifications of the SWE are consistent with modifications observed in other models associated with development of fibrosis but additional histological evaluation is needed to confirm this correlation in our tumor model. Combining these imaging modalities could, therefore, be useful to more completely monitor both the structural and vascular effects of cytotoxic and anti-angiogenic therapies.
REFERENCES
[1] S. M. Weis and D. a Cheresh, “Tumor angiogenesis: molecular
pathways and therapeutic targets.,” Nat. Med., vol. 17, no. 11, pp. 1359–70, Jan. 2011.
[2] M. Lamuraglia et al. “Clinical relevance of contrast-enhanced
ultrasound in monitoring anti-angiogenic therapy of cancer: current status and perspectives.,” Crit. Rev. Oncol. Hematol., vol. 73, no. 3, pp. 202–12, Mar. 2010.
[3] F. Chamming’s et al. “Shear wave elastography of tumour
growth in a human breast cancer model with pathological correlation.,” Eur. Radiol., vol. 23, no. 8, pp. 2079–86, Aug. 2013.
[4] T. Payen et al. “Echo-power estimation from log-compressed
video data in dynamic contrast-enhanced ultrasound imaging.,” Ultrasound Med. Biol., vol. 39, no. 10, pp. 1826–37, Oct. 2013.