HAL Id: hal-02655774
https://hal.inrae.fr/hal-02655774
Submitted on 29 May 2020
HAL is a multi-disciplinary open access
archive for the deposit and dissemination of
sci-entific research documents, whether they are
pub-lished or not. The documents may come from
teaching and research institutions in France or
abroad, or from public or private research centers.
L’archive ouverte pluridisciplinaire HAL, est
destinée au dépôt et à la diffusion de documents
scientifiques de niveau recherche, publiés ou non,
émanant des établissements d’enseignement et de
recherche français ou étrangers, des laboratoires
publics ou privés.
Genetic control of protein, oil and fatty acids content
under partial drought stress and late sowing conditions
in sunflower (Helianthus annuus)
Parham Haddadi, Bahman Yazdi-Samadi, Nicolas Langlade, Mohammad Reza
Naghavi, Monique Berger, Afshin Kalantari, Anne Calmon, Pierre Maury,
Patrick Vincourt, Ahmad Sarrafi
To cite this version:
Parham Haddadi, Bahman Yazdi-Samadi, Nicolas Langlade, Mohammad Reza Naghavi, Monique
Berger, et al.. Genetic control of protein, oil and fatty acids content under partial drought stress and
late sowing conditions in sunflower (Helianthus annuus). African Journal of Biotechnology, Academic
Journals, 2010, 9 (40), pp.6768-6782. �hal-02655774�
Full Length Research Paper
Genetic control of protein, oil and fatty acids content
under partial drought stress and late sowing conditions
in sunflower (
Helianthus annuus)
P. Haddadi
1,2,3, B. Yazdi-samadi
2, N. B. Langlade
1, M. R. Naghavi
2, M. Berger
4, A. Kalantari
2,
A. Calmon
4, P. Maury
5, P. Vincourt
1and A. Sarrafi
3*
1Laboratoire des Interactions Plantes Microorganismes, UMR CNRSINRA 2594/441, Chemin de BordeRouge
-Auzeville -BP 52627- 31326 Castanet Tolosan, France.
2Agronomy and Plant Breeding Department, Faculty of Agriculture, University of Tehran, Karaj, Iran.
3INP-ENSAT, IFR 40, Laboratoire de Symbiose et Pathologie des Plantes (SP2), 18 Chemin de Borde-Rouge, F-31326
Castanet Tolosan, France.
4UMR 1054 INRA/EIP - Laboratoire d’Agrophysiologie, Ecole d’Ingénieurs de Purpan. 75, Voie du TOEC, BP 57611-
31076 Toulouse Cedex 3, France.
5INP-ENSAT, INRA, UMR 1248, Agrosystèmes et Développement Territorial, 31326 Castanet Tolosan, France.
Accepted 6 July, 2010
The purpose of the present study was to map quantitative trait locus (QTLs) associated with percentage of seed protein, oil and fatty acids content under different conditions in a population of recombinant inbred lines (RILs) of sunflower. Three independent field experiments were conducted with well-, partial-irrigated and late-sowing conditions in randomized complete block design with three replications. High significant variation among genotypes is observed for the studied traits in all conditions. Several specific and non-specific QTLs for the aforementioned traits were detected. Under late-sowing condition, a specific QTL of palmitic acid content on linkage group 6 (PAC-LS.6) is located
between ORS1233 and SSL66_1 markers. Common chromosomic regions are observed for percentage of seed oil and stearic acid content on linkage group 10 (PSO-PI.10 and SAC-WI.10) and 15 (PSO-PI.15
and SAC-LS.15). Overlapping occurs for QTLs of oleic and linoleic acids content on linkage groups 10,
11 and 16. Seven QTLs associated with palmitic, stearic, oleic and linoleic acids content are identified on linkage group 14. These common QTLs are linked to HPPD homologue, HuCL04260C001.
Coincidence of the position for some detected QTLs and candidate genes involved in enzymatic and non-enzymatic antioxidants would be useful for the function of the respective genes in fatty acid stability.
Key words: Sunflower, quantitative trait locus, simple sequence repeats, oil content, protein content, fatty acids.
INTRODUCTION
Sunflower (Helianthus annuus L.) is cultivated as a source of vegetable oil and protein. Oil, fatty acid com-position and protein contents are the main factors determining seed nutritional properties. Sunflower seed oil is composed of unsaturated fatty acids (90%), oleic and linoleic acids and the rest (10%) containing saturated
*Corresponding author. E-mail: sarrafi@ensat.fr. Tel: 33 5 62193580.
fatty acids, palmitic and stearic acids (Dorrel and Vick, 1997; Pérez-Vich et al., 2002a). The role of unsaturated fatty acids on the quality of vegetable oil, the protection of membrane under low temperature and membrane fluidity is more important than the effect of saturated fatty acids because of their lower melting point (Neidleman, 1987; Thompson, 1993; Heppard et al., 1996). The classical method, gas chromatography (GC), is used to determine the fatty acid composition of the oil in sunflower seeds (Pérez-Vich et al., 1998). This technique is reliable but expensive, long and uses hazardous chemicals (Pérez-
Vich et al., 1998). Near-infrared reflectance spectrometry (NIRS) is a more rapid, simple and non-destructive method used by breeders and food industry to determine multiple parameters such as proteins, oil content and fatty acid compositions (Pérez-Vich et al., 1998; Velasco and Becker, 1998; Biskupek-Korell and Moschner, 2007).
Sunflower has been considered for construction of molecular map. Various molecular markers, such as restriction fragment length polymorphism (RFLP) (Gentzbittel et al., 1995, Berry et al., 1995) and amplified fragment length polymorphisms (AFLP) (Gedil et al., 2001) have been used. Genetic-linkage map based on 459 simple sequence repeats (SSR), has also been constructed (Tang et al., 2002), which is the first reference map of sunflower based on single- or low-copy public SSR markers. The value of SSRs is that they usually detect single loci and are specific to a given place in the genome. SSRs are also highly variable and scored as co-dominant markers.
The genetic studies on sunflower mutant lines; CAS-12 and CAS-5, with high palmitic acid content, revealed that high palmitic acid can be controlled by three partially recessive alleles (p1, p2 and p3) at 3 loci (Pérez-Vich et al., 2002a). CAS-14, CAS-3, CAS-4 and CAS-8 lines, containing respectively 35, 28, 15 and 14% stearic acid, have been released as high and medium stearic acid sunflower mutants (Garcés and Mancha, 1991; Cantisán et al., 2000). The level of stearic acid is controlled by ES1
and ES2 genes in CAS-3 mutant whereas it is increased by the ES3 gene in CAS14 mutant (Garcés and Mancha, 1991). ES3 gene is also mapped to linkage group 8 (Garcés and Mancha, 1991). Three genes, designated
Ol1, Ol2, and Ol3, are reported which are associated with high oleic acid content in sunflower seed (Fernández
-Martínez et al., 1989). Among three microsomal oleate desaturase, FAD2-1 is strictly correlated with high oleic acid content in sunflower seed oil (Martínez-Rivas et al., 2001). EcoRI and HindIII fragments, which are polymer-phic in association with low and high oleic acid content genotypes, are also identified (Lacombe and Berville, 2001).
The genetic control of stearic and oleic acids in sunflower seed oil is also investigated through QTL analysis and co-segregation between stearoyl-ACP desa-turase locus (SAD17A) and ES1 gene and between oleoyl-PC desaturase locus (OLD7) and OL gene are reported (Pérez-Vich et al., 2002b). In this study two QTLs controlling stearic and oleic acids content are also mapped to LG1 (SAD17A) and LG14 (OLD7). Several QTLs for oil and fatty acid content are identified by Ebrahimi et al. (2008). Six QTLs are detected for oil content in a population of F3 families of sunflower and the most important QTL is located on linkage group 13 (pog-13-1) which explained 47% of phenotypic variance (R2) (Mokrani et al., 2002). As far as other species are
concerned, overlapping chromosomic regions and nine epistatic locus pairs are identified for oil and protein content in rapeseed (Zhao et al., 2006). In Brassica juncea, 6 and 5 QTLs are detected for oil and protein
Haddadi et al. 6769
content, respectively (Mahmood et al., 2006). Protein, oil and fatty acids content are influenced by environmental factors. Water stress significantly decreases oil content in sunflower (Muriel and Downes, 1974; Nel et al., 2002) whereas protein content at maturity is increased in sun-flower (Ebrahimi et al., 2009), wheat (Ozturk and Aydin, 2004) and peanuts (Dwivedi et al., 1996). An increase of oleic acid content in sunflower (Baldini et al., 2002) and peanuts (Dwivedi et al., 1996) is also observed under water deficit. The ratio of oleic to linoleic acid can be strongly affected by temperature regimes in sunflower (Trémoliéres et al., 1982), whereas it can be hardly affec-ted in safflower (Browse and Slack, 1983) and rapeseed (Trémoliéres et al., 1982). The effect of sowing time (temperature regimes) on fatty acid content depends on species and genotypes. In sunflower, the ratio of oleic to linoleic acid is increased under water stress (Talha and Osman, 1974) whereas under early-sowing condition, it is decreased (Flagella et al., 2002). Activation of enzymatic and nonenzymatic antioxidant-related genes can result in the protection of fatty acids against oxidative stress and finally increasing their stability (Munné-Bosch and Alegre, 2002; Collakova and DellaPenna, 2003; Kanwischer et al., 2005; Marwede et al., 2005; Semchuk et al., 2009). In this research, we used genetic-linkage map based only on SSR markers and some important candidate genes for enzymatic, non-enzymatic antioxidant, drought-responsive family and phosphoglyceride transfer due to genetic study of protein, oil and fatty acids content in a population of recombinant inbred lines (RILs) of sunflower under well-, partial-irrigated and late-sowing conditions. Objectives of this investigation are to identify chromosomal regions associated with quantitative variation of protein, oil and fatty acid compositions under various conditions and to validate the extent to which these candidate genes affect quantitative phenotypic variability for the studied traits in sunflower grains.
MATERIALS AND METHODS
Plant materials and experimental conditions
RILs used in this research were developed through single seed descent from F2 plants, derived from a cross between PAC2 and RHA266 (Flores et al., 2000). Three independent experiments were undertaken in different conditions at experimental field of Agric-ultural College, Tehran University, Iran, 2007. Experimental design was randomized complete block with three replications. Seeds of 89 RILs and their two parents were sown in the field under well-, partial-irrigated and late-sowing conditions. Each genotype per replication consisted of one row, 4 m long, 50 cm between rows and 25 cm between plants in rows. The distance between repli-cations of well-irrigated and partial-irrigated treatments was 7 m. The so-called ‘well-irrigated’ condition plots were irrigated once every week, whereas for the second condition (partial-irrigated), irrigation was controlled and adjusted by the observation of the wilting threshold of the leaves. Partial water deficit was started 45 days after sowing at the stage near flower bud formation and continued up to maturity. The sowing dates were normal sowing on May and late sowing on July.
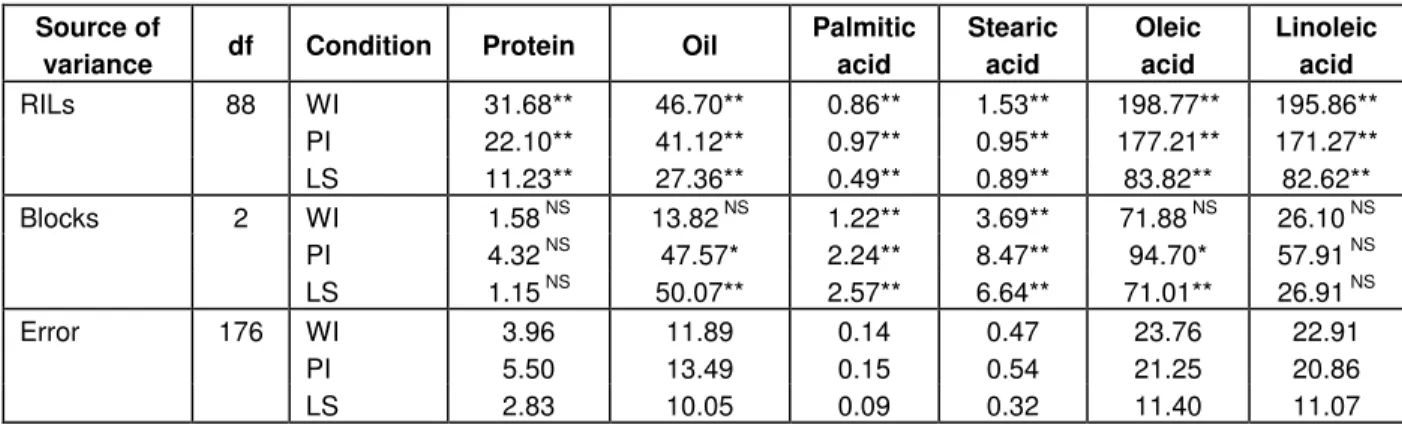
Table 1. Analysis of variance (mean squares) for percentage of seed protein, percentage of seed oil, palmitic, stearic, oleic and linoleic acids content in a population of sunflower recombinant inbred lines (RILs) grown under well-irrigated (WI), partial-irrigated (PI) and late-sowing (LS) conditions.
Source of
variance df Condition Protein Oil
Palmitic acid Stearic acid Oleic acid Linoleic acid WI 31.68** 46.70** 0.86** 1.53** 198.77** 195.86** PI 22.10** 41.12** 0.97** 0.95** 177.21** 171.27** RILs 88 LS 11.23** 27.36** 0.49** 0.89** 83.82** 82.62** WI 1.58 NS 13.82 NS 1.22** 3.69** 71.88 NS 26.10 NS PI 4.32 NS 47.57* 2.24** 8.47** 94.70* 57.91 NS Blocks 2 LS 1.15 NS 50.07** 2.57** 6.64** 71.01** 26.91 NS WI 3.96 11.89 0.14 0.47 23.76 22.91 PI 5.50 13.49 0.15 0.54 21.25 20.86 Error 176 LS 2.83 10.05 0.09 0.32 11.40 11.07
*, **: Significant at 0.05 and 0.01 probability level, respectively. NS: non-significant.
Trait measurements
Percentage of seed protein (PSP), percentage of seed oil (PSO), palmitic acid content (PAC), stearic acid content (SAC), oleic acid content (OAC) and linoleic acid content (LAC) were measured in RILs and their parental lines in each replication for all conditions by the FOSS Near-infrared reflectance spectrometry (NIRSystems 6500). Forty grams of sunflower seeds per genotype per condition per replication were ground in a Knifetec 1095 Sample Mill (1975, FOSS, Tecato, Hoganas, Sweden) three times for 10 s each. No sample material adhered to the walls of the mill because the sample was mixed at each interval. A FOSS NIRSystems 6500 spectrophotometer (Foss Analytical, Denmark) was used to collect spectra from the ground sunflower seeds using a small round cup with a quartz window. The reflectance (R) of each sample was measured as log of 1/R from 400 to 2500 nm at 2 nm intervals. The absorption maximum around 1700 - 1800 and 2300 - 2400 nm were due to oil and fatty acid content. The area near to 2180 nm was related to protein content.
Statistical analysis and map construction
Data were analyzed using SAS PROC GLM (SAS Institute Inc., 1996) and the statistical package for the social sciences (SPSS). Statistical analysis was carried out in order to determine the main effect of RILs for the studied traits. The mean of RILs and that of their parents were compared for all the traits. Genetic gain when the best RIL is compared with the best parent (GGB) and when the mean of the top 10% selected RILs is compared with the mean of the parents (GG10%), were calculated for the traits. Simple corre-lation coefficients (Pearson) among the studied traits were also determined.
Some important tocopherol pathway-related genes, enzymatic antioxidant-related genes, drought-responsive genes and phospho-glyceride transfer-related genes were used to improve our department genetic map (Poormohammad et al., 2007). Respective sequence data for candidate genes were obtained from the
Arabidopsis Information Resource (www.arabidopsis.org). In order
to seek the helianthus homolog sequences to the Arabidopsis
genes, we used the composite expressed sequence tags (EST) assembly clusters, available at the Helianthus-devoted bioin-formatics portal Heliagene (www.heliagene.org). The Helianthus
EST clusters presenting the reciprocal blast with the highest score and lowest E value with regarde to the original Arabidopsis genes
were chosen for our studies. Genotyping was done by SNP-based CAPS marker and high resolution melting (HRM) as well as directly on agarose gel. The chromosomal locations of QTLs were resolved by composite interval mapping (CIM), using Win QTL Cartographer, version 2.5 (Wang et al., 2005) with the mean values of three replications for each RIL in each conditions. The genome was scanned at 2-cM intervals; with a window size of 15 cM. Up to 15 background markers were used as cofactors in the CIM analysis with the program module Srmapqtl (model 6). Additive effects of the detected QTLs were estimated with the Zmapqtl program (Basten et al., 2002). The percentage of phenotypic variance (R2) explained by
each QTL was estimated by Win QTL Cartographer.
RESULTS
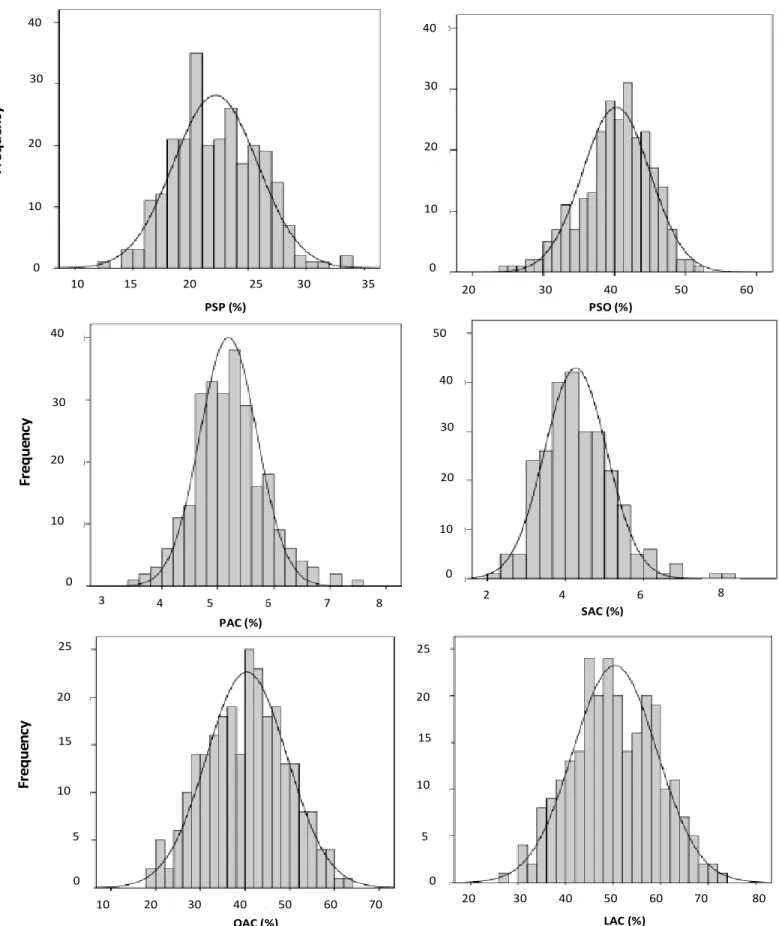
Phenotypic variation
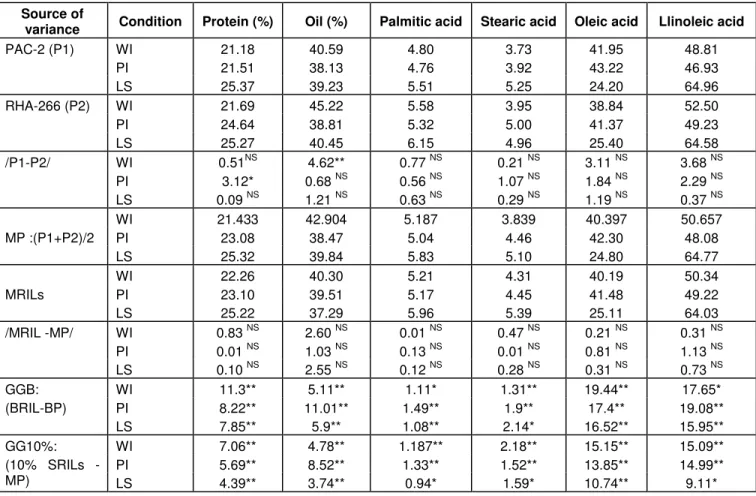
Results of analysis of variance for PSP, PSO, PAC, SAC, OAC and LAC are presented in Table 1. A normal distri-bution was observed for studied traits under all conditions and is shown in Figure 1 for well-irrigated condition. Significant genotypic effect is observed for afore-mentioned traits in well-, partial-irrigated and late-sowing conditions. Genetic gain and phenotypic performance of RILs and their parents for above-mentioned traits in all conditions are presented in Table 2. The differences between the mean of RILs (MRILs) and the mean of their parents (MP) for all studied traits are non-significant. The comparison between the best parent (BP) and the best RIL (BRIL), considered as genetic gain (GGB), showed a significant difference for all traits in all conditions. A large genetic variability is observed for all studied traits resul-ting in significant differences between the 10% selected RILs (10%SRILs) and the mean of the parents for all conditions. Phenotypic correlations among different traits in different conditions are presented in Table 3. A signi-ficant and positive correlation is observed between PSP and SAC, between PSO and LAC, between PAC and SAC and between PAC and LAC in all conditions. A
Haddadi et al. 6771
Figure 1. Distribution for percentage of seed protein (PSP), percentage of seed oil (PSO), palmitic acid content (PAC), stearic acid content (SAC), oleic acid content (OAC) and linoleic acid content (LAC) in a population of sunflower recombinant inbred lines (RILs) grown under well-irrigated condition.
Table 2. Genetic variability and genetic gain for percentage of seed protein, percentage of seed oil, palmitic, stearic, oleic and linoleic acids content (in percentage of oil) in a population of sunflower recombinant inbred lines (RILs) grown under well-irrigated (WI), partial-irrigated (PI) and late-sowing (LS) conditions.
Source of
variance Condition Protein (%) Oil (%) Palmitic acid Stearic acid Oleic acid Llinoleic acid
WI 21.18 40.59 4.80 3.73 41.95 48.81 PI 21.51 38.13 4.76 3.92 43.22 46.93 PAC-2 (P1) LS 25.37 39.23 5.51 5.25 24.20 64.96 WI 21.69 45.22 5.58 3.95 38.84 52.50 PI 24.64 38.81 5.32 5.00 41.37 49.23 RHA-266 (P2) LS 25.27 40.45 6.15 4.96 25.40 64.58 WI 0.51NS 4.62** 0.77 NS 0.21 NS 3.11 NS 3.68 NS PI 3.12* 0.68 NS 0.56 NS 1.07 NS 1.84 NS 2.29 NS /P1-P2/ LS 0.09 NS 1.21 NS 0.63 NS 0.29 NS 1.19 NS 0.37 NS WI 21.433 42.904 5.187 3.839 40.397 50.657 PI 23.08 38.47 5.04 4.46 42.30 48.08 MP :(P1+P2)/2 LS 25.32 39.84 5.83 5.10 24.80 64.77 WI 22.26 40.30 5.21 4.31 40.19 50.34 PI 23.10 39.51 5.17 4.45 41.48 49.22 MRILs LS 25.22 37.29 5.96 5.39 25.11 64.03 WI 0.83 NS 2.60 NS 0.01 NS 0.47 NS 0.21 NS 0.31 NS PI 0.01 NS 1.03 NS 0.13 NS 0.01 NS 0.81 NS 1.13 NS /MRIL -MP/ LS 0.10 NS 2.55 NS 0.12 NS 0.28 NS 0.31 NS 0.73 NS WI 11.3** 5.11** 1.11* 1.31** 19.44** 17.65* PI 8.22** 11.01** 1.49** 1.9** 17.4** 19.08** GGB: (BRIL-BP) LS 7.85** 5.9** 1.08** 2.14* 16.52** 15.95** WI 7.06** 4.78** 1.187** 2.18** 15.15** 15.09** PI 5.69** 8.52** 1.33** 1.52** 13.85** 14.99** GG10%: (10% SRILs - MP) LS 4.39** 3.74** 0.94* 1.59* 10.74** 9.11*
Table 3. Simple correlation coefficients (Pearson) among percentage of seed protein (PSP), percentage of seed oil (PSO), palmitic, stearic, oleic and linoleic acids content (PAC, SAC, OAC and LAC, respectively) in sunflower (RILs) under well-irrigated (WI), partial-irrigated (PI) and late-sowing (LS) conditions.
Parameters Condition Correlation coefficients
LS -0.98** PI -0.99** OAC WI -0.99** LS -0.15* 0.06 ns PI -0.07 ns -0.02ns SAC WI -0.07 ns -0.15* LS 0.42** -0.72** 0.67** PI 0.31** -0.84** 0.81** PAC WI 0.15** -0.84** 0.81** LS 0.10ns -0.25** -0.10ns 0.18** PI 0.27** -0.30** -0.21** 0.25** PSO WI 0.27** -0.46** -0.28** 0.33** LS -0.35** -0.23** 0.45** 0.08 ns -0.07 ns PI -0.63** -0.24** 0.56** 0.33** -0.36** PSP WI -0.65** -0.41** 0.64** 0.44** -0.48**
PSO PAC SAC OAC LAC
significant and negative correlation is also observed bet-ween PSP and PSO, betbet-ween PSP and PAC, betbet-ween PSO and SAC and between PAC and OAC under all conditions. There is a high significant and negative cor-relation between OAC and LAC. Under well- and partial-irrigated conditions, the correlation between PSP and OAC and between PSO and PAC is significant and positive whereas a significant and negative correlation is observed between PSP and LAC and between PSO and OAC.
QTL analysis
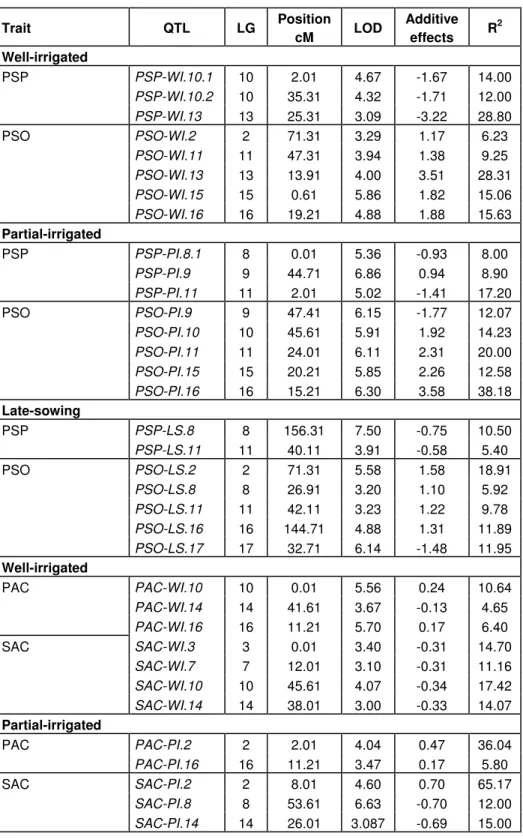
The map position and characteristics of QTLs associated with the studied traits in the field under well-, partial-irrigated and late-sowing conditions are presented in Table 4. QTLs are designated as the abbreviation of the trait followed by ‘WI’, ‘PI’ and ‘LS’ for well-irrigated, partial-irrigated and late-sowing conditions. The corres-ponding linkage group and the number of QTLs in the group are also indicated for each QTL. Two to six QTLs are identified depending on the trait and conditions. Both parental lines contribute to the expression of the different target traits and positive or negative additive effects are presented (Table 4). Co-localized QTLs are detected for all traits on various linkage groups (Figure 2). Detected QTLs for PSP is shown from 5.4 - 28.8% of the phenotypic variance (R2). The most important QTL for PSP (PSP - WI.13) is identified on linkage group 13. Positive alleles for this QTL come from RHA266. The percentage of phenotypic variance (R2) explained by QTLs of PSO ranged from 5.92 - 38.18%. The major QTL for PSO (PSO - PI.16) is identified on linkage group 16 which explained 38.18% of the phenotypic variance. On linkage group 16, we also identified 2 other QTLs for this trait under well-irrigated and late-sowing conditions. They are co-located with several QTLs controlling fatty acids content (Figure 2). The percentage of phenotypic varia-nce (R2) explained by QTLs of PAC ranged from 4.65 -
38%. Most of the positive alleles for these QTLs come from PAC2. Under late-sowing condition, identified QTLs for SAC is explained from 7.31-54.38% of the phenotypic variance. Several QTLs are detected for OAC under all conditions. The percentage of phenotypic variance (R2) explained by these QTLs ranged from 5.31 - 67.35%. The most important QTL for OAC (OAC - WI.10) is located on linkage group 10 where several QTLs controlling fatty acids are found. Under late-sowing condition, five QTLs for LAC are identified which explained from 4.36- 53.72% of the phenotypic variance.
DISCUSSION
Significant differences between the parents are observed only for PSO in well- irrigated condition and PSP under
Haddadi et al. 6773
partial-irrigated conditions, indicating gene expression differences between them for these two traits under the two conditions (Table 2). Non significant differences between the mean of the RILs (MRILs) and the mean of their parents (MP) reveal that the RILs used in this re-search are representative of all possible genetic com-binations between the two parents ‘PAC2’ and ‘RHA266’. Genetic gain (GGB) when the best RIL is compared with the best parent and GG 10% Sel, considered as the differences between the mean of the top 10% selected RILs and the mean of the parents, are significant for all the studied traits, revealing transgressive segregation for all the studied traits. Transgressive segregation is also reported for water status traits (Poormohammad et al., 2007) and yield-related traits (Poormohammad et al., 2009) in the same population. Transgressive segregation would be the result of the accumulation of favorable alleles coming from different parental lines. The positive and negative signs of additive effect at the different loci (Table 4) indicate the contribution of both parental lines and confirm the transgressive segregation observed at the phenotypic level. The mean of late-sown RILs for LAC is increased (64.03%) compared to the well-irrigated RILs (50.34%). Highly significant correlations are observed among most of the studied traits. High negative correlation between OAC and LAC in all conditions is similar to the results of Lagravère et al. (2004) and Ebrahimi et al. (2008) in sunflower. A significant and positive correlation between PSP and OAC and between PSO and PAC is observed under well- and partial-irrigated conditions whereas correlation between them is not significant under late-sowing condition. Non signi-ficant correlation between PSP and LAC and between PSO and OAC is observed under late-sowing condition whereas correlation between them is significant and negative under well- and partial-irrigated conditions. Cor-relation between OAC and PAC is negative in all conditions, which is similar to the results of Ebrahimi et al. (2008) in sunflower and Möllers and Schierholt (2002) in rapeseed.
The QTLs detected in the current research reveal that several putative genomic regions are involved in the expression of the mentioned traits under all conditions. A specific QTL for PSP is identified on linkage group 8
(PSP-LS.8). This QTL, controlled by RHA266 alleles, appears to be important in late-sowing condition. Over-lapping occurs for QTLs of PSP and PSO on linkage group 9 (PSP-PI.9 and PSO-PI.9) and 11 (PSP-PI.11 and
PSO-PI.11). Significant and negative correlation between PSP and PSO (Table 3) is justified by opposite additive effects of their overlapped QTLs (Table 4). Negative cor-relation between PSP and PSO (Table 3) and their overlapped QTLs with opposite additive effects (Table 4) are also reported in the previous studies (Lee et al., 1996; Zhao et al., 2002; Mahmood et al., 2006; Ebrahimi et al., 2008). This phenomenon poses potential challenges to breeders for simultaneous improvement of both traits.
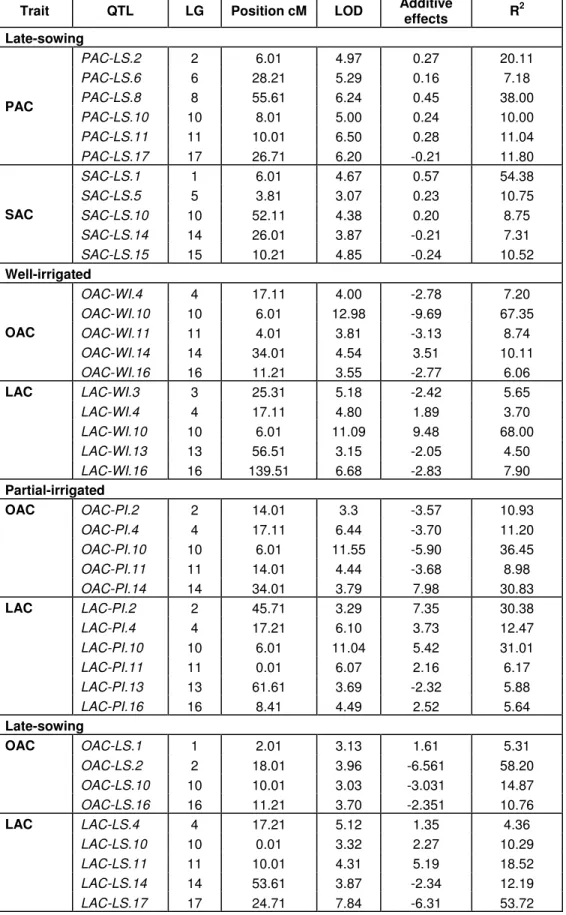
Table 4. QTLs detected for percentage of seed protein (PSP), percentage of seed oil (PSO), palmitic acid content (PAC), stearic acid content (SAC), oleic acid content (OAC) and linoleic acid content (LAC) under well-, partial-irrigated and late-sowing conditions.
Trait QTL LG Position cM LOD Additive effects R 2 Well-irrigated PSP-WI.10.1 10 2.01 4.67 -1.67 14.00 PSP-WI.10.2 10 35.31 4.32 -1.71 12.00 PSP PSP-WI.13 13 25.31 3.09 -3.22 28.80 PSO-WI.2 2 71.31 3.29 1.17 6.23 PSO-WI.11 11 47.31 3.94 1.38 9.25 PSO-WI.13 13 13.91 4.00 3.51 28.31 PSO-WI.15 15 0.61 5.86 1.82 15.06 PSO PSO-WI.16 16 19.21 4.88 1.88 15.63 Partial-irrigated PSP-PI.8.1 8 0.01 5.36 -0.93 8.00 PSP-PI.9 9 44.71 6.86 0.94 8.90 PSP PSP-PI.11 11 2.01 5.02 -1.41 17.20 PSO-PI.9 9 47.41 6.15 -1.77 12.07 PSO-PI.10 10 45.61 5.91 1.92 14.23 PSO-PI.11 11 24.01 6.11 2.31 20.00 PSO-PI.15 15 20.21 5.85 2.26 12.58 PSO PSO-PI.16 16 15.21 6.30 3.58 38.18 Late-sowing PSP-LS.8 8 156.31 7.50 -0.75 10.50 PSP PSP-LS.11 11 40.11 3.91 -0.58 5.40 PSO-LS.2 2 71.31 5.58 1.58 18.91 PSO-LS.8 8 26.91 3.20 1.10 5.92 PSO-LS.11 11 42.11 3.23 1.22 9.78 PSO-LS.16 16 144.71 4.88 1.31 11.89 PSO PSO-LS.17 17 32.71 6.14 -1.48 11.95 Well-irrigated PAC-WI.10 10 0.01 5.56 0.24 10.64 PAC-WI.14 14 41.61 3.67 -0.13 4.65 PAC PAC-WI.16 16 11.21 5.70 0.17 6.40 SAC-WI.3 3 0.01 3.40 -0.31 14.70 SAC-WI.7 7 12.01 3.10 -0.31 11.16 SAC-WI.10 10 45.61 4.07 -0.34 17.42 SAC SAC-WI.14 14 38.01 3.00 -0.33 14.07 Partial-irrigated PAC-PI.2 2 2.01 4.04 0.47 36.04 PAC PAC-PI.16 16 11.21 3.47 0.17 5.80 SAC-PI.2 2 8.01 4.60 0.70 65.17 SAC-PI.8 8 53.61 6.63 -0.70 12.00 SAC SAC-PI.14 14 26.01 3.087 -0.69 15.00
However, independent segregation of QTLs for PSP and PSO provides opportunity for simultaneous improve-ment of these two traits in sunflower. Under partial-irrigated condition, a specific QTL of PSP on linkage
group 8 (PSP-PI.8) is linked to candidate gene, HuCL 02840C003 (Figure 2). This candidate gene, homo-genitisate phytyltransferase (VTE2), is involved in toco-pherol pathway (Kanwischer et al., 2005). The most
Haddadi et al. 6775
Table 4. Contd.
Trait QTL LG Position cM LOD Additive effects R2 Late-sowing PAC-LS.2 2 6.01 4.97 0.27 20.11 PAC-LS.6 6 28.21 5.29 0.16 7.18 PAC-LS.8 8 55.61 6.24 0.45 38.00 PAC-LS.10 10 8.01 5.00 0.24 10.00 PAC-LS.11 11 10.01 6.50 0.28 11.04 PAC PAC-LS.17 17 26.71 6.20 -0.21 11.80 SAC-LS.1 1 6.01 4.67 0.57 54.38 SAC-LS.5 5 3.81 3.07 0.23 10.75 SAC-LS.10 10 52.11 4.38 0.20 8.75 SAC-LS.14 14 26.01 3.87 -0.21 7.31 SAC SAC-LS.15 15 10.21 4.85 -0.24 10.52 Well-irrigated OAC-WI.4 4 17.11 4.00 -2.78 7.20 OAC-WI.10 10 6.01 12.98 -9.69 67.35 OAC-WI.11 11 4.01 3.81 -3.13 8.74 OAC-WI.14 14 34.01 4.54 3.51 10.11 OAC OAC-WI.16 16 11.21 3.55 -2.77 6.06 LAC-WI.3 3 25.31 5.18 -2.42 5.65 LAC-WI.4 4 17.11 4.80 1.89 3.70 LAC-WI.10 10 6.01 11.09 9.48 68.00 LAC-WI.13 13 56.51 3.15 -2.05 4.50 LAC LAC-WI.16 16 139.51 6.68 -2.83 7.90 Partial-irrigated OAC-PI.2 2 14.01 3.3 -3.57 10.93 OAC-PI.4 4 17.11 6.44 -3.70 11.20 OAC-PI.10 10 6.01 11.55 -5.90 36.45 OAC-PI.11 11 14.01 4.44 -3.68 8.98 OAC OAC-PI.14 14 34.01 3.79 7.98 30.83 LAC-PI.2 2 45.71 3.29 7.35 30.38 LAC-PI.4 4 17.21 6.10 3.73 12.47 LAC-PI.10 10 6.01 11.04 5.42 31.01 LAC-PI.11 11 0.01 6.07 2.16 6.17 LAC-PI.13 13 61.61 3.69 -2.32 5.88 LAC LAC-PI.16 16 8.41 4.49 2.52 5.64 Late-sowing OAC-LS.1 1 2.01 3.13 1.61 5.31 OAC-LS.2 2 18.01 3.96 -6.561 58.20 OAC-LS.10 10 10.01 3.03 -3.031 14.87 OAC OAC-LS.16 16 11.21 3.70 -2.351 10.76 LAC-LS.4 4 17.21 5.12 1.35 4.36 LAC-LS.10 10 0.01 3.32 2.27 10.29 LAC-LS.11 11 10.01 4.31 5.19 18.52 LAC-LS.14 14 53.61 3.87 -2.34 12.19 LAC LAC-LS.17 17 24.71 7.84 -6.31 53.72
The QTLs are designated as the abbreviation of the trait followed by `WI `, `PI ` and `LS ` for well-irrigated, partial-irrigated and late-sowing. The positive additive effect shows that PAC2 alleles increase the trait and negative additive effect shows that RHA266 alleles increase it. Fatty acids are measured as percentage of oil.
ORS803 0,0 HuCL0079C003 18,1 ORS509 36,8 ORS365 48,1 HA4090 53,7 ORS959 61,5 ORS53 68,6 S A C -L S .1 O A C -L S .1
LG1
SSL303 0,0 ORS718 4,6 HA2920 12,3 HA3938 17,3 ORS657 25,3 ORS432 35,5 SSU129 43,3 SSU123_2 53,0 S A C -W I.3 LA C -W I.3LG3
ORS620 0,0 HA991 8,3 HA432 12,5 HA1258 13,4 ORS1068 17,1 ORS337 17,2 ORS671_1 32,0 O A C -W I.4 O A C -P I.4 LA C -W I.4 LAC -P I.4 LA C -L S .4LG4
ORS533 0,0 HA3627 1,8 ORS523_1 9,7 ORS31_2 28,4 ORS1024_1 32,5 SSL231 36,6 HA3700 43,6 ORS1159 49,7 ORS1024_2 58,5 S A C -L S .5LG5
HA4103 0,0 ORS381 7,2 ORS1233 14,2 SSL66_1 38,6 ORS1287_1 53,6 P A C -L S .6LG6
ORS342 0,0 ORS229 31,7 ORS653 61,6 ORS203 66,3 ORS925 69,3 ORS525_1 71,3 ORS1194 ORS1045 73,9 HA3208 79,4 HA3239 83,4 ORS1035 86,8 ORS423 93,5HuCL00156C004
99,2HuCL10527C001
102,1 P A C -P I.2 P A C -L S .2 S A C -P I.2 OAC -L S .2 O A C -P I.2 LA C -P I.2 P S O -W I.2 P S O -L S .2LG2
Haddadi et al. 6777 ORS331_2 0,0 ORS331_1 14,6 HA3103 22,4 ORS1041 32,5 HA1848 33,9 S A C -W I.7 LG7 HuCL02840C003 0,0 HuCX944063 18,9 HuCL02051C001 39,0 HA2605 76,2 ORS894_2 87,2 HA3278 90,2 HA3581 97,9 ORS329 107,8 ORS894_1 113,0 ORS624 119,8 ORS418_1 131,2 ORS243 141,1 SSL30 156,3 HuCL02246C001 173,3 HuCL00001C054 182,9 P S P -P I.8 .1 P S P -L S .8 P S O -L S .8 S A C -P I.8 PAC -L S .8 LG8 ORS805 0,0 ORS1009 17,1 ORS1127 25,3 ORS428_1 27,4 SSL102 30,5 ORS887 39,1 SSL29 42,7 SSL13 45,4 ORS510 50,2 HA2564 63,5 ORS428_2 HA2063 68,6 HA477 70,8 HA2053 77,3 P S P -P I.9 P S O -P I.9 LG9 HADDADI HA928 0,0 HA3847 18,1 HA3039 24,9 HA2600 27,4 HA2579 33,3 ORS591 41,4 ORS437 ORS78 42,0 SSL39 45,6 ORS380 48,1 SSL49 55,3 SSL3 61,7 SSL66_2 66,0 ORS807 76,6 ORS1144 79,7 P S P -W I.1 0.1 P S P -W I.1 0.2 P S O -P I.1 0 P A C -W I.1 0 S A C -W I.1 0 P A C -L S .1 0 S A C -L S .1 0 O A C -W I.1 0 LA C -W I.1 0 O A C -P I.1 0 LA C -P I.1 0 O A C -L S .1 0 LA C -L S .1 0 LG10
HADDADI
HuCL00358C002 0,0 SSL27 32,1 ORS5_1 40,1 ORS1146 46,5 ORS354 47,3 HA3448 66,2 P S O -W I.1 1 P S P -P I.1 1 PSO -P I.1 1 P S P -L S .1 1 P S O -L S .1 1 P A C -L S .1 1 O A C -W I.1 1 O A C -P I.1 1 LA C -P I.1 1 LA C -L S .1 1 LG11HA2598 0,0 HA3330 5,9 ORS511 21,3 ORS316 37,2 SSU39 54,5 ORS630 57,6 HA4208 71,6 P S P -W I.1 3 P S O -W I.1 3 LA C -W I.1 3 LA C -P I.1 3
LG13
SSU217 0,0 SSU195 0,5 ORS1043 5,8 HA3513 12,7 ORS1152_1 22,0 HuCL04260C001 41,6 ORS391 55,7 SSU227 58,6 SSU123_1 59,5 SSL20_1 61,8 SSL33 68,2 ORS1086_1 71,6 HA293 79,7 HA2077 89,8 P A C -W I.1 4 S A C -W I.1 4 S A C -P I.1 4 S A C -L S .1 4 O A C -P I.1 4 O A C -W I.1 4 LA C -L S .1 4LG14
ORS1242 0,0 ORS499 0,6 ORS687 6,2 HA4239 25,7 HA876 28,0 HA1837 38,9 HA3102 54,7 ORS401 63,3 ORS121 73,3 SSU223 75,4 SSU25 79,4 ORS8 84,1 HuCL09897C001 103,3 P S O -W I.1 5 P S O -P I.1 5 S A C -L S .1 5LG15
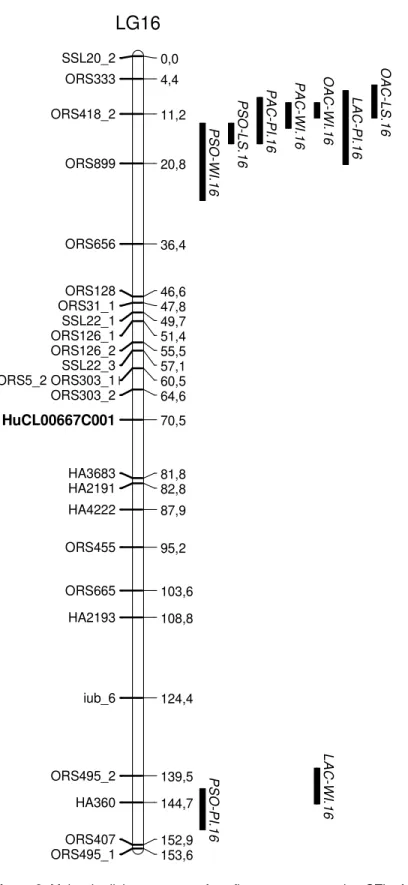
Haddadi et al. 6779 SSL20_2 0,0 ORS333 4,4 ORS418_2 11,2 ORS899 20,8 ORS656 36,4 ORS128 46,6 ORS31_1 47,8 SSL22_1 49,7 ORS126_1 51,4 ORS126_2 55,5 SSL22_3 57,1 ORS5_2 ORS303_1 60,5 ORS303_2 64,6 HuCL00667C001 70,5 HA3683 81,8 HA2191 82,8 HA4222 87,9 ORS455 95,2 ORS665 103,6 HA2193 108,8 iub_6 124,4 ORS495_2 139,5 HA360 144,7 ORS407 152,9 ORS495_1 153,6 P S O -W I.1 6 P S O -P I.1 6 P S O -L S .1 6 P A C -P I.1 6 P A C -W I.1 6 O A C -W I.1 6 LA C -W I.1 6 LA C -P I.1 6 O A C -L S .1 6
LG16
SSL22_2 0,0 ORS169 11,9 ORS297 16,7 ORS1040 36,0 ORS677 47,5 ORS1097 51,8 ORS1247 59,3 HA1402 65,3 ORS727 71,6 HuCL03143C001 84,7 P S O -L S .1 7 P A C -L S .1 7 LA C -L S .1 7LG17
Figure 2. Molecular linkage groups of sunflower map presenting QTLs for percentage of seed protein (PSP), percentage of seed oil (PSO), palmitic acid content (PAC), stearic acid content (SAC), oleic acid content (OAC) and linoleic acid content (LAC).The positions of QTLs are shown on the right side of the linkage groups. Bars represent intervals associated with the QTLs. The candidate genes are: HuCL00790C003; glutation s-transferase (GST), HuCL00156C004; pattelin 2 (PAT2), HuCL10527C001; phosphoglyceride transfer (SEC14), HuCL02840C003; homogenitisate phytyltransferase (VTE2), HuCX944063; PSI P700, HuCL02051C001; drought-responsive family protein, HuCL00001C054; catalase (CAT), HuCL02246C001; tocopherol methyl-transferase (VTE4), HuCL00358C002; 4-hydroxy-3-methylbut-2-enyl diphosphate
(HMBPP), HuCL04260C001; p-hydroxyphenylpyruvate dioxygenase (HPPD), HuCL09897C001; cytosolic factor (SEC 14), HuCL00667C001;
important QTL of PSO (PSO-PI.16) is mapped to linkage group 16 between ORS495_2 and ORS407 markers. This chromo-somic region is important for oil content as it is also reported by Tang et al. (2006) and Ebrahimi et al. (2008) for seed oil content. A common QTL for PSO is identified on linkage group 2 (PSO-WI.2, PSO-LS.2). These QTLs, controlled by the PAC2 alleles, appear to be important in both well-irrigated conditions. This region on linkage group 2, linked to ORS521_1 marker, is also reported for oil content under greenhouse condition (Ebrahimi et al., 2008). Under late-sowing condition, a specific QTL of PSO on linkage group 8 (PSO-LS.8) is assigned to candi-date gene, HuCX944063 which is involve in photosystem I. The oil content is positively associated with leaf area which determines the photo-synthetic capacity of sun-flower (Hervé et al., 2001). Overlapped chromosomic regions for PSO and SAC are identified on linkage group 10 (PSO-PI.10 and SAC-WI.10) and 15 (PSO-PI.15 and SAC-LS.15). A significant and negative association between PSO and SAC (Table 3) is strengthened by opposite additive effects of their overlapped QTLs (Table 4). There is an important overlapped region for PAC, LAC and PSO on linkage group 17 (PAC-LS.17, LAC-LS.17 and PSO-LS.17). This chromosomic region is located between ORS297 and ORS1040 markers. A specific QTL for LAC which was also linked to ORS297 marker was already detected in this region (Ebrahimi et al., 2008). A common QTL of PAC on linkage group 16 (PAC-WI.16 and PAC-PI.16) is linked to the SSR marker, ORS418_2. Several QTLs of PSO, OAC and LAC are also identified in this region. Seven QTLs associated with PAC, SAC, OAC and LAC are identified on linkage group 14. These overlapped QTLs are linked to candidate gene, HuCL04260C001 which modulates the expression of p-hydroxyphenyl-pyruvate dioxygenase (HPPD). This candi-date gene is located between ORS1152_1 and ORS391 markers. Homogentisic acid (HGA), the com-mon precursor to tocopherols (Valentin et al., 2006), can originate either via the conversion of chorismate to prephenate and then to p-hydroxyphenylpyruvate (HPP) via prephenate dehy-drogenase in bacteria or via the synthesis and conversion of the intermediates arogenate, tyrosine, by the shikimate pathway, and HPP in plants. HPP is then converted to HGA by HPPD (Norris et al., 1998). The interdependence between the amount of tocopherol and lipid peroxidation has also been recognized (Munné-Bosch, 2005). In plants, the protection of photosynthetic apparatus and polyunsaturated fatty acids from oxidative damage caused by reactive oxygen species (ROS) are the main function of tocopherol (Trebst et al., 2002; Velasco et al., 2004; Cela et al., 2009; Semchuk et al., 2009). Under late-sowing condition, a specific QTL of PAC on linkage group 6 (PAC-LS.6) is located between ORS1233 and SSL66_1 markers (Figure 2). Overlapping occurs for QTLs of PAC and SAC on linkage groups 2, 8, and 14. This can be explained by correlation between PAC and
SAC as well as by a specific gene for fatty acid synthetase II (FACII), which lengthens palmitic acid (16:0) by two carbon atoms to produce stearic acid (18:0) (Cantisán et al., 2000; Pleite et al., 2006). In previous studies, several overlapped QTLs of PAC and SAC are reported (Burke et al., 2005; Ebrahimi et al., 2008). Overlapping also occurs for QTLs of SAC and OAC on linkage groups 1, 2, and 14. This can be explained by the existence of specific gene for 9-desaturase (stearoyl-ACP desaturase), which catalyses the first desaturation of stearic acid (18:0) to oleic acid (18:1) (Heppard et al., 1996; Cantisán et al., 2000. We detected overlapped QTLs for SAC and OAC under late-sowing condition on linkage group 1 (SAC-LS.1 and OAC-(SAC-LS.1). This chromosomic region is reported for days from sowing to flowering (Poormohammad et al., 2009). A significant negative correlation between days to flowering and seed-oil content in areas with short growing season was reported by Leon et al. (2003). They also detected two overlapped QTLs for seed oil content and days to flowering. Common QTLs of SAC on linkage group 10 (SAC-WI.10 and SAC-LS.10) and linkage group 14 (SAC-WI.14, SAC-PI.14 and SAC-LS.14) are identified. A specific QTL of SAC is detected on linkage group 5 which is linked to HA3627 marker. Common QTLs of OAC are observed on linkage group 2 (OAC-PI.2
and OAC-LS.2) which overlap with QTLs controlling PAC and SAC. The high negative correlation (Table 3) between OAC and LAC in all conditions is justified by the opposite additive effects of their linked QTLs (Table 4; Figure 1). Another overlapping for QTLs of OAC and LAC is observed on linkage groups 10, 11 and 16.This can be explained by correlation between OA and LA as well as by a specific gene for 12-desaturase (oleoyl-PC desa-turase), which catalyses the second desaturation of oleic acid (18:1) to linoleic acid (18:2) (Garcés and Mancha, 1991). Regarding identified QTLs for SAC, OAC and LAC on linkage group 14 between ORS1152_1 and ORS 391 markers, we can consider this overlapping as a chromosomic region that controls two pathways, FatA (stearoyl-ACP desaturase) and FatB (acyl-ACP thioe-sterase), in sunflower (Pleite et al., 2006).
In conclusion, we have detected several specific and non specific QTLs under well-, partial-irrigated and late-sowing conditions for PSP, PSO, PAC, SAC, OAC and LAC. Detection of QTLs influencing various traits could increase the efficiency of marker-assisted selection and increase genetic progress. The relatively low number of RILs used in current research may have a negative influence on the accuracy of the calculated QTL effects and the ability to detect QTLs with small effects and R2 overestimation (Bachlava et al., 2008; Beavis, 1994). This was, to some degree, compensated by the higher precision of the phenotyping and the use of our map including candidate genes. The absence of significant difference between the mean of RILs and the mean of parents (Table 3) shows also that RILs used in our study can present all possible genetic combination from two
parents for the studied traits. Coincidence of the position for some detected QTLs and candidate genes would be useful for the function of the respective genes in the fatty acid pathway and its stability.
ACKNOWLEDGEMENTS
This research was support by Gundishapur project No. 12267RD. The authors wish to thank the French and Iranian governments for providing fellowship for PhD program to Parham Haddadi.
Abbreviations
QTL, Quantitative trait locus; CIM, composite interval mapping; RIL, recombinant inbred line; MRILs, mean of RILs; MP, mean of their parents; NIRS, near-infrared
reflectance spectrometry; HPPD,
p-hydroxyphenylpyruvate dioxygenase; EST, expressed sequence tags; HPP, p-hydroxyphenylpyruvate; HGA,
homogentisic acid SSR, simple sequence repeats; PSP,
percentage of seed protein; PSO, percentage of seed oil;
PAC, palmitic acid content; SAC, stearic acid content;
OAC, oleic acid content; LAC, linoleic acid content;
RFLP, restriction fragment length polymorphism; AFLP,
amplified fragment length polymorphisms. REFERENCES
Bachlava E, Dewey RE, Auclair J, Wang S, Burton JW, Cardinal AJ (2008). Mapping genes encoding microsomal -6 desaturase enzymes and their cosegregation with QTL affecting oleate content in soybean, Crop Sci. 48(2): 640-650.
Baldini M, Giovanardi R, Tahmasebi-Enferadi S, Vannozzi GP (2002). Effects of water regime on fatty acid accumulation and final fatty acid composition in the oil of standard and high oleic sunflower hybrids. Ital. J. Agron. 16(2): 119-126.
Basten CJ, Weir BS, Zeng ZB (2002). QTL Cartographer version 1.16, Programme in Statistical Genetics, Department of statistics, North Carolina State University.
Beavis WD (1994). The power and deceit of QTL experiments: Lessons from comparative QTL studies. In D.B. Wilkinson (ed.) Annu. Corn and Sorghum Res. Conf., 49th, Chicago, IL. Am. Seed Trade Assoc. Alexandria, VA. pp. 250-266.
Berry ST, Leon AJ, Hanfrey CC, Challis P, Burkolz A, Barnes SR, Rufener GK, Lee M, Caligari PDS (1995). Molecular-marker analysis
of Helianthus annuus L. 2. Construction of an RFLP map for
cultivated sunflower. Theor. Appl. Genet. 91(2): 195-199.
Biskupek-Korell B, Moschner CR (2007). Near-Infrared Spectroscopy (NIRS) for quality assurance in breeding, cultivation and marketing of high-oleic sunflowers, 29(45): 73-80.
Browse J, Slack R (1983). The effect of temperature and oxygen on the rates of fatty acid synthesis and oleate desaturation in safflower
(Carthamus tinetorius) seed. Biochim. Biophys. Acta, 753: 145-152.
Burke JM, Knapp SJ, Rieseberg LH (2005). Genetic consequences of selection during the evolution of cultivated sunflower. Genetics, 171(4): 1933-1940.
Cantisán S, Martínez-Force E, Garcés R (2000). Enzymatic studies of high stearic acid sunflower seed mutants. Plant Physiol. Biochem. 38: 377-382.
Cela J, Falk J, Munné-Bosch S (2009). Ethylene signaling may be
Haddadi et al. 6781
involved in the regulation of tocopherol biosynthesis in Arabidopsis
thaliana. FEBS Lett. 583(6): 992-996.
Collakova E, DellaPenna D (2003). The role of homogentisate phytyltransferase and other tocopherol pathway enzymes in the regulation of tocopherol synthesis during abiotic Stress. Plant Physiol.133(2): 930-940.
Dorrel DG, Vick BA (1997). Properties and processing of oilseed sunflower. In: Schneiter AA (ed.), Sunflower Production and Technology. ASA, CSSA and SSSA, Madison. Agron. Monogr. 35: 709-746.
Dwivedi SL, Nigam SN, Rao RCN, Singh U, Rao KVS (1996). Effect of drought on oil, fatty acids and protein contents of groundnut (Arachis
hypogaea L.) seeds. Field Crops Res. 48(2-3): 25-133.
Ebrahimi A, Maury P, Berger M, Poormohammad Kiani S, Nabipour A, Shariati F, Grieu P, Sarrafi A (2008). QTL mapping of seed-quality traits in sunflower recombinant inbred lines under different water regimes. Genome, 51(8): 599-615.
Ebrahimi A, Maury P, Berger M, Calmon A, Grieu P, Sarrafi A (2009). QTL mapping of protein content and seed characteristics under water-stress conditions in sunflower. Genome, 52(5): 419-430. Fernández-Martínez J, Jimenez A, Dominguez J, Garcia JM, Garces R,
Mancha M (1989). Genetic analysis of the high oleic acid content in cultivated sunflower (Helianthus annuus L.). Euphytica, 41: 39-51. Flagella Z, Rotunno T, Tarantino E, Caterina RD, Caro AD (2002).
Changes in seed yield and oil fatty acid composition of high oleic sunflower (Helianthus annuus L.) hybrids in relation to the sowing date and the water regime. Eur. J. Agron. 17: 221-230.
Flores Berrios E, Gentzbittel L, Kayyal N, Alibert G, Sarrafi A (2000). AFLP mapping of QTLs for in vitro organogenesis traits using recombinant inbred lines in sunflower (Helianthus annuus L.). Theor. Appl. Genet. 101: 1299-1306.
Garcés R, Mancha M (1991) In vitro oleate desaturase in developing sunflower seeds. Phytochemistry, 30(7): 2127-2130.
Gedil MA, Berry SK, Jones R, Leon A, Wye C, Peleman J, Knapp SJ (2001). An integrated RFLP-AFLP linkage map for cultivated sunflower. Genome, 44: 213-221.
Gentzbittel L, Vear F, Zhang Y, Bervillé A, Nicolas P (1995). Development of a consensus linkage RFLP map of cultivated sunflower (Helianthus annuus L.). Theor. Appl. Genet. 90: 1079-1086.
Heppard EP, Kinney AJ, Stecca KL, Miao GH (1996). Developmental and growth temperature regulation of two different microsomal -6 desaturase genes in soybeans. Plant Physiol. 110: 311-319.
Hervé D, Fabre F, Berrios EF, Leroux N, Al Chaarani G, Planchon C, Sarrafi A, Gentzbittel L (2001). QTL analysis of photosynthesis and water status traits in sunflower (Helianthus annuus L.) under greenhouse conditions. J. Exp. Bot. 52 (362): 1857-1864.
Kanwischer M, Porfirova S, Bergmuller E, Dörmann P (2005). Alterations in tocopherol cyclase activity in transgenic and mutant plants of arabidopsis affect tocopherol content, tocopherol composition, and oxidative stress. Plant Physiol. 137(2): 713-723. Lacombe S, Berville A (2001). A dominant mutation for high oleic acid
content in sunflower (Helianthus annuus L.) seed oil is genetically linked to a single oleate-desaturase RFLP locus. Mol. Breed. 8: 129-137.
Lagravère T, Kleiber D, Surel O, Calmon A, Berville A, Daydé J (2004). Comparison of fatty acid metabolism of two oleic and one conventional sunflower hybrids: a new hypothesis. J. Agron. Crop Sci. 190(4): 223-229.
Lee SH, Bailey MA, Mian MAR, Carter TE, Shipe ER, Ashley DA, Parrott WA, Hussey RS, Boerma HR (1996). RFLP loci associated with soybean seed protein and oil content across populations and locations. Theor. Appl. Genet.93: 649-657.
Leon AJ, Andradeb FH, Lee M (2003). Genetic analysis of seed-oil concentration across generations and environments in sunflower. Crop Sci. 43: 135-140.
Mahmood T, Rahman M, Stringam G, Yeh F, Good A (2006). Identification of quantitative trait loci (QTL) for oil and protein contents and their relationships with other seed quality traits in Brassica
juncea. Theor. Appl. Genet. 113: 1211-1220.
Martínez-Rivas JM, Sperling P, Lühs W, Heinz E (2001). Spatial and temporal regulation of three different microsomal oleate desaturase
genes (FAD2) from normal-type and high-oleic varieties of sunflower
(Helianthus annuus L.). Mol. Breed. 8: 159-168.
Marwede V, Gul MK, Becker HC, Ecke W (2005). Mapping of QTL controlling tocopherol content in winter oilseed rape. Plant Breed. 124(1): 20-26.
Mokrani L, Gentzbittel L, Azanza F, Fitamant L, Al-Chaarani G, Sarrafi A (2002). Mapping and analysis of quantitative trait loci for grain oil content and agronomic traits using AFLP and SSR in sunflower (Helianthus annuus L.). Theor. Appl. Genet. 106: 149-156. Möllers C, Schierholt A (2002). Genetic variation of palmitate and oil
content in a winter oilseed rape doubled haploid population segregating for oleate content. Crop Sci. 42(2): 379-384.
Munné-Bosch S, Alegre L (2002). Plant aging increases oxidative stress in chloroplasts. Planta, 214(4): 608-615.
Munné-Bosch S (2005). The role of alpha-tocopherol in plant stress tolerance. J. Plant Physiol. 162: 743-748.
Muriel JL, Downes RW (1974). Effects of periods of moisture stress during various phases of growth of sunflower in the greenhouse. In
Proceedings of the 6th International Sunflower Conference, Bucharest, Romania, 22-24 July Edited by A.V. Vranceanu. ISA Bucharest, Romania. pp. 127-131.
Neidleman SL (1987). Effects of temperature on lipid unsaturation. Biotechnol. Genet. Eng. Rev. 5: 245-268.
Nel AA, Loubser HL, Hammes PS (2002). Development and validation of relationships between sunflower seed quality and easily measurable seed characteristics for grading purposes. S. Afr. J. Plant Soil, 19: 201-205.
Norris SR, Shen X, Della Penna D (1998). Complementation of the arabidopsis pds1 mutation with the gene encoding p-hydroxyphenylpyruvate dioxygenase. Plant Physiol. 117: 1317-1323. Ozturk A, Aydin F (2004). Effect of water stress at various growth
stages on some quality characteristics of winter wheat. J. Agron. Crop Sci. 190: 93-99.
Pérez-Vich B, Velasco L, Fernández-Martínez J (1998). Determination of seed oil content and fatty acid composition in sunflower through the analysis of intact seeds, husked seeds, meal and oil by near-infrared reflectance spectroscopy. J. Am. Oil Chem. Soc. 75(5): 547-555.
Pérez-Vich B, Garcés R, Fernández-Martínez JM (2002a). Inheritance of high palmitic acid content in the sunflower mutant CAS-12 and its relationship with high oleic content. Plant Breed. 121(8): 49-56. Pérez-Vich B, Fernández-Martínez JM, Grondona M, Knapp SJ, Berry
ST (2002b). Stearoyl-ACP and oleoyl-PC desaturase genes cosegregate with quantitative trait loci underlying high stearic and high oleic acid mutant phenotypes in sunflower. Theor. Appl. Genet. 104(2-3): 338-349.
Pleite R, Martinez-Force E, Garces R (2006). Increase of the stearic acid content in high-oleic sunflower (Helianthus annuus) seeds. J. Agric. Food Chem. 54: 9383-9388.
Poormohammad Kiani S, Talia P, Maury P, Grieu P, Heinz R, Perrault A, Nishinakamasu V, Hopp E, Gentzbittel L, Paniego N, Sarrafi A (2007). Genetic analysis of plant water status and osmotic adjustment in recombinant inbred lines of sunflower under two water treatments. Plant Sci. 172(4): 773-787.
Poormohammad Kiani S, Maury P, Nouri L, Ykhlef N, Grieu P, Sarrafi A (2009) QTL analysis of yield-related traits in sunflower under different water treatments. Plant Breed. 128(4): 363-373.
SAS Institute Inc. (1996). SAS/STAT user’s guide, version 6, 4th ed.,
SAS Institute Inc., Cary, N.C. Vol. 1, 2.
Semchuk NM, Lushchak OV, Falk J, Krupinska K, Lushchak VI (2009). Inactivation of genes, encoding tocopherol biosynthetic pathway enzymes, results in oxidative stress in outdoor grown Arabidopsis
thaliana. Plant Physiol. Biochem. 47: 384-390.
Talha M, Osman F (1974). Effect of soil water stress on water economy and oil composition in sunflower (Helianthus annuus L.). J. Agric. Sci. Cambridge, 84: 49-56.
Tang S, Yu JK, Slabaugh MB, Shintani DK, Knapp SJ (2002). Simple sequence repeat map of the sunflower genome. Theor. Appl. Genet. 105: 1124-1136.
Tang S, Leon A, Bridges WC, Knapp SJ (2006). Quantitative trait loci for genetically correlated seed traits are tightly linked to branching and pericarp pigment loci in sunflower. Crop Sci. 46: 721-734. Trebst A, Depka B, Holländer-Czytko H (2002). A specific role for
tocopherol and of chemical singlet oxygen quenchers in the maintenance of photosystem II structure and function in Chlamydomonas reinhardtii. FEBS Lett. 516(5): 156-160.
Trémoliéres A, Dubacq JP, Drapier D (1982). Unsaturated fatty acids in maturing seeds of sunflower and rape: Regulation by temperature and light intensity. Phytochemistry, 21: 41-45.
Thompson GAJ (1993). Response of lipid metabolism to developmental change and environmental perturbation. In Moore Jr. TS ed, Lipid Metabolism in Plants. CRC Press, Boca Raton, FL, pp. 591-619. Valentin HE, Lincoln K, Moshiri F, Jensen PK, Qi Q, Venkatesh TV,
Karunanandaa B, Baszis SR, Norris SR, Savidge B, Gruys KJ, Last RL (2006). The Arabidopsis vitamin E pathway gene5-1 Mutant Reveals a Critical Role for Phytol Kinase in Seed Tocopherol Biosynthesis. Plant Cell, 18(1): 212-224.
Velasco L, Becker HC (1998). Estimating the fatty acid composition of the oil in intact-seed rapeseed (Brassica napus L.) by nearinfrared reflectance spectroscopy. Euphytica, 101: 221-230.
Velasco L, Pérez-Vich B, Fernández-Martínez JM (2004). Development of sunflower germplasm with high delta-tocopherol content. Helia, 27(40): 99-106.
Wang S, Basten CJ, Zeng ZB (2005). Windows QTL Cartographer V2.5. Department of Statistics, North Carolina State University, Raleigh, N.C. Available from http://statgen.ncsu.edu/ qtlcart/WQTLCart.htm. Zhao J, Becker H, Zhang D, Zhang Y, Ecke W (2006). Conditional QTL
mapping of oil content in rapeseed with respect to protein content and traits related to plant development and grain yield. Theor. Appl. Genet. 113: 33-38.