HAL Id: hal-01672105
https://hal.archives-ouvertes.fr/hal-01672105v2
Submitted on 11 Jan 2018
HAL is a multi-disciplinary open access
archive for the deposit and dissemination of
sci-entific research documents, whether they are
pub-lished or not. The documents may come from
teaching and research institutions in France or
abroad, or from public or private research centers.
L’archive ouverte pluridisciplinaire HAL, est
destinée au dépôt et à la diffusion de documents
scientifiques de niveau recherche, publiés ou non,
émanant des établissements d’enseignement et de
recherche français ou étrangers, des laboratoires
publics ou privés.
epileptogenic tissues than spikes
Nicolas Roehri, Francesca Pizzo, Stanislas Lagarde, Isabelle Lambert, Anca
Nica, Aileen Mcgonigal, Bernard Giusiano, Fabrice Bartolomei,
Christian-George Bénar
To cite this version:
Nicolas Roehri, Francesca Pizzo, Stanislas Lagarde, Isabelle Lambert, Anca Nica, et al..
High-frequency oscillations are not better biomarkers of epileptogenic tissues than spikes. Annals of
Neu-rology, Wiley, In press, �10.1002/ana.25124�. �hal-01672105v2�
tissues than spikes
Nicolas Roehri, Eng,
1Francesca Pizzo, MD,
1Stanislas Lagarde, MD,
1,2Isabelle Lambert, MD,
1,2Anca Nica, MD,
3Aileen McGonigal, MD,
1,2Bernard Giusiano, MD,
1,4Fabrice Bartolomei*, MD,
1,2and Christian-George Bénar*°, PhD.
11. Aix Marseille Univ, Inserm, INS, Institut de Neurosciences des Systèmes, Marseille, France 2. APHM, Timone Hospital, Clinical Neurophysiology, Marseille, France
3. CHU Rennes, Neurology, Rennes, France 4. APHM, Public Health Department, Marseille, France
*equally contributing authors °corresponding authors: [email protected]
Abstract
Objective: High-frequency oscillations (HFOs) in intracerebral EEG (stereoencephalography,
SEEG) are considered as better biomarkers of epileptogenic tissues than spikes. How this can be applied at the patient level remains poorly understood. We investigated how well the HFOs and the spikes can predict epileptogenic regions with a large spatial sampling at the patient level.
Methods: We analyzed non-REM sleep SEEG recordings sampled at 2048 Hz of thirty patients.
Ripples (R, 80-250 Hz), fast ripples (FR, 250-500 Hz) and spikes were automatically detected. Rates of these markers and several combinations – spikes co-occurring with HFOs or FRs and cross rate (Spk ⊗ HFO) – were compared to a quantified measure of the seizure onset zone (SOZ) by performing a receiver operating characteristic analysis for each patient individually. We used a Wilcoxon sign rank test corrected for false-discovery rate to assess whether a marker was better than the others for predicting the SOZ.
Results: A total of 2930 channels was analyzed (median of 100 channels per patient). The
HFOs or any of its variants were not statistically better than spikes. Only one feature, the cross-rate was better than all the other markers. Moreover, fast ripples, even though very specific, did not delineate all epileptogenic tissues.
Interpretation: At the patient level, the performance of the HFOs is weakened by the presence
of strong physiological HFO generators. Fast ripples are not sensitive enough to be the unique biomarker of epileptogenicity. Nevertheless, combining HFOs and spikes using our proposed measure –the cross rate– is a better strategy than using only one marker.
This article has been accepted for publication and undergone full peer review but this current version is the author version which may lead to differences between this version and the Version of Record. Please cite this article as an ‘Accepted Article’, doi: 10.1002/ana.25124
1
Introduction
During presurgical examination of patients with drug-resistant epilepsies, clinicians face the difficult task of defining the epileptogenic zone (EZ), i.e. the subset of brain regions involved in generating seizures [1,2,3]. The ictal period is the privileged moment to delineate the EZ based on the regions involved at seizure onset. However, the non-negligible rate of failure in epilepsy surgery [4] has led to search for other electrophysiolog-ical criteria to delineate the EZ. On the one hand, methods have been proposed to better quantify cerebral activity at the onset of the seizure [5,6]. On the other hand, renewed interest has been given to the interictal period in order to find putative biomarkers of epileptogenicity.
For the past decade, research on electrophysiological biomarkers has been fueled by the discovery of interictal high-frequency oscillations (HFOs, 80-500 Hz) [7,8]. These brief and small oscillations visible on intracranial EEG (iEEG) are considered strongly bound to the seizure onset zone (SOZ) [9,10] and to cor-relate with surgical outcome [11,12,13]. They are regarded as being more focal and specific than classical epileptic spikes (Spk) [9,11,14]. Indeed, interictal spikes are only partially concordant with the EZ, often found outside the EZ and thus lack specificity [15]. However, not all HFOs are pathological. Even though fast ripples (FR, 250-500 Hz) seem to be always pathological [16], ripples (R, 80-250 Hz) are involved in physiological processes such as memory consolidation in the hippocampus [17,18].
Most previous studies have drawn conclusions about HFOs at the group level. Indeed, the HFO rate is higher inside than outside the EZ when analyzing an entire group of patients, but this cannot be readily verified at the patient level due to the heterogeneity of patients (e.g. type of epilepsy, implantation sites, age) and to the presence of physiological HFO generators. It is therefore relevant to confront HFOs and spikes not only in epileptogenic areas but also in remote areas to better describe the extent of the zones defined by each marker, at the patient level. Because visual marking of HFOs is tedious, time-consuming, and results in a low inter-rater agreement [16,19], most articles comparing HFOs and spikes have studied few channels per patient. With the emergence of automated HFO detectors, the number of studied channels per patient increased but, since existing detectors were not designed to detect both HFOs and spikes, information about spikes were lost [10,20,21].
We designed the present study to investigate the spatial extent of each marker at the individual patient level. We prospectively analyzed thirty patients with large spatial sampling from intracerebral SEEG elec-trodes (median number of contacts studied by patient was 100.5) and various type of focal epilepsies. We estimated the EZ using a quantitative method (Epileptogenicity Index [5]), and applied an automatic detec-tion technique for both HFOs and spikes [22,23]) on all channels. We computed several interictal markers (spikes; gamma oscillations (40-80 Hz), HFOs (80-500 Hz), Rs (80-250 Hz), FRs (250-500 Hz); HFOs co-occurring with spikes, FRs co-co-occurring with spikes, Spk ⊗ HFO). We then compared the performance of these interictal markers to delineate the EZ at the individual patient level.
2
Methods
2.1
Patient Selection
We studied forty all consecutive patients who had underwent stereoelectroencephalography (SEEG) explo-ration at 2048 Hz. Recordings were performed between May 2014 and January 2017, during pre-surgical evaluation of drug-resistant epilepsy. Before SEEG, a detailed evaluation was performed for each patient, including medical history, neurologic examination, neuropsychological assessment, scalp EEG recording, cerebral magnetic resonance imaging (MRI) and positron emission tomography (PET). As part of patients’ usual clinical care, SEEG was carried out after the noninvasive phase. Recordings were performed using in-tracerebral macroelectrodes (10–15 contacts, length of the contact: 2 mm, diameter: 0.8 mm, 1.5 mm apart) placed according to Talairach’s stereotactic method.
Since we aimed at comparing the fast oscillations and the spikes to the EZ, we selected patients fulfilling the following criteria: spontaneous seizures recorded with well-defined seizure onset, and without major artifact on the interictal recording (i.e. without high frequency noise nor saturation). Ten patients did not fulfill these criteria and were discarded; thirty patients were thus included for the rest of the study. From these patients, ten were operated upon, six are awaiting surgery or surgical decision, and the others (fourteen) were contraindicated (because of EZ overlapping with functional areas, too wide or multifocal). Therefore, the surgical outcome is available for only ten patients. This relatively low number of patients operated is in line with a recent study [24]. Table1provides clinical information about the selected patients. Brain surface meshes were made with Freesurfer [25]. The electrode segmentation was done on a home-made software GARDEL [26].
The institutional review board of the French Institute of Health (IRB15226) approved this study and patient’s consent was obtained.
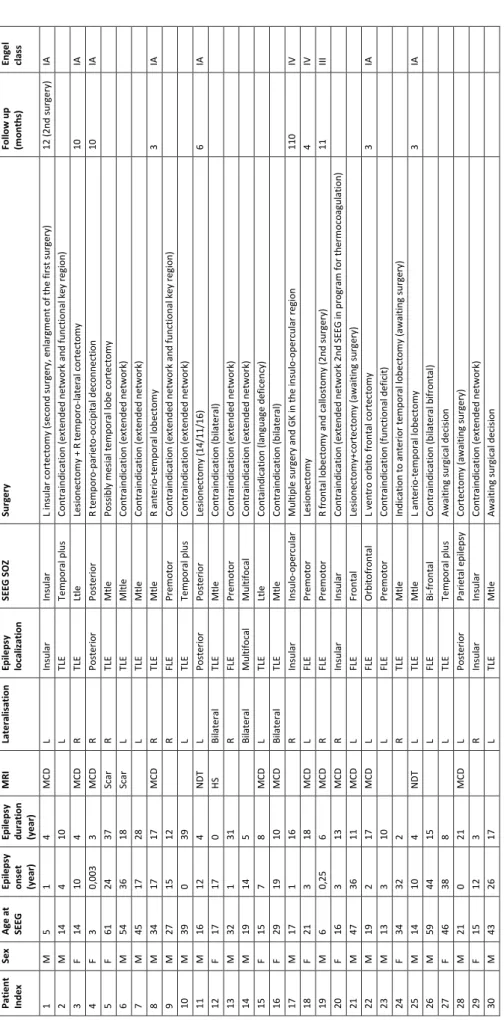
TLE: T em po ral L o be Epi le ps y, FLE : Fr o nt al L o be Epi le ps y, LT LE: L at er al T LE , M TLE: M edi al T LE; M es ial -La te ral T LE M C D : m al fo rm at io n o f c o rt ic al de ve lo pm ent , NDT : n eur o de ve lo pm ent al t u m o rs , HS : hi pp o cam pu s sc le ro si s. P at ie nt Inde x Sex A ge a t SE EG Epi le ps y ons e t (y e ar ) Epi le ps y dur at ion (y e ar ) M R I Lat e ral is at ion Epi le ps y local iz at ion SE EG S O Z Sur ge ry Fol low up (m ont h s) Eng e l cl ass 1 M 5 1 4 M C D L Ins ul ar Ins ul ar L ins ul ar c o rt ec to m y ( se co nd s u rg er y, e nl ar gm ent o f t he f ir st s ur ge ry ) 12 ( 2nd s ur ge ry ) IA 2 M 14 4 10 L TLE Te m po ral p lus C o nt rai nd ic at io n (e xt end ed ne two rk an d fun ct io na l k ey r eg io n) 3 F 14 10 4 M C D R TLE Lt le Le si o ne ct o m y + R t em po ro -l at er al c o rt ec to m y 10 IA 4 F 3 0, 003 3 M C D R P o st er io r P o st er io r R te m po ro -pa ri et o -o cc ipi tal d ec o nn e ct io n 10 IA 5 F 61 24 37 Sc ar R TLE M tl e P o ss ibl y m esi al t em po ral lo be c o rt ec to m y 6 M 54 36 18 Sc ar L TLE M lt le C o nt rai nd ic at io n (e xt end ed ne two rk ) 7 M 45 17 28 L TLE M tl e C o nt rai nd ic at io n (e xt end ed ne two rk ) 8 M 34 17 17 M C D R TLE M tl e R a nt er io -t em po ral lo be ct o m y 3 IA 9 M 27 15 12 R FLE P re m o to r C o nt rai nd ic at io n (e xt end ed ne two rk an d fun ct io na l k ey r eg io n) 10 M 39 0 39 L TLE Te m po ral p lus C o nt rai nd ic at io n (e xt end ed ne two rk ) 11 M 16 12 4 NDT L P o st er io r P o st er io r Le si o ne ct o m y ( 14/1 1/16 ) 6 IA 12 F 17 17 0 HS B ilat e ral TLE M tl e C o nt rai nd ic at io n (bi lat er al ) 13 M 32 1 31 R FLE P re m o to r C o nt rai nd ic at io n (e xt end ed ne two rk ) 14 M 19 14 5 B ilat e ral M ul ti fo cal M ul ti fo cal C o nt rai nd ic at io n (e xt end ed ne two rk ) 15 F 15 7 8 M C D L TLE Lt le C o nt ai nd ic at io n (l an gua ge d ef ic en cy ) 16 F 29 19 10 M C D B ilat e ral TLE M tl e C o nt rai nd ic at io n (bi lat er al ) 17 M 17 1 16 R Ins ul ar Ins ul o -o pe rc ul ar M ul ti pl e s ur ge ry a nd G K i n the ins u lo -o pe rc ul ar r eg io n 110 IV 18 F 21 3 18 M C D L FLE P re m o to r Le si o ne ct o m y 4 IV 19 M 6 0, 25 6 M C D R FLE P re m o to r R f ro nt al lo be ct o m y a nd c al lo st o m y ( 2nd s ur ge ry ) 11 III 20 F 16 3 13 M C D R Ins ul ar Ins ul ar C o nt rai nd ic at io n (e xt end ed ne two rk 2nd SE EG in pr o gr am f o r t he rm o co ag ul at io n) 21 M 47 36 11 M C D L FLE Fr o nt al Le si o ne ct o m y+ co rt e ct o m y ( awai ti ng su rg er y) 22 M 19 2 17 M C D L FLE O rbi to fr o nt al L ve nt ro o rbi to f ro n tal c o rt ec to m y 3 IA 23 M 13 3 10 L FLE P re m o to r C o nt rai nd ic at io n (f un ct io na l d ef ic it ) 24 F 34 32 2 R TLE M tl e Ind ic at io n to a nt er io r te m po ral lo be ct o m y (awai ti ng s ur ge ry ) 25 M 14 10 4 NDT L TLE M tl e L an te ri o -t em po ral lo be ct o m y 3 IA 26 M 59 44 15 L FLE Bi -f ro nt al C o nt rai nd ic at io n (bi lat er al b if ro nt al ) 27 F 46 38 8 L TLE Te m po ral p lus A wai ti ng s ur gi cal de ci si o n 28 M 21 0 21 M C D L P o st er io r P ar ie tal e pi le ps y C o rt ec to m y ( awai ti ng s ur ge ry ) 29 F 15 12 3 R Ins ul ar Ins ul ar C o nt rai nd ic at io n (e xt end ed ne two rk ) 30 M 43 26 17 L TLE M tl e A wai ti ng s ur gi cal d ec isi o n
Table 1 – Patients’ characteristics
2.2
Recording methods
Signals were acquired on a 128 channel Deltamed™system. Ictal periods sampling rates ranged from 256 Hz up to 2048 Hz. The interictal sections were recorded during the night at a sampling frequency of 2048 Hz, at least 48 h after the day of implantation. All recordings were low-pass filtered at one third of their sampling frequency. We selected 5 minutes of non-REM sleep at stage N2 or N3 for detecting HFOs and spikes. N2 and N3 stages were defined by two neurologists (FP, IL) as sleep periods with clear presence of spindles or slow waves. This 5 minutes duration was shown to be sufficient to study HFO and spike rates even though these rates may vary over time [27]. The analysis was performed in a bipolar montage.
2.3
Mesial and lesional contact localization
Contacts in each selected brain area were labeled by two neurologists (FP, SL). We particularly focused on regions in the mesial temporal lobe (amygdala (Am), hippocampus (Hip) and mesial temporal pole (MTP)). The classification was done using a computed tomography (CT) scan obtained directly after SEEG implantation and an MRI obtained before implantation. Images were co-registered to the same space. The same procedure was used to label contacts in the lesion in patients with malformation of cortical development (MCD), neurodevelopmental tumors (NDT), hippocampus sclerosis (HS) or scar.
2.4
Quantification of the SOZ
Several seizures were studied for each patient. The SOZ was visually defined by two expert neurophysiolo-gists (FB, FP) for each seizure. It was defined as the group of channels that were involved at seizure onset for at least one seizure. We also calculated on each seizure the Epileptogenicity Index (EI) [5], a semi-automatic procedure that aims at quantifying the SOZ. The EI ranks brain structures according to the tonicity of the fast-discharge and the delay of involvement of the structure at seizure onset (Fig1A). Its values range from 0 to 1, with 1 corresponding to the most epileptogenic region. The EI method was shown to be relevant to quantify the epileptogenicity of brain structures [28,29]. To compute the EI, we used the plugin designed for the open-source software AnyWave [30], available at http://meg.univ-amu.fr. To have one EI value for each channel, we took the maximum EI of a given channel across seizures. Channels exhibiting EI values above 0.2-0.3 are said to be epileptogenic [5, 15,31,32,33]. We set the cutoff at 0.25 in order to have a median correspondence per patients between the EIZ and the SOZ of approximately 50%. The binarized EI gives the Epileptogenicity Index Zone (EIZ), which is an estimation of the extent of the EZ. We ensured that the EIZ was included in the visually defined SOZ.
The definition of the EZ used in the current study is different from the one of Lüders: “the minimum amount of cortex that must be resected (inactivated or completely disconnected) to produce seizure free-dom” [34]. We used the Bancaud and Talairach view on the EZ which is the site of the beginning and of the primary organization of the seizure [1, 2,3] (independently of the potential surgery). Notably, both definitions are theoretical since the minimum amount is not known for the former and the outcome is not available for the latter (the localization of the EZ is less certain but it permits however to study contraindi-cated patients).
2.5
Automated detection
HFOs and spikes were automatically detected in AnyWave using Delphos (Detector of ElectroPhysiolog-ical Oscillations and Spikes) [22]. Delphos was designed to solve the “false-ripple” issue due to filtering artifacts [35] and to optimize the signal to noise ratio at each frequency. It does so by detecting events of interest above a threshold in the ZH0-normalized time-frequency (TF) image [22] and by measuring the
time width and frequency spread of the detected islands (Fig1B). The algorithm classifies the detections as “oscillation” or “spike” according to the two aforementioned measures. Moreover, this method allows us to detect events occurring simultaneously and to give a frequency label to the detected oscillations. This detector was tested against a benchmark of realistic simulations [23]. These simulations were obtained by inserting visually marked HFOs and spikes from three patients (from the current pool) into the simulated background of their respective brain region (for more details see Methods of [23]). This allowed us to study the performance of the detection knowing the true occurrence of the HFOs and test the variability across different brain areas. Delphos showed constant high precision, i.e. the detections were almost always cor-rect, and the highest sensitivity compared to the 4 other detectors from the Ripplelab Toolbox [36]. Delphos showed less imbalance toward a class of HFO compared to the other detectors, i.e. it detects similarly well Rs and FRs, and robustness across brain regions and across variations in brain activities.
These characteristics enabled us to study oscillations in the Gamma (γ), HFO, R and FR bands as well as spikes. Moreover, we could study HFO or FR superimposed on spikes. Two events were defined as co-occurring if their detection times were separated by less than 100 mm. For each channel, we computed the rate per minute for every marker. We studied 8 markers: spikes, gamma oscillations, HFO, R, FR, spike co-occurring with HFOs (Spk-HFO), or with FRs (Spk-FR), and a combination of spikes and HFOs (Spk ⊗ HFO). Spk ⊗ HFO corresponds to the geometric mean of the spike and HFO rate obtained by
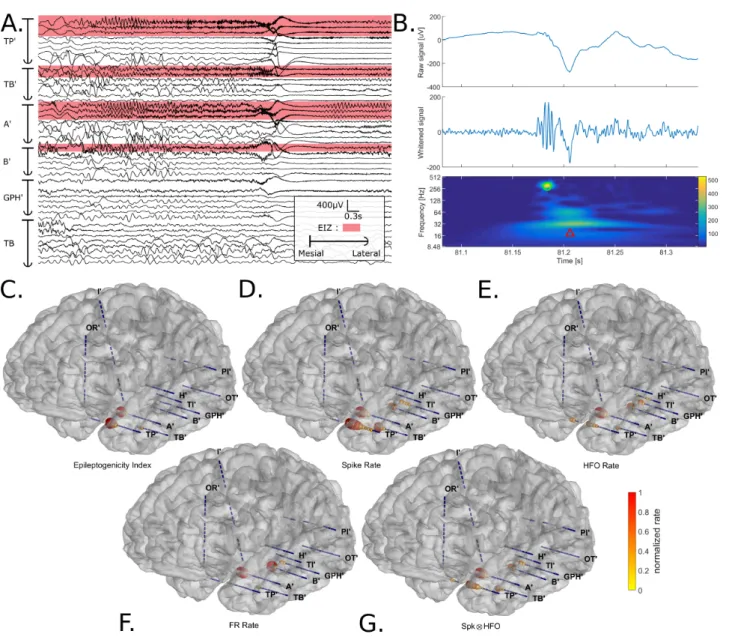
Figure 1 – Illustration of the analysis pipeline for Patient 30. (A) SEEG recording of a seizure in bipolar montage.
Electrode TP’ explored the temporal pole; TB’ was placed in the temporo-basal area (lateral contacts) and in the entorhinal cortex (mesial contacts); electrodes A’, B’ and, GPH’ targeted the amygdala, the hippocampus, and the parahippocampal gyrus respectively (mesial contacts) and recorded the middle temporal gyrus as well (lateral contacts). The apostrophe indicates the left hemisphere. The channels highlighted in red correspond to the channels exhibiting an EI value above 0.25. These channels form the Epileptogenicity Index Zone (EIZ) of the patient, which is an estimation of the Epileptogenic Zone. (B) Example of an interictal fast ripple riding an epileptic spike detected by Delphos. From top to bottom, the panels display the raw signal, the whitened signal and the normalized time-frequency image. The green circle represents a detected oscillation (here, a fast ripple) and the red triangle a detected spike. (C-G) Mapping of the different biomarkers in the patient’s brain surface. The sphere color and diameter correspond to either the Epileptogenicity Index or the normalized rate of the marker (ranging from 0 to 1). One can see that each marker seems to delineate the EIZ. The irritative zone is broad but the channels with the highest spike rate correspond well to the EIZ (TP’, TB’, A’, and B’ inner contacts). The HFO rate and FR rate seem to indicate more the amygdala and the hippocampus but have a lower rate in TP’ and TB’. Spk ⊗ HFO seems to be the best compromise in term of extent and precision.
calculating the square root of the product of the two rates; Spk × HFO = √spike rate × HFO rate. This measure permits us to explore another approach of combining the two markers, less restrictive than the co-occurrence. Before and after the detector was run, we visually verified for muscle artifact and high frequency noise and removed these sections if necessary.
2.6
Statistical Analysis
Statistical analyses were applied to assess how well the rates of the different markers can delineate the EIZ for each patient. The Receiver Operating Characteristic (ROC) framework [37] aims at computing the per-formance of binary classifiers (“EIZ” vs “no EIZ” based on event rates) across a range of thresholds. The
ROC curve is obtained by plotting the sensitivity (Sens), i.e. the proportion of correctly labeled epileptic channels, as a function of the specificity (Spe), i.e. the proportion of correctly labeled non-epileptic channels. To generate the ROC curve, we compared the EIZ to the rates of the different markers at several thresholds. Firstly, we calculated the ROC curve on the entire group of patients to represent the global behavior of the markers compared to epileptic regions. Plotting this curve reveals whether the markers span the whole ROC space, or if there is a plateau indicating a lack of specificity or sensitivity. Drawing further conclusions about their performance using this curve would be misleading [37]; a measure of variance (based on the patient) is needed to compare the markers.
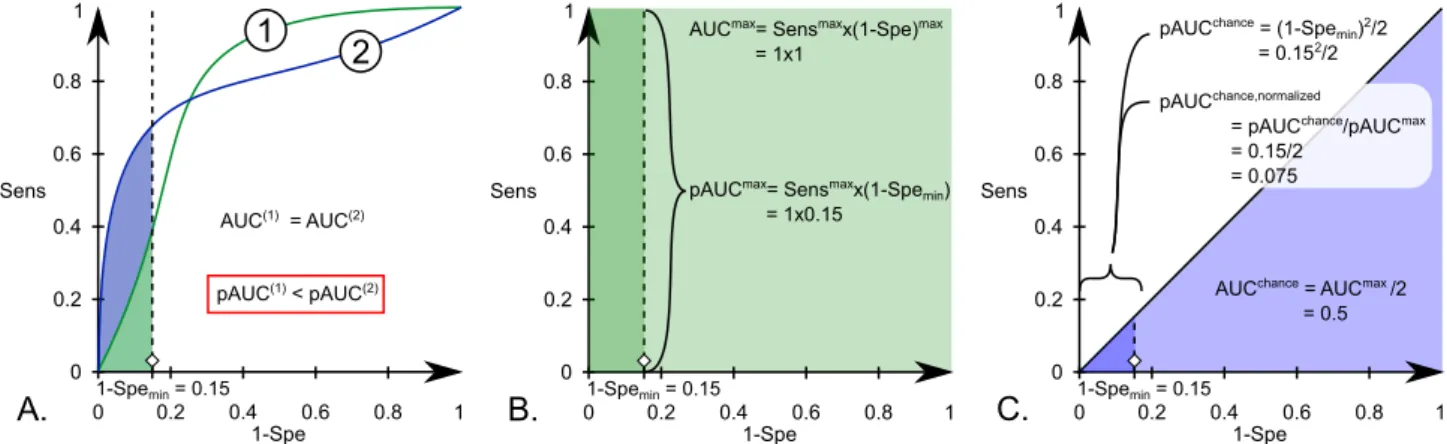
We studied their performance for each patient individually to determine whether a given marker was in general better than the others. We chose to study the ROC curve between 85% and 100% of speci-ficity. As a global performance measure, the partial Area Under the Curve of this ROC curve (pAUC) was used. The pAUC is especially useful when one can assume that the curves could cross [38] (spikes are said to be more sensitive than specific and inversely for the HFOs) and because the proportion of epileptic channels in our study is quite low compared to "normal" channels (298/2930) [37]. This is also justified in a clinical perspective, because it is more important to minimize the number of wrongly labeled normal channels (false positives). We divided the partial AUC pAUC value by the maximum possible value area (Sensmax× (1 − Spemin) = 1 × 0.15 = 0.15) to have an index ranging from 0 to 1. Normally, the AUC of
chance level is 0.5; here, it is 0.152/2 × 0.15 = 0.075 after normalization (considering the partial ROCcurve).
Figure 2illustrates the definition and transform of the pAUC. This thus yield one pAUC for each patient and each marker.
0 0.2 0.4 0.6 0.8 1 0 0.2 0.4 0.6 0.8 1 Sens 1-Spe 1-Spemin = 0.15
1
2
AUC(1) = AUC(2) pAUC(1) < pAUC(2)A.
0 0.2 0.4 0.6 0.8 1 0 0.2 0.4 0.6 0.8 1 Sens 1-Spe 1-Spemin = 0.15pAUCmax= Sensmaxx(1-Spe min)
= 1x0.15 AUCmax= Sensmaxx(1-Spe)max
= 1x1
B.
0 0.2 0.4 0.6 0.8 1 0 0.2 0.4 0.6 0.8 1 Sens 1-Spe 1-Spemin = 0.15pAUCchance = (1-Spe min)2/2
= 0.152/2
pAUCchance,normalized
= pAUCchance/pAUCmax
= 0.15/2 = 0.075
AUCchance = AUCmax /2
= 0.5
C.
Figure 2 – A. strength of the pAUC in the current context for crossing ROC curves; B. calculation of the maximal AUC
for the full and partial AUC; C. calculation of the AUC of chance level for the full and partial AUC.
We applied a Wilcoxon signed rank test (which is a paired test) to the pAUC of all pairs of markers across patients and corrected for multiple comparisons (False Discovery Rate [39] below 0.05 corrected for 28 comparisons). As these statistics approximates normal distribution for number of samples above 15, the p-values were transformed into z-values to capture the two-tailed test. In other words, a test is significant if |z| ≥ 2.63 after correction.
Secondly, we investigated the rates of some markers in mesial structures and lesions at the group and patient level. We studied channels inside the hippocampus (Hip), the amygdala (Am) and the lesions (Les) (all three are known to exhibit high rate of HFOs and spikes), and compared them to the rest of the channels, which corresponds to all the contacts which were not inside the aforementioned regions (Oth). For the group level analysis, the statistical significance was assessed by computing a Bonferroni corrected Mann-Whitney U test (p below 0.05 corrected for 24 comparisons).
3
Results
3.1
Patients’ characteristics
Thirty patients were studied; 11 women and 19 men. The median duration of epilepsy was 10.5 years [in-terquartile interval, IQ: 4.25-17 years]. There were 14 patients with TLE (8 MTLE, 3 temporal plus, 2 LTLE, 1 MLTLE), 8 with FLE, 4 insular epilepsies and 3 posterior epilepsies. The etiologies of the epilepsy were structural (12 MCDs, 2 NDT, 2 Scars (post-traumatic and post-encephalitis), 1 HS) and unknown (13 MRI negative patients).
The total number of analyzed channels was 2930 with a median number per patient of 100.5 [IQ 89-109]. From these channels, 298 were inside the EIZ. The median percentage per patient of channels inside both
the EIZ and the SOZ was 48.5% [32.1%-60%]. The median percentage per patient of channels with spikes outside the EIZ was 77.9% [69.4-83.3%]; for the HFOs it was 63.4% [48.8-74.3%]; for the FRs it was 13.7% [9.78-18.5%] and for channels outside the EIZ with HFO and Spk it was 60.7% [43.1-69.4%].
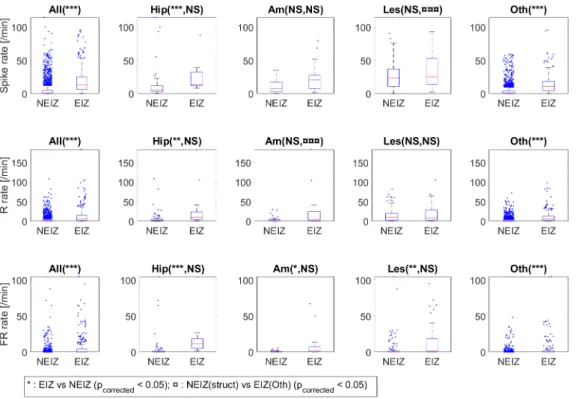
Figure 3 – Boxplots of the rate inside the EIZ or outside (NEIZ) in the whole brain and in specific structures. The
spike rate, ripple (R) rate and fast ripple (FR) rate are given in the first, second and last line respectively. The first to the fifth column correspond to the rate in the whole brain (All), the hippocampi (Hip), the amygdalae (Am), the lesions (Les) and in the rest of the brain excluding the previous regions (Oth). Two statistical tests were applied. The first one tested the difference in the rate inside the EIZ compared to the NEIZ within each group (e.g. All, Hip, Am) for each marker. The asterisk (*) shows the differences which were statistically significant after correction for 24 comparisons (*: corrected p-value ≤ 0.05, **: p ≤ 0.01, ***: p ≤ 0.001, NS: not significant). The second test investigates the differences between the rate outside the EIZ in the Hip, Am and Les compared to the rate inside the EIZ in the other regions (Oth). This symbol ¤ shows the differences which were statistically significant after correction for 24 comparisons (¤: corrected p-value ≤ 0.05, ¤¤: p ≤ 0.01, ¤¤¤: p ≤ 0.001, NS: not significant). The rate in the EIZ is higher than in the NEIZ in the whole brain and within each group for every marker except for the ripple and spike rate in the Am and Les. There are almost no statistical differences between the rate in the NEIZ of the Hip, Am, and Les and the rate inside the EIZ in the rest of the brain. The spike rate is higher in the NEIZ of the Les compared to the spike rate in the EIZ in Oth and the ripple rate is lower in the NEIZ of the Am compared to the ripple rate in the EIZ in Oth.
The first question was to determine whether the rates of the markers differed between inside and outside the Epileptogenic Index Zone (EIZ and NEIZ). The rates of spikes, ripples and fast ripples were all signifi-cantly higher (***) inside the EIZ than outside when taking all channels (Fig3). Similarly, the rates were higher (**) in the hippocampus inside the EIZ than in the hippocampus outside the EIZ. (NEIZ). The rest of channels (Oth), which were not in Hip, Am nor Les, also showed higher rates inside than outside the EIZ (***). This was also the case for the fast ripple rate in the Am (*) and the Les (**) but not for the spike and ripple rates.
The second test aims at showing whether the rates in the Hip, Am and Les outside the EIZ are different from the rates inside the EIZ in the other regions (Oth). Only two tests were significant (¤¤¤), i.e. the ripple rate in the amygdalae outside the EIZ and the spike rates in the lesion outside the EIZ (here the median was higher in the NEIZ lesion than in the rest of the epileptogenic regions). The fact that the ripple rate can be statistically significant between the Am (NEIZ) and the Oth (EIZ) but not between the Am (NEIZ) and the Am (EIZ) is likely because the variance of the rate in the Oth (EIZ) is smaller since there are many more channels in the Oth (EIZ) than in the Am (EIZ).
3.2
Markers vs. EIZ at group level
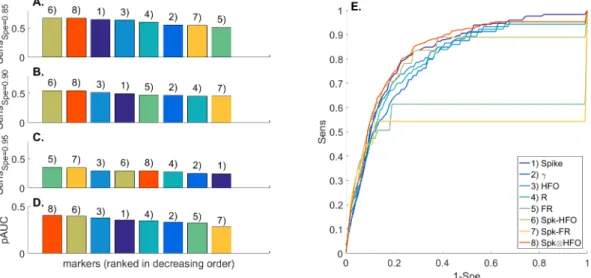
In this section, we evaluated how the markers globally behave in term of sensitivity and specificity when taking the whole group of patients (Fig4). The combinations of spikes and HFOs have higher sensitivity
for specificity below 90% and perform better globally (higher AUC, Fig 4 A,B,D). FR and Spk-FR have higher sensitivity at higher specificity (95%, Fig4C). The ROC curve (Fig4E) clearly shows a plateau for the FRs and Spk-FRs; this means that these events were not present in ≈35% and ≈45% of the epileptic channels respectively. A similar plateau can be observed for the Spk-HFO at ≈90% of sensitivity.
Figure 4 – ROC curve for the whole group of patients. (A-C) These panels give the sensitivity of each marker to
discriminate EIZ from NEIZ channels at given specificities (0.85, 0.90, and 0.95, respectively) for the whole group of patients. (D) The area under the curve calculated between 0.85 and 1 of specificity is drawn here (pAUC). (E) This panel plots the ROC curves for every marker. Note the plateau for the fast ripples and spikes with fast ripples.
3.3
Markers vs. EIZ at patient level
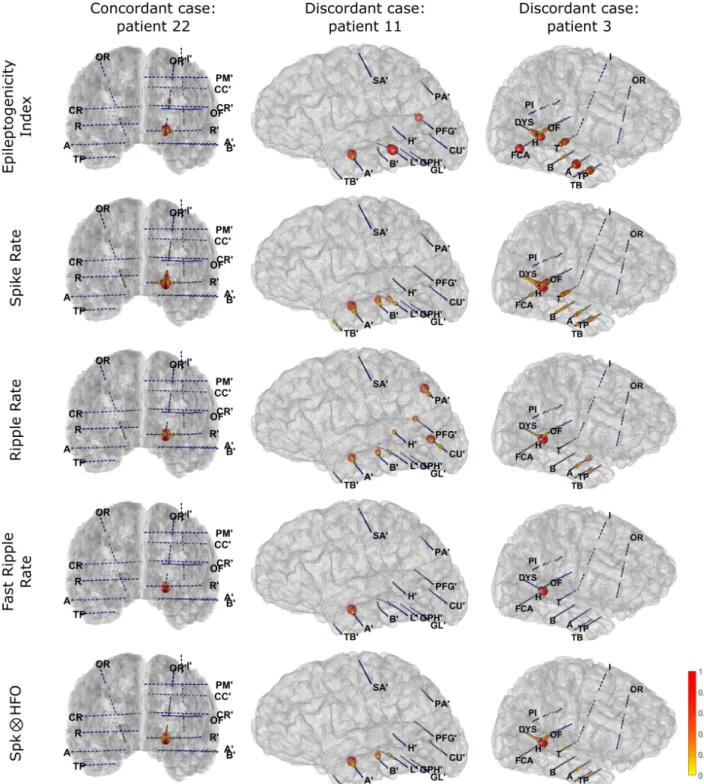
Figure5shows examples of different results. Patient 22 is a concordant case in whom each marker points to the orbitofrontal gyrus, in agreement with the EI values. For patient 11, the interictal markers only partially describe the EIZ. The spikes miss the inner contacts of PFG’ but are present in both the hippocampus (B’) and the temporo-basal electrode (TB’). The ripple rate is highest in the regions of the occipital and parietal lobe (CU’ and PA’ respectively). The fast-ripples are only present in the amygdala (A’) and are not seen in the electrode exploring the lesion (L’). Spk ⊗ HFO is low in the PFG’ electrode and still keeps a relative high value in the CU’ but is negligible in TB’ and PA’. For patient 3, spikes and ripples globally map the EIZ but are present in the hippocampus (B) electrode and the amygdala (A) respectively. Fast ripples are only detected in the dysplasia (DYS). Spk ⊗ HFO delineates well the EIZ by combining the ripple and spike map.
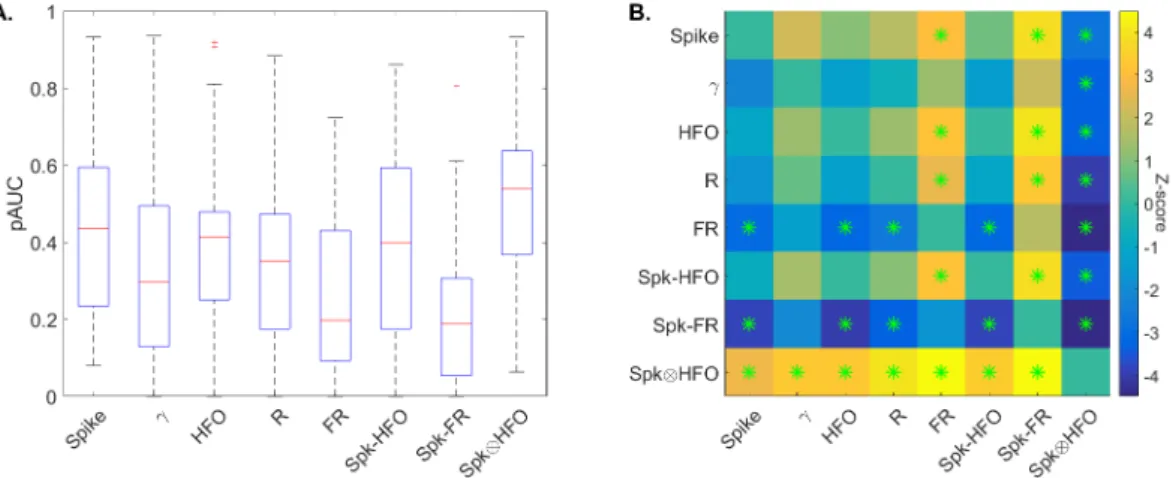
Here, the investigation concerns the comparison of the markers within each patient. Partial ROC curves were drawn for each patient individually between 85% and 100% of specificity and we calculated the pAUC (Fig 6 A). The box corresponding to the FRs and Spk-FR are the lowest. Only Spk ⊗ HFO stands out from other measures. The result of the statistical paired test (Fig6B) indicates that there is no statistical evidence showing that spikes, gamma oscillations, HFOs, Rs and Spk-HFO are generally different from one another. All markers are however better than the FRs and Spk-FR except gamma oscillations. One marker is better than all the others: Spk ⊗ HFO (illustrated by the complete yellow line with asterisks, p below 0.05 after FDR correction).
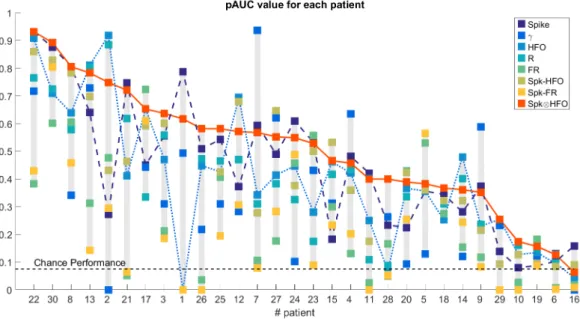
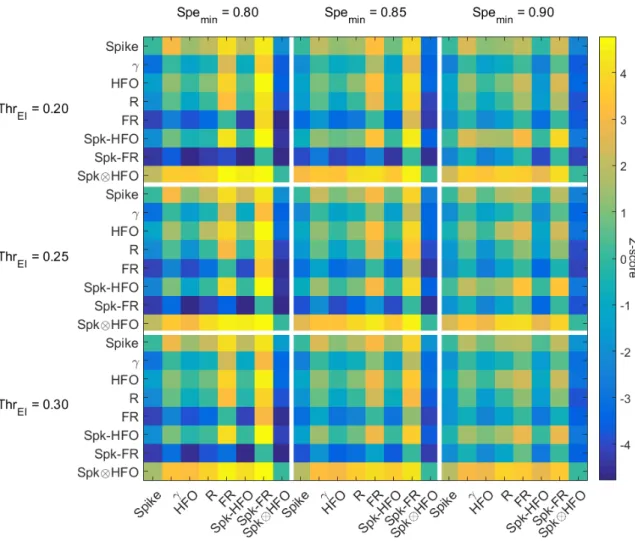
Figure7gives a visual description of the results of the statistical test. Note that the pAUC at chance level is 0.075. One can see that the performance of Spk⊗HFO is globally above the performances of the other markers for each patient. When Spk ⊗ HFO does not perform best for a patient, it is at least in the 3 first best markers. Note the variable performances of spikes and HFOs; spikes perform better than HFOs for some patients (1,3,4,6-9,11,16,18,21-28,30) and, for some others, HFOs perform better (2,5,10,12-15,17,19,20,29). All these results were similar when changing the threshold of the EIZ (0.2-0.3) and the minimum specificity (80-90%) (Supplementary Figure8).
4
Discussion
4.1
HFOs are not better than spikes
The main result of this study is the absence of statistical evidence showing that HFOs or its variants (R, FR, Spk-HFO, Spk-FR) are globally better than epileptic spikes to delineate the EIZ at for every patient.
Figure 5 – Illustration of the mapping of 4 interictal markers and the EI values for 3 patients. Each column illustrates
one of the three patients and each line the following markers: EI, spike, ripple, fast-ripple, Spk ⊗ HFO. To avoid being blinded by region exhibiting large amount of a marker (e.g. dysplasia (DYS)), we decided to represent the normalized value of the square root of the rate divided by the maximum value for each patient and each marker. For the first case (patient 22), every marker points toward the orbitofrontal gyrus (OR’). The markers are discordant for the two other cases. [...]
For the patient 11, the spikes are frequent in the hippocampus (B’) and in the temporo-basal area (TB’) which are not in the EIZ. They are however few in PFG’ belonging to the EIZ. Similarly, the ripple rate is high in the inner contacts of CU’ and PA’ which are outside the EIZ. The fast ripples are only present in the amygdala. The Spk ⊗ HFO values are similar to the one of the spikes but do not manage to completely remove the impact of the CU’ electrode. The effects of PA’ and TB’ are however reduced. In that case, Spk ⊗ HFO is better than the HFOs but slightly less good than the spikes (Fig7). For patient 3, the ripple and spike values are similar to the EI values. The spikes are however present in the electrode B but not the ripples; the ripples are present in the amygdala whereas the spikes are absent from this structure. Spk ⊗ HFO is better than both the ripples and spikes (Fig7) thanks to the complementarity of the HFOs and spikes. The fast-ripples are mainly in the dysplasia (DYS).
Regarding figure7, for some patients, HFOs are better than spikes, whereas spikes are better than HFOs for others. This explains the absence of statistical evidence. In previous articles studying HFOs, little spatial information was available about the extent of the HFO zone [10]. In this study, we emphasized the spatial investigation of the zone mapped by each marker by studying every channel available without a priori se-lection. The variable performance of HFOs and spikes is most likely due to the detection of physiological ripples in some regions and to the large distribution of the spikes (Fig3and5) respectively. It was possible to differentiate epileptogenic areas from non-epileptogenic ones at the group level; this is even possible at the sublobar level for hippocampi and amygdalae (Fig3). It is however more difficult, already at the group level, to separate epileptogenic structures in other regions (Oth) from non-epileptogenic temporo-mesial structures and lesions (Fig3).
We focused on the ripple band to investigate the impact of physiological HFOs. We defined ripples outside the EIZ as physiological ripples. This type of ripples occurred more frequently in some regions, such as the occipital lobes or the mesial temporal regions. Four patients (4,8,11,28) were explored in the occipital lobe which was diagnosed as non-epileptogenic after SEEG. For these patients, spikes were better predictors than ripples. Alkawadri and colleagues18 showed that the rate of physiological ripples was high in the oc-cipital region. In our study, the threshold had to be high enough to overcome the high rate of physiological ripples in order to achieve high specificity, which resulted in lower sensitivity. Our patients however did not have many spikes within occipital lobes (Fig 5). We also found high rates of ripples in hippocampi which were not epileptogenic. The hippocampus is known to produce physiological ripples [17,40]. Addressing the issue of physiological and pathological ripples in order to identify the epileptogenic zone cannot be solved by looking at the overall rate of ripples, especially when regions being known as generators of physiological ripples such as the occipital region and the hippocampus are being recorded. Spikes also exhibit a high rate in the hippocampi, amygdalae and lesions, and therefore the same conclusion could be made. We did not find any relationship with the localization of the SOZ (Table1) explaining the variable performance of spikes and HFOs. When ripples perform better than spikes for a given patient in terms of predicting the EIZ, it is because the spike rate in the NEIZ is too high compared to the rate in the EIZ, whereas in these channels the ripple rate is not necessarily higher in the NEIZ than in the EIZ, and inversely for spikes overcoming
Figure 6 – Boxplot of the partial AUC of each marker beside its significance test. (A) The results of the partial AUC
calculated for each patient separately is given as boxplots for each marker. The variance is high for each marker due to patient variability but Spk ⊗ HFO is the only measure to stands out of the others. (B) The matrix shows the z-values of the Wilcoxon signed rank test for each pair of markers. It reads from line to column. For instance, the tile of the first line and the second column means that spikes are better than gamma oscillations with Z≈2. The green asterisks show statistical significance below 0.05 after FDR correction (28 comparisons). There is no statistical evidence showing that HFOs or any subgroup are better predictors than the spikes. The yellow line of the Spk ⊗ HFO means that this feature is in general better than the other marker for each patient.
Figure 7 – Partial AUC for each patient, ranked in decreasing order of the Spk ⊗ HFO performance. The solid, dotted,
and dashed line correspond to the performance of the Spk⊗HFO, HFOs, and the spikes respectively for each patient. The Spk ⊗ HFO is almost always higher than the other markers as it was shown in Fig6. Note the alternating performance of the spikes and HFOs. The performance at chance level is 0.075 due to partial AUC analysis and normalization (see Methods).
ripples (Fig5,6and 7).
A rule that could be drawn with these results is that tissues are unlikely to belong to the EIZ if they produce a high rate of only one of the two markers. This translates to Spk ⊗ HFO and not Spk+HFO. By multiplying the two rates, we highlight the channels exhibiting high rate of both markers and attenuate those with few or none of at least one marker. Spk-HFO (HFOs occurring together with spikes) is also a combination of the two markers, but it is more constrained since both events have to occur together within a short time window and is therefore less sensitive. We acknowledge that detecting HFOs superimposed on spikes is challenging especially when these events overlap both in time and frequency [41], which could require further developments such as spike removal [42]. We showed in a previous study [23] that Delphos was sensitive enough to have a good estimation of the rate of spikes co-occurring with HFOs. We thus believe that the low performance cannot only be explained by this lower detection sensitivity but more by the fact that spikes without HFOs and HFOs without spikes can be pathological. Concerning the gamma oscillations, they were the only marker which was not statistically better than the FR. Note however that the rate of gamma was the best predictor in three patients (4,7,9). Combining the three markers may be a possible perspective.
4.2
Low sensitivity of FRs and Spk-FR
We found that fast ripples lack sensitivity in delineating the EIZ. In our study, FRs and Spk-FR were very specific markers, as they were found only in about 14% of channels outside the EIZ whereas the HFOs and spikes were found in more than 50%. The median rate of the FR and Spk-FR outside the EIZ is null (Fig3). They however do not perform well under the pAUC criterion. This poor performance seems to go against previous publications [9,13]. In 9, FR and Spk-FR had the best sensitivity compared to spikes, R and spikes co-occuring with ripples at 95% of specificity at the group level (12 patients). Interestingly, this is also what we found (Fig4C). The fact that this occurs at exactly the same specificity (95%) may be a coincidence because the ratio between epileptogenic and non-epileptogenic channels is different in the two studies. This conclusion highly depends on the value of studied specificities (Fig 4A-B). If 90% or 85% specificity had rather been chosen, the Spk-HFO and Spk ⊗ HFO would have had higher sensitivity than FRs and Spk-FR. This strengthens our choice of using the partial area under the curve as the performance criterion instead of sensitivity for a given specificity.
The plateau seen on Fig4E (when analyzing the whole group of patients) could be explained by the fact that FRs rarely occur in neocortical epilepsies [9,10]. Jacobs and colleagues found that at 95% specificity, spikes were better predictors for neocortical epilepsies (for 2/3 of the patients). This, however, does not explain the poor performance at the patient level because we would expect the FR class to achieve high performances for some patients and poor for some others (Fig 6and 7). We did not find any statistical evidence when comparing the performance of FRs in neocortical against mesio-temporal epilepsies. Since
we studied only the performance at high specificities, the low boxplots show the poor global sensitivity. FRs thus describe only a subset of the EIZ. In a recent study [13], the lack of sensitivity of FRs was as-sumed to be related to the insufficient spatial sampling of deep structures due to the recording modality (electrocorticography). We believe that FRs do not occur in all epileptogenic tissues, in line with another SEEG study [43] where they did not find FRs in some epileptogenic channels. For instance, if we focus in the mesial area, the rate of the FR inside the EIZ is much lower in the mesial temporal pole 0.2 min−1 [0-2 min−1] than in the other structures (Am: 1.4 min−1[0.25-7.2 min−1]; Hip: 11.3 min−1[5.2-18.8 min−1]). This is of clinical interest since the temporal pole can generate seizures along with other mesiotemporal structures [33,44, 45]. Fig1 illustrates this issue with patient 30 where the FR rate is very high in the amygdala and the hippocampus but not in the mesial temporal pole even though each structure had high EI values. Patient 11 and 3 in Fig5also describe the low sensitivity of the FRs which are only seen in one part of the EIZ. We would like to emphasize that such conclusions can only be made if the detection procedure is not biased by the variation in activity across brain structures and if it detects equally precisely Rs and FRs. We showed that most of the detectors were biased because the impact of the power spectrum was neglected or because the estimation of the background activity was not robust [23]. Delphos was the only method to overcome both issues whithin our proposed benchmark. Therefore the present study shows that it is highly likely that FRs do not occur in all epileptogenic regions. This highlights the limitation of focusing only on FRs when including pathological Rs should be more appropriate. This however begs the question of how to distinguish physiological from pathological ripples.
4.3
Physiological HFOs
To better predict the EZ, some teams have proposed to distinguish physiological from pathological HFOs by studying their relationship with spikes [9,46] with slow waves [43] or with spindles [47]. Although promising, none of these approaches has so far succeeded in fully separating them. Other teams have suggested to separate them by clustering HFOs based on features such as frequency, duration, amplitude [48,49]. The former study managed to differentiate pathological HFOs from normal task-induced HFOs. This segregation remains to be validated on spontaneous HFOs such as those encountered in the current study. The latter found that some features were higher inside than outside the SOZ (i.e. amplitude and duration) but the difference was small. In the current study, we investigated the potential of a multi-marker analysis rather than directly separating physiological from pathological HFOs. The question whether pathological HFOs are better than spikes remains open.
4.4
Limitations
In the analyzed cohort, only ten patients underwent resective surgery. This is certainly a limitation of our study and more patients with outcome should be investigated to validate our observations. However, studying only patients who underwent surgery may lead to erroneous conclusions. Indeed, the resected area may not be exclusively composed of the epileptic zone. The outcome solely defines the sensitivity of the resection and not its specificity. Moreover, surgery is not proposed to every implanted patient, and this would entail a clear selection bias. Future studies should apply statistical analysis that consider outcomes and resective zones along with the putative EZ to include patients who did not undergo surgery. To estimate the EZ, we used the EI; our results are relative to the EIZ and may not generalize to other means of estimating the EZ. We set the threshold at 0.25 in order to have a correspondence of approximately 50% between the EIZ and the SOZ. The classical threshold as defined in the original study [5] is 0.3 but this was determined in TLE patients; the heterogeneity of our patients may explain this slight decrease. However, the supplementary table shows that neither the change in the EI threshold nor the modification of the minimum specificity affect the main findings and the performance of the Spk ⊗ HFO. It is unknown whether the 5-min duration chosen here may be suboptimal to map the interictal activities; this is still an active area of research. Although a given duration might be advantageous for one marker, it might on the other hand be detrimental for another because of non-stationarity of the signal. The bipolar montage could possibly hinder HFO visibility [16]. This montage is however the standard one for studying seizures in a clinical setting. It seems unlikely that two macro-contacts record the same small HFO generator yielding a destructive interference. Nevertheless, macro-electrodes have a wider spatial resolution compared to micro-electrodes; the resulting background activity could cover HFOs. Only hybrid micro-macro electrodes, recording the same activity at two different scales, could help resolve this question. The contacts near the gray-white matter interface may be an issue as they may be more sensitive to ictal discharge and spikes than HFOs and thus bias the performance of the markers. This is a complex question which needs further investigation.
4.5
Conclusion and future perspectives
This study investigates the reliability of different interictal biomarkers in predicting the epileptogenic zone. HFOs do not seem to delineate epileptogenic areas better than epileptic spikes both at the group and at the patient level. Both Ripples suffer from physiological counterparts and or at least spikes from less pathological counterparts (possibly propagated spikes). FRs seem to be specific to the epileptogenic zone but does not
fully describe it; they cannot be considered as a unique biomarker of epileptogenicity, they are only the tip of the iceberg. A promising path is to combine biomarkers. Combining spikes with HFOs by multiplying the two rates (Spk ⊗ HFO) improve the prediction of the epileptogenic zone with respect to biomarkers considered separately. Tissues are unlikely to be epileptogenic if they produce a high rate of either spikes or HFOs. The performance of Spk ⊗ HFO is however not optimal for every patient. This means that combining markers may only be a first step in improving the delineation of the epileptogenic zone. Future studies should focus on how to better combine markers (e.g. with the use of machine learning techniques) and on other markers (e.g. slow wave, low-frequency oscillations). Considering the low sensitivity of the FRs, future works should also investigate whether this is related to factors such as brain region, pattern of seizure discharge, epilepsy etiology, recording techniques (macro vs. micro-electrodes), montage (bipolar vs referential) [16] or suboptimal recording duration.
Acknowledgments
We would like to thank Didier Scavarda and Romain Carron for the stereotactic placement of the electrodes, Philippe Kahane for leading the FORCE project and Samuel Medina Villalon for the 3D visualization. This work has been carried out within the FHU EPINEXT with the support of the A*MIDEX project (ANR-11-IDEX-0001-02) funded by the “Investissements d’Avenir” French government program managed by the French National Research Agency (ANR). This study was also supported by the ANR project FORCE (ANR-13-TECS-0013).
Author Contributions
NR, FP, SL, IL, AN, AM, FB and CGB took part in the conception and design of the study. FP, AN, AM and FB contributed in acquiring the data, and NR, FP, SL, IL, AN, AM, BG, FB and CGB analyzed the data. NR drafted the manuscript and the figures.
Conflicts of Interest
NR, CGB and FB have a patent pending (PCT/EP2017/054574) about the detection procedure.
References
[1] Jean Bancaud, Jean Talairach, and A Bonis. La Stéréoencéphalographie dans l’épilepsie. Masson, Paris, 1965.
[2] Jean Talairach and Jean Bancaud. Lesion, "Irritative" Zone and Epileptogenic Focus. Confin. neurol, 27(1):91–94, 1966.
[3] Philippe Kahane, Elisabeth Landré, Lorella Minotti, Stafano Francione, and Philippe Ryvlin. The Bancaud and Talairach view on the epileptogenic zone: A working hypothesis. Epileptic Disorders, 8(SUPPL. 2):16–26, 2006.
[4] S West, Nolan Sj, J Cotton, S Gandhi, J Weston, R Ramirez, and R Newton. Surgery for epilepsy.
Cochrane library, (7), 2015.
[5] Fabrice Bartolomei, Patrick Chauvel, and Fabrice Wendling. Epileptogenicity of brain structures in human temporal lobe epilepsy : a quantified study from intracerebral EEG. Brain : a journal of
neurology, pages 1818–1830, 2008.
[6] Olivier David, Thomas Blauwblomme, Anne Sophie Job, Stéphan Chabards, Dominique Hoff-mann, Lorella Minotti, and Philippe Kahane. Imaging the seizure onset zone with stereo-electroencephalography. Brain, 134(10):2898–2911, 2011.
[7] Elena Urrestarazu, Rahul Chander, François Dubeau, and Jean Gotman. Interictal high-frequency oscillations (100-500 Hz) in the intracerebral EEG of epileptic patients. Brain, 130(9):2354–2366, 2007. [8] Richard J Staba, Charles L Wilson, Anatol Bragin, Itzhak Fried, and Jerome Engel. Quantitative anal-ysis of high-frequency oscillations (80-500 Hz) recorded in human epileptic hippocampus and entorhinal cortex. Journal of neurophysiology, 88(4):1743–1752, 2002.
[9] Julia Jacobs, Pierre LeVan, Rahul Chander, Jeffery Hall, François Dubeau, and Jean Gotman. Interictal high-frequency oscillations (80-500 Hz) are an indicator of seizure onset areas independent of spikes in the human epileptic brain. Epilepsia, 49(11):1893–1907, 2008.
[10] Benoît Crépon, Vincent Navarro, Dominique Hasboun, Stéphane Clemenceau, Jacques Martinerie, Michel Baulac, Claude Adam, and Michel Le Van Quyen. Mapping interictal oscillations greater than 200 Hz recorded with intracranial macroelectrodes in human epilepsy. Brain, 133(1):33–45, 2010.
[11] Claire Haegelen, Piero Perucca, Claude Edouard Châtillon, Luciana Andrade-Valença, Rina Zelmann, Julia Jacobs, D. Louis Collins, François Dubeau, André Olivier, and Jean Gotman. High-frequency oscillations, extent of surgical resection, and surgical outcome in drug-resistant focal epilepsy. Epilepsia, 54(5):848–857, 2013.
[12] J. Y. Wu, R. Sankar, J. T. Lerner, J. H. Matsumoto, H. V. Vinters, and G. W. Mathern. Remov-ing interictal fast ripples on electrocorticography linked with seizure freedom in children. Neurology, 75(19):1686–1694, 2010.
[13] Maryse A. van’t Klooster, Nicole E C Van Klink, Frans S S Leijten, Rina Zelmann, Tineke A. Gebbink, Peter H. Gosselaar, Kees P J Braun, Geertjan J M Huiskamp, and Maeike Zijlmans. Residual fast ripples in the intraoperative corticogram predict epilepsy surgery outcome. Neurology, 85(2):120–128, 2015.
[14] Julia Jacobs, Pierre Levan, Claude Edouard Châtillon, Andr Olivier, Franois Dubeau, and Jean Gotman. High frequency oscillations in intracranial EEGs mark epileptogenicity rather than lesion type. Brain, 132(4):1022–1037, 2009.
[15] Fabrice Bartolomei, Agnes Trébuchon, Francesca Bonini, Isabelle Lambert, Martine Gavaret, Mar-maduke Woodman, Bernard Giusiano, Fabrice Wendling, and Christian Bénar. What is the concor-dance between the seizure onset zone and the irritative zone? A SEEG quantified study. Clinical
Neurophysiology, 127(2):1157–1162, 2016.
[16] Liset Menendez de la Prida, Richard J Staba, and Joshua A Dian. Conundrums of high-frequency oscillations (80-800 Hz) in the epileptic brain. Journal of clinical neurophysiology : official publication
of the American Electroencephalographic Society, 32(3):207–19, 2015.
[17] Gabrielle Girardeau, Karim Benchenane, Sidney I Wiener, György Buzsáki, and Michaël B Zugaro. Selective suppression of hippocampal ripples impairs spatial memory. Nature neuroscience, 12(10):1222– 1223, 2009.
[18] Rafeed Alkawadri, Nicolas Gaspard, Irina I. Goncharova, Dennis D. Spencer, Jason L. Gerrard, Hitten Zaveri, Robert B. Duckrow, Hal Blumenfeld, and Lawrence J. Hirsch. The spatial and signal charac-teristics of physiologic high frequency oscillations. Epilepsia, 55(12):1986–1995, 2014.
[19] Aaron M. Spring, Daniel J. Pittman, Yahya Aghakhani, Jeffrey Jirsch, Neelan Pillay, Luis E. Bello-Espinosa, Colin Josephson, and Paolo Federico. Interrater reliability of visually evaluated high frequency oscillations. Clinical Neurophysiology, 128(3):433–441, 2017.
[20] Sergey Burnos, Peter Hilfiker, Oguzkan Sürücü, Felix Scholkmann, Niklaus Krayenbühl, Thomas Grun-wald, and Johannes Sarnthein. Human intracranial high frequency oscillations (HFOs) detected by automatic time-frequency analysis. PLoS ONE, 9(4), 2014.
[21] Tommaso Fedele, Maryse Van, Sergey Burnos, Willemiek Zweiphenning, Maryse van’t Klooster, Sergey Burnos, Willemiek Zweiphenning, Nicole van Klink, Frans Leijten, Maeike Zijlmans, and Johannes Sarnthein. Automatic detection of high frequency oscillations during epilepsy surgery predicts seizure outcome. Clinical Neurophysiology, 127(9):3066–3074, 2016.
[22] Nicolas Roehri, Jean-Marc Lina, John C Mosher, Fabrice Bartolomei, and Christian-George Bénar. Time-frequency strategies for increasing high frequency oscillation detectability in intracerebral. IEEE
Transactions on Biomedical Engineering, 63(12):2595–2606, 2016.
[23] Nicolas Roehri, Francesca Pizzo, Fabrice Bartolomei, Fabrice Wendling, and Christian-George Bénar. What are the assets and weaknesses of HFO detectors? A benchmark framework based on realistic simulations. PLoS ONE, 12(4):e0174702, apr 2017.
[24] Thomas Cloppenborg, Theodor W May, Ingmar Blümcke, Philip Grewe, Lena J Hopf, Thilo Kalbhenn, Margarete Pfäfflin, Tilman Polster, Reinhard Schulz, Friedrich G Woermann, and Christian G Bien. Trends in epilepsy surgery: stable surgical numbers despite increasing presurgical volumes. Journal of
Neurology, Neurosurgery & Psychiatry, pages jnnp–2016–313831, 2016.
[25] Bruce Fischl. FreeSurfer. NeuroImage, 62(2):774–781, 2012.
[26] Samuel Medina, Rodrigo Paz, Nicolas Roehri, Romain Carron, Andrea Brovelli, Anne-Sophie Dubarry, Agnès Trébuchon, Olivier Coulon, Fabrice Bartolomei, and Christian-George Bénar. EpiTools: A software suite for presurgical brain mapping in epilepsy (under review). 2017.
[27] Rina Zelmann, Maeike Zijlmans, Julia Jacobs, Claude E. Châtillon, and Jean Gotman. Improving the identification of High Frequency Oscillations. Clinical Neurophysiology, 120(8):1457–1464, 2009. [28] Sandrine Aubert, Fabrice Wendling, Jean Regis, Aileen McGonigal, Dominique Figarella-Branger,
Jean Claude Peragut, Nadine Girard, Patrick Chauvel, and Fabrice Bartolomei. Local and remote epileptogenicity in focal cortical dysplasias and neurodevelopmental tumours. Brain, 132(11):3072– 3086, 2009.
[29] Fabrice Bartolomei, Stanislas Lagarde, Fabrice Wendling, Aileen Mcgonigal, Viktor Jirsa, Maxime Guye, and Christian Bénar. Defining epileptogenic networks : Contribution of SEEG and signal analysis.
[30] B. Colombet, M. Woodman, J.M. Badier, and C.-G. Bénar. AnyWave: A cross-platform and modular software for visualizing and processing electrophysiological signals. Journal of Neuroscience Methods, 242:118–126, 2015.
[31] Stephanie Gollwitzer, Ivan Valente, Roman Rodionov, Catherine Scott, Laura Mantoan Ritter, Tim Wehner, Hajo M. Hamer, Fabrice Bartolomei, and Beate Diehl. Visual and semiautomated evaluation of epileptogenicity in focal cortical dysplasias - An intracranial EEG study. Epilepsy and Behavior, 58:69–75, 2016.
[32] Angela Marchi, Francesca Bonini, Stanislas Lagarde, Aileen McGonigal, Martine Gavaret, Didier Scav-arda, Romain Carron, Sandrine Aubert, Nathalie Villeneuve, Samuel Médina Villalon, Christian Bénar, Agnes Trebuchon, and Fabrice Bartolomei. Occipital and occipital “plus” epilepsies: A study of involved epileptogenic networks through SEEG quantification. Epilepsy & Behavior, 62:104–114, 2016.
[33] Fabrice Bartolomei, Delphine Cosandier-Rimele, Aileen McGonigal, Sandrine Aubert, Jean Régis, Mar-tine Gavaret, Fabrice Wendling, and Patrick Chauvel. From mesial temporal lobe to temporoperisylvian seizures: A quantified study of temporal lobe seizure networks. Epilepsia, 51(10):2147–2158, 2010. [34] Hans O. Lüders, Imad Najm, Dileep Nair, Peter Widdess-Walsh, and William Bingman. The
epilepto-genic zone: General principles. Epileptic Disorders, 8(SUPPL. 2):1–9, 2006.
[35] C.-G. Bénar, L. Chauvière, F. Bartolomei, and F. Wendling. Pitfalls of high-pass filtering for detecting epileptic oscillations: A technical note on "false" ripples. Clinical Neurophysiology, 121(3):301–310, 2010.
[36] M Navarrete, C Alvarado-Rojas, M Le Van Quyen, and M Valderrama. RIPPLELAB: A comprehen-sive application for the detection, analysis and classification of high frequency oscillations in electroen-cephalographic signals. PloS one, page In press, 2016.
[37] Tom Fawcett. An introduction to ROC analysis. Pattern Recognition Letter, pages 861–874, 2006. [38] Hua Ma, Andriy I. Bandos, and David Gur. On the use of partial area under the ROC curve for
comparison of two diagnostic tests. Biometrical Journal, 57(2):304–320, 2015.
[39] Yoav Benjamini and Yosef Hochberg. Controlling the False Discovery Rate: A Practical and Powerful Approach to Multiple Testing, 1995.
[40] J Csicsvari, H Hirase, a Czurkó, a Mamiya, and G Buzsáki. Fast network oscillations in the hippocampal CA1 region of the behaving rat. The Journal of neuroscience : the official journal of the Society for
Neuroscience, 19(16):RC20, 1999.
[41] Mina Amiri, Jean-Marc Lina, Francesca Pizzo, and Jean Gotman. High Frequency Oscillations and spikes: Separating real HFOs from false oscillations. Clinical Neurophysiology, 2015.
[42] Nawel Jmail, Martine Gavaret, Fabrice Bartolomei, and Christian-G Bénar. Despiking SEEG signals reveals dynamics of gamma band preictal activity. Physiological Measurement, in press, 2016.
[43] Nicolás von Ellenrieder, Birgit Frauscher, François Dubeau, and Jean Gotman. Interaction with slow waves during sleep improves discrimination of physiologic and pathologic high-frequency oscillations (80-500 Hz). Epilepsia, pages 869–878, 2016.
[44] Philippe Kahane and Fabrice Bartolomei. Temporal lobe epilepsy and hippocampal sclerosis: Lessons from depth EEG recordings. Epilepsia, 51(SUPPL. 1):59–62, 2010.
[45] Stéphan Chabardès, Philippe Kahane, Lorella Minotti, Laura Tassi, Sylvie Grand, Dominique Hoff-mann, and Alim Louis Benabid. The temporopolar cortex plays a pivotal role in temporal lobe seizures.
Brain, 128(8):1818–1831, 2005.
[46] Shuang Wang, Irene Z. Wang, Juan C. Bulacio, John C. Mosher, Jorge Gonzalez-Martinez, Andreas V. Alexopoulos, Imad M. Najm, and Norman K. So. Ripple classification helps to localize the seizure-onset zone in neocortical epilepsy. Epilepsia, 54(2):370–376, 2013.
[47] Jonas C. Bruder, Matthias Dümpelmann, Daniel Lachner Piza, Malenka Mader, Andreas Schulze -Bonhage, and Julia Jacobs - Le Van. Physiological Ripples Associated with Sleep Spindles Differ in Waveform Morphology from Epileptic Ripples. International Journal of Neural Systems, 27(0):1750011, 2016.
[48] Joseph Y Matsumoto, Matt Stead, Michal T Kucewicz, Andrew J Matsumoto, Pierce A Peters, Ben-jamin H Brinkmann, Jane C Danstrom, Stephan J Goerss, W Richard Marsh, Fred B Meyer, and Gregory A Worrell. Network oscillations modulate interictal epileptiform spike rate during human memory. Brain : a journal of neurology, pages 2444–2456, 2013.
[49] Urszula Malinowska, Gregory K. Bergey, Jaroslaw Harezlak, and Christophe C. Jouny. Identification of seizure onset zone and preictal state based on characteristics of high frequency oscillations. Clinical
Neurophysiology, 126(8):1505–1513, 2015.
A
Supplementary Material
A.1
Meta-matrix of performance
Figure 8 – Meta-matrix of performance for different settings of EI threshold and minimum specificity. The matrix is
composed of 9 matrices obtained by calculating the Wilcoxon signed rank test for each pair of markers for different value of EI threshold (0.2; 0.25; 0.3) and minimum specificity (0.80; 0.85; 0.90). The settings used for our study is EI threshold = 0.25 and minimum specificity = 0.85. It corresponds to the matrix in the center; the same as in Fig6. The results are similar across settings. Note that Spk ⊗ HFO is still better than the other markers whatever the setting (yellow line).