HAL Id: halshs-00687948
https://halshs.archives-ouvertes.fr/halshs-00687948v2
Preprint submitted on 5 Jun 2012
HAL is a multi-disciplinary open access
archive for the deposit and dissemination of sci-entific research documents, whether they are pub-lished or not. The documents may come from teaching and research institutions in France or abroad, or from public or private research centers.
L’archive ouverte pluridisciplinaire HAL, est destinée au dépôt et à la diffusion de documents scientifiques de niveau recherche, publiés ou non, émanant des établissements d’enseignement et de recherche français ou étrangers, des laboratoires publics ou privés.
there a Total Factor Productivity Growth Channel?
Samba Mbaye
To cite this version:
Samba Mbaye. Real Exchange Rate Undervaluation and Growth: Is there a Total Factor Productivity Growth Channel?. 2012. �halshs-00687948v2�
1
C E N T R E D'E T U D E S E T D E R E C H E R C H E S S U R L E D E V E L O P P E M E N T I N T E R N A T I O N A L
Document de travail de la série Etudes et Documents
E 2012.11
Real Exchange Rate Undervaluation and Growth:
Is there a Total Factor Productivity Growth Channel?
Samba MBAYE
May 2012
C E R D I
65 BD.F. MITTERRAND
63000 CLERMONT FERRAND - FRANCE TEL.0473177400
FAX 0473177428
2
L'auteur
Samba Mbaye
PhD student, Clermont Université, Université d’Auvergne, CNRS, UMR 6587, Centre d’Etudes et de Recherches sur le Développement International (CERDI), F-63009 Clermont-Ferrand, France
Email : Samba.Mbaye1@u-clermont1.fr
La série des Etudes et Documents du CERDI est consultable sur le site :
http://www.cerdi.org/ed
Directeur de la publication : Patrick Plane
Directeur de la rédaction : Catherine Araujo Bonjean Responsable d’édition : Annie Cohade
ISSN : 2114-7957
Avertissement :
Les commentaires et analyses développés n’engagent que leurs auteurs qui restent seuls responsables des erreurs et insuffisances.
3
Abstract
Undervaluation of the currency is generally believed to affect growth through two main transmission channels: the “capital accumulation channel” and the “total factor productivity (TFP) growth channel”. This paper carries out the first empirical investigation on the TFP growth channel. More specifically, we provide answers to the three following questions: Does undervaluation of the currency boost the overall productivity level in the economy? If so, does this “undervaluation-induced” productivity improvement significantly enhance growth? And finally, what is the magnitude of the TFP growth channel compared to the capital accumulation channel? The analysis is conducted on a panel of 72 countries over 1970-2008. The results give strong support to the TFP growth channel: a 10% increase in undervaluation enhances growth on average by 0.14% via an improvement in productivity. Most interestingly, our estimates suggest that this channel conveys the most important part of the growth-enhancing effect of undervaluation. The model has been subject to various robustness checks to support these findings.
JEL Classification: F31, O47
Key Words: real exchange rate, misalignment, undervaluation, growth, productivity
Acknowledgements
We are grateful to Mickaël Goujon, Patrick Plane, Samuel Guérineau, Valérie Mignon, Audrey Sallenave and Céline Colin for helpful comments on earlier drafts of this article. The usual disclaimer applies.
4
Introduction
Does the value of the currency matter for economic performance? For the layperson, the answer to this question would be a straight “yes”. For economists however, it has a long history of debate. From the era of currency wars and competitive devaluations in the 1930s to the current debate on the real value of the Chinese renminbi, this question has always kept the interest of the profession. Modern debates oppose two main views. A first approach, often referred to as the “Washington consensus view”, holds that the value of the currency should be set at a level that is consistent with both internal and external balances (Krueger, 1983; Edwards, 1989; Williamson, 1990). Deviations of the exchange rate from this equilibrium level –in short, exchange rate misalignments- are associated with some sort of macroeconomic disequilibrium, regardless of the direction of the misalignment. Both undervaluation and overvaluation are argued to be harmful to growth, though avoiding overvaluation appears to be the main imperative as the latter is associated with losses of competitiveness, a squeeze on the tradable sector, and increasing odds of balance of payments and currency crises (see for example Loayza et al., 2005; Cottani et al., 1990 and Ghura and Grennes, 1993). On the other hand, undervaluation is discredited on the grounds that it could “produce unnecessary inflationary pressures and also limit the resources available for domestic investment, and hence curb the growth of supply-side potential” (Williamson, 1990).
However, as the China and other east-Asian countries’ success story came into the spotlight, the latter assertion has been called into question. Indeed, for a decade, some economists have refreshed an idea that has been discussed extensively in the post war literature: an active exchange rate undervaluation strategy can efficiently stimulate growth1. The revival of this idea has since triggered an intense debate opposing advocators of this claim (Aguirre and Calderòn, 2005; Rodrick, 2008, inter alia), to more skeptical economists (Woodford, 2009; Nouira and Sekkat, 2012).
Beyond the empirical documentation of this effect, a key aspect in this debate has been the identification of the transmission channels through which it is generated. The literature points toward two main channels. The first channel –known as the “capital accumulation channel”- refers to the claim that real exchange rate undervaluation enhances growth through an increase in the stock of capital in the economy. In fact, this view brings together two sources of capital accumulation. In the first mechanism, the capital accumulation operates exclusively in the tradable goods sector – whose share in GDP increases (Rodrik, 2008) – while in the second, the stock of capital increases through the expansion of overall savings and investment (Levy-Yeyati and Sturzenegger, 2007 ; Bhalla, 2007). The second transmission channel of the potential growth-enhancing effect of undervaluation – commonly dubbed the “total factor productivity (TFP) growth channel”- places the structure of domestic production at the core of the analysis. A depreciated real exchange rate, equivalent to an increase in the price of tradable goods relative to non-tradables, improves the profitability of the tradable sector. As production responds to the price incentive and moves from the non-tradable to the tradable sector -characterized by a higher (marginal social) productivity-, the overall productivity in the economy increases. Such economy-wide productivity improvement ultimately fosters growth. The literature is not always explicit on the ways through which an increase in the size of the tradable sector can improve productivity (Eichengreen, 2008). Most accounts point toward some “learning by doing effects” (LBD) associated with the production of tradables. We will discuss this point in details in section 2.
1 See Razin and Collins (1999), Dooley et al. (2003), Polterovich and Popov (2004), Hausmann et al. (2005), Aguirre and
Calderòn (2005), Gala and Lucinda (2006), Levy-Yeyati and Sturzenegger (2007), Prasad et al. (2007), Gala (2007), Aizenmann and Lee (2007), Bhalla (2007), Rodrik (2008, 2009, 2010), Eichengreen (2008), Béreau et al., (2009), Berg and Miao (2010), Korinek and Servèn (2010), Mcloed and Mileva (2011), and Di Nino et al., (2011).
5 It is quite surprising to find no empirical test of this TFP growth channel considering its recurrence in the literature. Some early references can be traced back to Kaldor (1978). It has also been taken up recently by authors like Gala (2007), Aizenmann and Lee (2007), Eichengreen (2008), Rodrik (2009), as well as Korinek and Servèn (2010). However this literature relies exclusively on theoretical arguments. Some papers, mostly in the Dutch disease literature, studied the link between TFP and the real exchange rate but focused on the effects of real overvaluations2. To our best knowledge, there is no empirical investigation on this transmission channel of the effect of real exchange rate undervaluation on growth. Filling this gap is the aim of this paper. More specifically, we provide answers to the three following questions: Does undervaluation of the currency boost the overall productivity level in the economy? If so, does this “undervaluation-induced” productivity improvement significantly enhance growth? And finally, what is the magnitude of the TFP growth channel compared to the capital accumulation channel?
Our study is close to the recent paper by Mcloed and Mileva (2011). Using simulations of a two-sector open economy growth model based on Matsuyama (1992) and panel estimates for 58 countries, these authors conclude that a weaker real exchange rate can lead to a growth surge, as workers move from non-traded goods sectors with slower productivity growth to traded good industries characterized by more LBD. Nevertheless, there is a fundamental conceptual difference between our approach and that of these authors. We are testing in this paper whether (at least part of) the effect of real exchange rate undervaluation on growth operates through an economy-wide productivity improvement. Mcloed and Mileva focus on the level (and not the misalignment) of the real exchange rate, solely discussing the appreciation and depreciation phases without any positioning with regard to the equilibrium real exchange rate. Our approach seems preferable as it takes into account the probable evolution of the equilibrium real exchange rate over time.
Beyond the fact that it provides the first empirical investigation on the TFP growth channel, this paper extends the existing literature on at least two additional points. First, we provide an estimation of the relative magnitudes of the two competing operative channels in the literature: the TFP growth channel and the capital accumulation channel. Second, we compute the most up-to-date “enhanced-PPP” based undervaluation estimates, responding to the Subramanian (2010)’s recent call for re-estimation of existing estimates of PPP based undervaluation (including Rodrik, 2008 and Reisen, 2009 among others), which suffer from numerous problems (see section 3).
We find strong support for the TFP growth channel. On average, a 10% increase in undervaluation enhances growth by 0.14% via an improvement in productivity. Moreover, our estimates suggest that the most important part of the growth-enhancing effect of undervaluation passes through such productivity improvements.
The remainder of the paper is organized as follows. In the next section, we discuss the mechanisms through which undervaluation of the currency could improve productivity. Section 3 presents the undervaluation indexes used in this paper. Section 4 carries out the empirical assessment of the TFP growth channel. Finally, section 5 conducts a robustness test and provides some concluding remarks.
2 Even on the overvaluation side empirical evidences are mixed. A large strand of studies “paradoxically” finds that real
exchange rate overvaluation improves productivity (see Krugman, 1989 and Guillaumont Jeanneney and Hua, 2011 inter alia). On the undervaluation side, an exception is Harris (2001) who finds a negative impact of undervaluation on productivity growth in the long term.
6
2. Why should currency undervaluation increase TFP?
As stressed before, undervaluation of the currency is associated with a shift of production towards the tradable sector, as the latter becomes more profitable. However, the literature is not always explicit on the mechanisms through which such a shift of production could improve productivity. It is generally referred to some “learning by doing effects” without being very clear on what is put under this generic term. In the following, we emphasize three channels through which an increase in the size of the tradable sector may improve productivity: a “pure composition effect’, a “learning by doing effect” and a “learning by doing externality effect”.
The “learning by doing effect” refers to the capability of firms to improve their productivity as they accumulate experience on production. Productivity gains are typically achieved through practice and self-perfection. This LBD is associated with capital and/or production: firms improve their productivity either by investing or by producing. If such LBD effects are more present in the tradable sector than in the non-tradable sector, a shift of production toward tradables can fosters productivity growth. Numerous empirical documentations of these effects can be found in the literature (see Ohashi, 2005).
Apart from this LBD internal to the firm, some externalities associated with LBD can spill to firms or sectors other than the one that actually undertakes the manufacturing. We refer to this as the “learning by doing externality effect”. The most obvious transmission channel of these externalities is labor mobility across firms or sectors. Trained workers in one firm can move to other firms (sectors), carrying with them the knowledge capital they have accumulated (through LBD) in their former job. This LBD externality effect is then primarily associated with labor. However, externalities associated with R&D and economies of scale can also enter these “LBD externality effects”3.
Unlike the previous two dynamic concepts, the third mechanism can operate in a static fashion. We suppose here for many reasons, including LBD effects and LBD externality effects among firms in the tradable sector, that the latter is fundamentally more productive than the non-tradable sector. In other words, at any point in time, productivity is higher in the tradable sector4. Then, if this assumption is valid, reallocation of production from the non-tradables to the tradables can increase the overall productivity level in the economy even in static, generating a “pure composition effect”. Various empirical supports of this mechanism can be found in the literature. For example, McMillan and Rodrik (2011) argue that applying the developed countries inter-sectoral distribution of production to developing countries (holding unchanged their sectoral productivity levels) would entail productivity gains ranging from 100% for India to 1000% for Senegal.
It is important to note that these three effects are more likely to occur simultaneously following an undervaluation of the currency, making it hard to distinguish between them. In this sense, the overall productivity measure used in this paper provides a valuable feature by accounting for all of these three mechanisms (see section 4).
3
For some authors, LBD externalities are primarily present in export activities.
7
3. Measuring undervaluation
The question of the appropriate measurement of real exchange rate misalignment is one of the most contentious issues in applied macroeconomics. Several competing procedures are available, each applying to a certain time horizon or reflecting a particular definition of the “equilibrium real exchange rate”. The most popular ones are probably misalignment indexes based on the “enhanced” purchasing power parity (PPP) criterion, the so-called fundamental equilibrium exchange rate (FEER, Williamson, 1985) and the behavioral equilibrium exchange rate (BEER, Macdonald, 1997; Clark and Macdonald, 1998)5. We are not going to enter the debate on which misalignment measure is more appropriate. A constant effort is made throughout this paper not to let the controversies on the appropriate measure of undervaluation “pollute” the assessment of the question of primary interest here –which is the empirical investigation of the TFP growth channel. Each of the three aforementioned measures has its advantages and drawbacks6. Accordingly, they should be considered as complementary rather than substitute. In this paper, we compute undervaluation indexes based on the two most routinely used undervaluation measurement approaches in the literature: enhanced-PPP and BEER. However, due to data availability concerns in the computation of the BEER index, results based on the enhanced-PPP measure are presented in the main body of the paper. We show in section 5, however, that our conclusions are robust to the use of both measures.
Building on a long-standing tradition in economics (Froot and Rogoff, 1996; Coudert and Couharde, 2005; and Rodrik, 2008 inter alia), the enhanced-PPP undervaluation index used in this paper is based on the standard PPP criterion, adjusted for the Balassa-Samuelson effect. Its computation follows three steps.
We first calculate the real exchange rate in level ( ) or relative price level of GDP, as follows:
where is the nominal exchange rate of the domestic currency against the U.S. dollar, is the PPP exchange rate, is the price level in the U.S.A., is the price level in country and is an index for five year periods7. This first step gives the simplest version of the PPP based misalignment index. As absolute respect of PPP implies that equals one, a positive value of log( ) reveals an undervaluation and a negative value implies an overvaluation of .
The second step consists in adjusting this measure for the Balassa-Samuelson effect giving the “enhanced” undervaluation index used in this paper (Cline and Williamson, 2009). This is done by
regressing on the real GDP per capita ( ):
where is a full set of time fixed effects and is the error term. The coefficient tells us on average how much a country’s real exchange rate tends to appreciate as it becomes richer (as predicted by Balassa-Samuelson). Based on a sample of 73 countries over 1970-2008, our estimates yield a value of -0.16 for this coefficient (with a t statistic around 12). A 10% increase in is associated with a 1.6% appreciation of , a magnitude similar to previous estimations in the literature. Finally, the
5 Some additional less used procedures can also be found in the literature, such asthe natural equilibrium exchange rate
(NATREX, Stein, 1994).
6 See Cline and Williamson, 2008; comments from Frankel, 2008; and Salto and Turrini, 2010 for discussions on the merit of
each measure; and Bénassy-Quéré et al., 2010 on the complementarity of the different measures.
7 Unless explicitly stated otherwise, 5 years time periods are considered. This procedure has however the drawback of
reducing the number of degrees of freedom. We have also run the regressions with annual data and results are qualitatively similar. They are available upon request to authors.
8 enhanced-PPP undervaluation index (! "### ) is obtained by taking the difference between the current value of and the Balassa-Samuelson equilibrium value predicted from equation (2) ($%& :
! "### ' $%& (
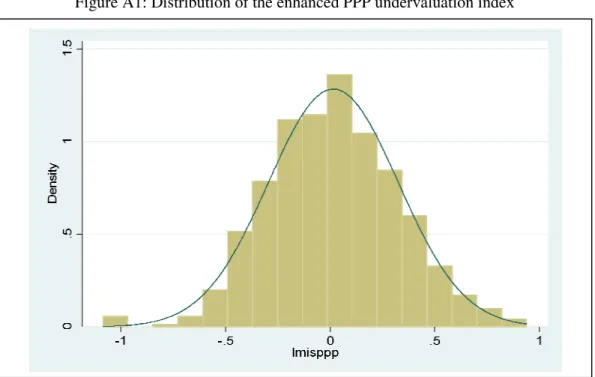
A positive value of ! "### indicates that the exchange rate is set such that the price level at home is lower than predicted by purchasing power parity: the real exchange rate is undervalued. Conversely, a negative value of ! "### implies that the real exchange rate is overvalued. The distribution of ! "### and some summary statistics of this variable are reported respectively in Figure A1 and Table A1.
The data used for the computation of our undervaluation index are taken from the Penn World Tables (PWT) 7.0 (Heston et al. 2011). This allows us to compute the most up-to-date enhanced-PPP undervaluation estimates meeting the Subramanian (2010)’s recent call for re-estimation of existing estimates of PPP-based undervaluation (Rodrik, 2008 and Reisen, 2009 among others). Indeed, the latter suffer from numerous problems. First, as shown by Johnson et al (2009), there was a valuation problem in the PWT methodology that led to important variations across different versions of PWT and across time, implying weak robustness of PPP misalignment estimates based on those versions8. Second, some authors like Deaton and Heston (2009) argue that the price level of GDP (i.e., the RER) for China has been overestimated by about 20% in the previous versions of PWT. Using data from recently issued PWT 7.0, which correct for the aforementioned problems, this study provides new estimates of enhanced-PPP based undervaluations. Anecdotally, we find an undervaluation rate around 35% over the post 2000 period for China (Rodrik, 2008 and Reisen, 2009 reported 50% and 12% respectively).
4. Undervaluation, TFP and growth: empirical evidence
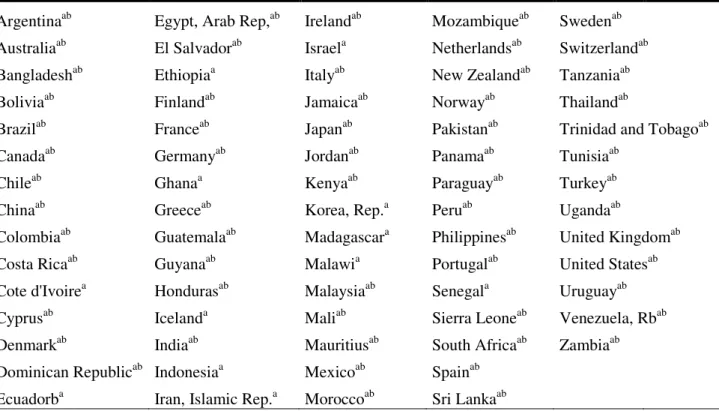
We have collected data for a large and heterogeneous panel of 73 countries over 1970 – 2008. An exhaustive list of countries considered in this paper is provided in Table A1. It includes 39 developing countries and 34 advanced economies9. The choice of the sample has been guided by data availability. Given its composition, sample heterogeneity must be a major concern. Results can be sufficiently general, but require robustness checks. We test in particular the robustness of our conclusions according to countries’ level of development.
4.1. Undervaluation and growth: the direct effect
We start by ascertaining the growth-enhancing effect of undervaluation. Such an exercise is of particular interest, given the lack of consensus among economists on this issue (see Nouira and Sekkat, 2012 for the latest act of this current and intense debate). Our basic model to investigate this question is specified as follows.
)*+, - .)*+, - /. 0! "### 1 2
where )*+, - is the per capita GDP growth rate, ! "### is our undervaluation index, and is a set of common growth determinants. Building on the voluminous cross-country growth literature, we
8 In fact, the warning includes also data for years (countries) other than the benchmark year (country) for which detailed price
data have been collected. We think that this should not be of great concern here since (i) only five countries are “none benchmark” in our sample (ii) as stressed by Johnson et al. (2009), the fact of pooling data over long periods reduces considerably the effect of non benchmark years.
9 consider the most common growth determinants in empirical studies. These include: (i) the quality of institutions (proxied by the variable polity2 from the Center for Systemic Peace database, see Acemoglu and al, 2005), (ii) fixed investment to GDP, (iii) human capital (measured as the gross secondary school enrollment rate, see Mankiw et al., 1992), (iv) government consumption in percentage of GDP (Barro and Sala-i Martin, 1995), (v) trade openness (given by the sum of exports and imports to GDP, Edwards, 1998), (vi) the inflation rate, and (vii) commodity terms of trade. Data are drawn from the World Development Indicators (WDI) and World Economic Outlook (WEO) databases. As witnessed by the presence of the lagged value of the dependent variable among right-hand-side variables, the model is formulated in dynamic fashion. This specification choice is corroborated by the significance of this lagged value in all the estimates. Our primary interest lies on
0 which measures the effect of real exchange rate undervaluation on growth.
A crucial question one must rule on before estimating this model is the identification of causality between undervaluation and growth, i.e. the potential endogeneity of the real exchange rate (as well as many of the control variables). Even though widely admitted, this issue is not always properly addressed in the empirical literature. In fact, this has been one of the sources of criticisms from detractors of the growth enhancing effect of undervaluation. Accordingly, we base our main conclusions on estimates using dynamic panel GMM estimators (Arellano and Bond, 1991; and Blundell and Bond, 1998). These estimators provide an efficient identification strategy by using an internal instrumentation structure (see Roodman, 2006 for a comprehensive user’s guide). We rely more particularly upon the Blundell and Bond (1998)’s estimator as it provides the most efficient identification strategy. Moreover, as suggested by conventional econometric practice, we systematically check that: (i) both p-values associated with the Sargan and Hansen statistics do not reject the over-identifying restrictions confirming the validity of the instruments; (ii) the AR(1) test statistics rejects the null of no first-order autocorrelation in error terms, while the Arellano-Bond test for AR(2) fails to reject the null of no second-order autocorrelation in residuals, reinforcing the validity of our instrumentation strategy (the use of lagged values of regressors); (iii) the instruments count is sufficiently low to avoid problems related to the “over-fitting bias” (see Roodman, 2007). The results are presented in Table 1. Columns 1.1 to 1.4 report the estimation of our basic model in equation (4), using standard fixed (column 1.1) and random effects panel estimators (column 1.2), the “difference GMM” estimator (Arellano and Bond, 1991, column 1.3) and the “system GMM” estimator (Blundell and Bond, 1998, column 1.4). Regardless of the estimator used, real exchange rate undervaluation appears to be significantly associated with a growth surge. The estimated coefficient is remarkably stable across estimations. A 1% increase in the magnitude of real exchange rate undervaluation leads to a 0.023 percentage points increase in the growth rate – according to the Blundell-Bond estimate. Interestingly, this result appears robust to the introduction of variables such as trade openness and terms of trade, indicating that the estimated effect of undervaluation on growth cannot be explained by a simple export-led growth story. A more structural mechanism is at stake. Columns 1.5 to 1.8 investigate alternative specification choices. We first allow the effect of undervaluation on growth to depend on the size of the misalignment in column 1.5. Like Rodrik (2008), we find no evidence of non linearity in the relationship between undervaluation and growth. In column 1.6 and 1.7, we consider subsamples of developing and developed countries, respectively. It appears that the growth enhancing effect of undervaluation is observable in both groups of countries. However, consistent with precedent findings in the literature (Aguirre and Calderon, 2005), this effect seems stronger in developing countries. A 1% increase in the magnitude of undervaluation is associated on average with a 0.037 percentage points enhancement in developing countries’ growth, while it spurs growth by 0.015 percentage points in developed countries.
10 Column 1.8 addresses one of the main arguments brought forth by critics of the growth-enhancing effect of undervaluation (along with the choice of misalignment measure). In fact, some authors rightly pointed out that misalignment indexes like the one used thus far contain undervaluation as well as overvaluation observations. Thus, the positive correlation of this variable with the growth rate is consistent with both a growth-enhancing effect of undervaluation and a detrimental effect of overvaluation. We have focused on the undervaluation side in the interpretation of results since our economic interest relies on this side of the misalignment. Therefore, an obvious objection would be that our results only reflect a strong anti-growth effect of real exchange rate overvaluation outweighing a non-significant effect of real exchange rate undervaluation. In order to shed some light on this issue, we break up the misalignment index into its undervaluation and overvaluation components. We define the dummy which takes the value of 1 when the real exchange rate is undervalued and 0 otherwise. Then, we compute our undervaluation and overvaluation variables respectively as 3456*789 ! "### : and +76*789 ! "### : ' . These variables are then introduced in our basic specification in equation (4) instead of ! "### , as reported in column 1.8. We recode overvaluation figures to be positive for simplicity of the interpretation.
Both undervaluation and overvaluation variables appear significant and bear the expected signs. On the one hand, a 10% increase in the overvaluation rate is associated with a decline of 0.21 percentage points in growth. On the other hand, an expansion of the undervaluation rate by the same amount leads on average to a 0.28 percentage points growth surge.
Turning to the other growth determinants, only the lagged growth rate, human capital and the inflation rate appear to explain robustly the current growth rate and display the expected sign. A better quality of institutions is associated with stronger growth only in the developing countries subsample. In accordance with Barro (1991), government spending is inversely related to growth in most of the specifications (excepted for developed countries), but this effect is statistically significant in none of the models. Similarly, the impacts of trade openness and terms display little robustness across estimates and appear to be statistically weak.
11 Table1: Real exchange rate undervaluation and growth: the direct effect
Dependent variable: GDP growth rate
FE RE GMM 1.1 1.2 1.3 1.4 1.5 1.6 1.7 1.8 Growth(-1) -0.0459 0.249*** 0.272*** 0.194** 0.138* 0.302** 0.0520** 0.153** (-0.652) (3.919) (2.819) (2.021) (1.764) (2.263) (2.343) (2.033) misppp 2.465*** 1.391*** 2.425** 2.322** 2.705** 3.727*** 1.501* (3.530) (3.384) (2.195) (2.167) (2.501) (3.286) (1.891) Underval 2.783** (2.264) Overval -2.083* (-1.781) Institutions quality 0.0511 0.0187 -0.0372 0.0754 0.0503 0.0911** 0.00680 0.0691 (1.275) (0.629) (-0.372) (0.952) (0.718) (2.234) (0.0519) (1.047) Investment 3.181*** 1.647*** 0.734 2.796 2.850 0.0188 3.015*** 2.546* (3.929) (4.012) (0.432) (1.419) (1.524) (0.0121) (2.790) (1.754) Human capital -0.0105 -0.00179 0.130** 0.0881** 0.0745** 0.103** 0.0270 0.104** (-0.692) (-0.323) (2.515) (2.207) (2.290) (2.267) (0.772) (2.463) Public expenditures -1.117 -1.067 -2.237 -2.264 -2.591 -0.640 0.560 -0.130 (-1.261) (-0.222) (-0.640) (-0.0943) (-0.173) (-0.505) (0.0888) (-0.0434) Inflation -3.096** -3.092*** -5.997* -1.237*** -1.704** -1.163* -2.870** -1.663*** (-2.372) (-3.013) (-1.866) (-3.067) (-2.162) (-1.775) (-2.072) (-3.344) Trade openess -0.622 -0.412* -0.141 0.0403 1.554 -0.0426 0.323 (-0.889) (-1.718) (-0.0815) (0.0223) (1.013) (-0.958) (0.0765) Terms of trade -0.333 -0.653 1.255 1.161 0.655 -0.852 2.279 (-0.381) (-0.902) (0.612) (0.678) (0.188) (-0.406) (0.899) misppp2 -2.881 (-1.564) No of Obsv 444 444 365 373 373 227 185 373 AR(1) p-value 0.000 0.000 0.000 0.003 0.024 0.001 AR(2) p-value 0.811 0.573 0.535 0.972 0.637 0.343 Sargan p-value 0.300 0.465 0.437 0.118 0.154 0.441 Hansen p-value 0.227 0.370 0.421 0.184 0.214 0.292 Time fixed effects Yes Yes Yes Yes Yes Yes Yes Yes No of countries 71 71 70 70 70 39 32 70 No of Instruments 24 28 30 29 30 31 Note: *significant at 10% **significant at 5% ***significant at 1%. Robust t-statistics in parentheses.
4.2. Undervaluation and growth: the TFP growth channel
The growth-enhancing effect of undervaluation having been assessed, this section takes the next step of the analysis by conducting an empirical investigation on the TFP growth channel. Most interestingly, taking advantage on the findings of the precedent section, it provides an assessment of the relative magnitude of the TFP growth channel compared to the capital accumulation channel.
4.2.1. Measuring total factor productivity
The total factor productivity index used in this paper is taken from Bosworth and Collins (2003) - and updated to 2008. These authors developed a carefully designed growth accounting (and growth regression) procedure that stands as a benchmark in the econometrics of growth modeling (Bhalla,
12 2007). Total factor productivity is here the residue of an augmented production function à la Solow – educational attainment is added to the standard model to control for quality changes in the workforce. Some descriptive statistics of this variable are presented in Table A4.
This total factor productivity index is used despite the criticism it has been the object of. The more recurrent of these criticisms emphasizes the nebulous character of the contents of such Solow residuals. In fact, in addition to the information on productivity gains, the Solow residual captures all the factors outside the “mechanics of production” such as political turmoil, changes in institutions, droughts, external shocks, conflicts etc. Nevertheless, numerous factors can reduce here the incidence of this drawback. First, the fact of considering 5 year time periods can mitigate the effect of short-term external shocks. Second, even if the estimated level of TFP can be impacted by external factors, we expect the variations in the TFP level to be primarily driven by changes in productivity. Third, in the very long run as here, external shocks could be expected to cancel each other out.
4.2.2. Empirical evidence
Our test strategy consists of two steps. We first investigate the link between real exchange rate undervaluation and TFP growth. Then, following Rodrik (2008), we check whether the component of TFP growth that is directly induced by undervaluation is positively associated with growth.
From undervaluation to TFP growth
The econometrical model to assess the effect of undervaluation on TFP growth is specified as follows:
; . ; /. 0! "### 1< =
where ; is the total factor productivity growth rate, ! "### is the undervaluation index, < is a set of usual productivity determinants, is a time fixed effect and is the error term. As in the previous section, we follow previous empirical studies by including the ensuing standard productivity determinants: (i) human capital (Nelson and Phelps, 1966), (ii) trade openness (Edwards, 1998), (iii) financial development (proxied by the stock of claims on the private sector by deposit money banks and other financial institutions, expressed as a percentage of GDP, see Alfaro et al., 2009), (iv) quality of institutions (Acemoglu et al., 2005) and (v) investment to GDP (Aschauer, 1989). Excepted for the financial development index, which is drawn from Beck et al. (2000), all these variables are taken from the same sources as previously. Parameter 0 bears our primary interest. In order to ward off any
endogeneity problem and guarantee the identification of a causal relationship from undervaluation to TFP growth, our main conclusions are based on estimates using the “system GMM” estimator proposed by Blundell and Bond (1998). Additional estimates using various estimators are however reported for robustness purposes.
Table 2 displays the results of the estimations. It reports estimates using standard fixed and random effects panel estimators (columns 2.1 and 2.2, respectively), in addition to the “difference” and “system GMM” estimators (columns 2.3 and 2.4, respectively). Real exchange rate undervaluation appears to be positively and significantly associated with TFP growth, in all of these estimates. A 10% increase in the magnitude of real exchange rate undervaluation leads on average to a 0.028 percentage points improvement in TFP growth – according to the system GMM estimator. Such a magnitude suggests that nearly 1% of China’s 5% average TFP growth over the post 2000 period is fully imputable to its 35% real exchange rate undervaluation over that period. Most importantly, this effect turns out to be particularly robust: it survives to the exclusion of high misalignment observations (undervaluation and overvaluation rates over 50%), as in column 2.5, suggesting that the underlying mechanism behind this empirical regularity operates even in the case of relatively moderate misalignments.
13 Table 2: Real exchange rate undervaluation and TFP growth
Dependent variable: TFP growth
FE RE GMM 2.1 2.2 2.3 2.4 2.5 2.6 2.7 2.8 2.9 TFP growth(-1) -0.128* 0.154* 0.224* 0.192** 0.264** 0.168** 0.150* 0.173* 0.226** (-1.870) (1.822) (1.917) (2.211) (2.197) (2.111) (1.691) (1.958) (2.390) misppp 1.836** 0.226* 2.979* 2.803* 3.489*** 2.794* 3.592** 2.474*** (2.042) (1.799) (1.813) (1.716) (3.069) (1.902) (2.345) (3.795) Institutions quality 0.0467 0.0634** 0.129* 0.141* 0.0901 0.0870** 0.119* 0.152 0.0799* (1.443) (2.246) (1.821) (1.747) (0.672) (2.130) (1.895) (1.041) (1.793) Investment 0.804** 0.784** -3.577 0.906 -3.568** -1.661 -1.726 -1.160 1.928 (2.112) (2.240) (-1.259) (1.407) (-2.522) (-1.432) (-1.567) (-0.966) (0.784) Human capital 0.0960* 0.0851* 0.115** 0.0993*** 0.114** 0.0701* 0.0810** 0.122* 0.0767** (1.892) (1.847) (2.288) (2.818) (1.986) (1.991) (2.403) (1.874) (2.681) Trade openess 0.218 -0.122 2.170** 2.173* 1.605 1.741** 2.604** 5.025*** -2.408*** (0.318) (-0.765) (2.102) (1.754) (1.419) (2.066) (2.045) (3.355) (-3.530) Financial depth -0.980*** 0.275* 1.677 1.288 0.132 0.617 1.174 0.0841 1.354** (-4.281) (1.810) (1.059) (1.639) (0.245) (0.625) (1.522) (0.0671) (2.129) Underval 5.364*** (3.193) Overval -3.820* (-1.815) misppp2 -3.448*** -5.826*** -2.239 (-2.689) (-3.281) (-1.283) No of Obsv 451 451 372 380 371 380 388 187 193 AR(1) p-value 0.001 0.000 0.001 0.000 0.000 0.000 0.056 AR(2) p-value 0.877 0.656 0.732 0.362 0.570 0.767 0.162 Sargan p-value 0.863 0.638 0.150 0.631 0.692 0.446 0.199 Hansen p-value 0.732 0.234 0.238 0.387 0.260 0.509 0.516 Time fixed effects Yes Yes Yes Yes Yes Yes Yes Yes Yes No of countries 71 71 71 71 71 71 71 38 33 No of Instruments 24 28 28 28 26 26 26 Note: *significant at 10% **significant at 5% ***significant at 1%. Robust t-statistics in parentheses.
As in the previous section, alternative specification choices are explored in the last four columns of Table 2. We start by ascertaining that the balance between overvaluation and undervaluation observations does not tilt towards the overvaluation side in the positive correlation between the growth rate and our misalignment index. A simple look at the distribution of our misalignment index (Figure A1) provides a first indication that this is not the case. We explore this question more formally by breaking down the misalignment index into its undervaluation and overvaluation components, as described in the previous section. The results of this decomposition (reported in column 2.6) confirm our first guess: both the undervaluation and overvaluation variables are significant with the expected sign, but show different amplitudes. A 10% increase in the overvaluation rate is associated with a decline of 0.38 percentage points in TFP growth, while an expansion of the undervaluation rate by the same amount leads on average to a 0.54 percentage points TFP surge.
14 Then, we examine the possibility of threshold effects in the link between real exchange rate undervaluation and TFP growth. Such an assumption seems particularly plausible given the possibility of diminishing marginal social returns of investment in the tradable sector. Indeed, an implicit assumption in the formulation of our hypothesis of test is the existence of at least constant marginal social returns of investment in the tradable sector. For the shift of domestic production (from the non-tradable sector to the non-tradable sector), associated with undervaluation, to occur along with a continuous increase in the economy-wide productivity, the productivity gain from one additional unit of production in the tradables sector needs to always exceed the productivity loss due to the last unit of production withdrawn from the non-tradable sector. In the case of diminishing marginal social returns of investment in the tradable goods sector, the economy-wide level of productivity could decrease, beyond a certain level of production transfer. As a result, the estimate presented in column 2.7 allows for non linearity in the link between RER undervaluation and TFP growth, by adding the square of ! "### in our TFP growth regression. Results indicate that undervaluation of the currency boosts the overall productivity level in the economy, but beyond a certain magnitude of misalignment this effect is reversed. The last two columns of Table 2 address the sample heterogeneity issue, by considering subsamples of respectively developing and developed countries. The results globally echo the findings of the precedent section: undervaluation of the currency seems to boost productivity of both advanced and less developed countries, but this effect turns out to be stronger in developing countries.
From TFP increase to growth
This section provides an answer for the second interrogation raised by this paper: does the undervaluation-induced TFP growth significantly foster growth? Our approach consists in testing whether the component of TFP growth directly induced by undervaluation is positively associated with growth. Concretely, we estimate the following equations:
; . ; /. 0! "### 1! "### 0 =
)*+, - > >.)*+, - /. >0@; ? >1 A B
where @ is the predicted value of ; from equation (5). It captures the total factor productivity ; ? growth that is fully imputable to RER undervaluation. Then, equation (6) tests whether the TFP growth that is directly caused by undervaluation significantly impacts growth. The results of these estimates are reported in Table 3: column 3.1 for equation (5) and column 3.2 for equation (6)10. Results of this latter estimate suggest that the undervaluation-induced TFP growth is positively and significantly associated with a growth surge. A 1% further increase in the TFP growth caused by RER undervaluation is associated with a half percentage point increase in growth. This shows that at least part of the effect of real exchange rate undervaluation transits through an improvement in the economy-wide productivity level.
4.3. TFP growth versus capital accumulation
As emphasized before, the literature on the transmission channels of the effect of undervaluation on growth points toward two dominant channels: the TFP growth channel, which has been examined above, and the capital accumulation channel (Levi-yeyaty and Sturzenegger, 2007; Bhalla, 2007 and Rodrik, 2008). This section provides an estimation of the relative magnitudes of these two competing
10 Note that a rigorous implementation of our test strategy would require the computation of bootstrapped standard errors to
correct for potential inference bias related to the inclusion of a predicted variable among right-hand-side variables. However, the sample size is not sufficient for this procedure to be applied (data were divided into 8 periods of five years averages).
15 transmission channels. Our strategy consists in comparing the direct (total) effect of undervaluation on growth to the indirect effect that passes through the TFP growth channel (Figure 1).
Direct effect: column 1.4 of Table 1
Effect of undervaluation on TFP growth Effect of the “undervaluation-induced TFP growth” Column 2.7 of Table 2 on the growth rate column 3.2 of Table 3
Figure 1: Strategy of test
We have shown in column 3.2 of Table 3 that a 1% increase in the TFP growth caused by undervaluation leads on average to a 0.5% growth surge. Knowing that a 1% increase in undervaluation causes on average a 0.028% increase in TFP growth (column 2.7 of Table 2), we can say that on average a 1% increase in undervaluation improves growth by 0.014% (0.5*0.028) via the TFP growth channel. This is the indirect effect of undervaluation on growth that transits through the TFP growth channel.
Our estimate of the direct effect of undervaluation on growth, in column 1.4 of Table 1, suggests a magnitude of 0.023% enhancement in growth for each 1% further increase in undervaluation. This means that the TFP growth channel accounts for around 61% (0.015/0.023) of the total effect of undervaluation on growth, exceeding in magnitude the capital accumulation channel.
Of course, this calculation should not be taken as a precise estimation of the magnitude of the TFP growth channel. These numbers are only indicative. However, what can be safely said is that the amplitude of the TFP growth channel is not marginal. A large part of the effect of real exchange rate undervaluation on growth passes through an increase in the overall productivity level.
5. Robustness check: an alternative measure of real exchange rate undervaluation
As stated before, the Balassa-Samuelson PPP based undervaluation index used thus far is not the only available measurement standard. We have primarily presented the results based on this undervaluation measure, because of data availability issues in the computation of the (main) alternative measure in the literature: the BEER-based undervaluation index11. In this section, we explore the robustness of our conclusions to the use of this undervaluation measure. Data are available here for a panel of 61 countries over 1980 – 2006 (versus 72 countries over 1970 – 2008 previously). Table A1 displays an exhaustive list of countries considered in this section.Conceptually, the RER misalignment is defined here as the deviation of the market RER from its equilibrium level. The latter is defined as the RER that is consistent with the level of economic fundamentals. Two hypotheses are critical to this procedure: the choice of fundamentals and the choice of the estimator used to compute the equilibrium RER. Results can vary substantially depending on these assumptions.
11 Data availability concerns were primarily related to the Balassa-Samuelson variable as well as terms of trade data.
Growth Undervaluation
16 Table 3: Identification of the transmission channel
Dependent variable TFP growth Growth GMM 3.1 3.2 TFP growth (-1) 0.179* 0.163* (1.782) (1.821) 0.496** (3.681) misppp 3.635*** (3.159) misppp2 -2.476*** (-2.832) Human capital 0.0518* (1.872) Trade openess -0.891 (-1.257) Investment 0.964 (1.345) Institutions quality 0.127 (1.351) Terms of trade 0.986 (1.176) Public expenditures -1.473 (-0.962) Inflation 2.114*** (3.125) No of Obsv 439 362 AR(1) p-value 0.000 0.000 AR(2) p-value 0.771 0.892 Sargan p-value 0.367 0.623 Hansen p-value 0.399 0.342 Time fixed effects Yes Yes
No of Group 73 69
No of Instruments 10 23
Note: *significant at 10% **significant at 5% ***significant at 1%. Robust t-statistics in parentheses.
We use in this paper the most common economic fundamentals both in the empirical and the theoretical literatures (Aguirre and Calderon, 2005; Edwards, 1988, inter alia): the terms of trade (tot), net foreign assets to GDP (nfa), trade openness (trade), public expenditures (g) and a productivity gap variable (prod) aiming at capturing Balassa-Samuelson effects. The RER variable is the CPI based real effective exchange rate ( ). The weights used for its calculation are computed as the share of each partner in average values of imports and exports of goods and services over the 2000-2007 period. An increase in this variable implies a real appreciation. For the Balassa-Samuelson variable, our first-best measure would have been the ratio of productivities between the tradable and non-tradable sectors based on ISIC code sector classifications. However, due to the lack of pertinent data, this variable is
17 proxied by the ratio of the domestic country’s GDP relative to the weighted GDP of trade partners, using the same weighting matrix as for *66* (Aguirre and Calderon, 2005). The remaining variables are taken from the WDI and WEO databases. All series are in logarithm except for nfa. The following long run RER equation is then estimated:
*66* . + 04 8 1 *856 C) D#*+5 E
*66* is expected to appreciate with (i) positive developments in terms of trade, leading to an improvement in the trade balance, (ii) an increase in trade restrictions, resulting in higher domestic prices (iii), a faster tradables – non tradables relative productivity growth at home than abroad, in line with the Balassa-Samuelson effect, (iv) an increase in the country’s net foreign assets position, due to the implied “transfer effect”, (v) an expansion of the government’s size because of the well known “home bias” in public expenditures. In other words all parameters in equation (8) are expected to be positive, excepted for that on trade.
To estimate the long term RER equation, we rely on panel cointegration techniques. As a first step, we assess the validity of this equation as a long run relationship by checking both the non-stationarity of series and the existence of a cointegration relationship between the RER and fundamentals. Results, reported in Table A3, confirm these requirements allowing the estimation of equation (8). Three main estimators are generally considered when estimating panel cointegrating relationships: the Fooly Modified OLS estimator (FM-OLS, Phillips and Hansen, 1990; Pedroni, 2000), the Dynamic OLS estimator (DOLS, Kao and Chiang, 2000) and the Pooled Mean Group estimator (PMG, Pesaran et al., 1999). The PMG estimator seems more suitable in the present case since, unlike the two other estimators, it allows for short run heterogeneity of parameters across countries. This feature is particularly interesting given the heterogeneity of our sample. However, long term homogeneity across groups is still assumed with the PMG approach. This assumption has been ascertained by means of a Hausman test. The following long run RER relationship is obtained when the PMG estimator is applied to equation (8) – t-statistics are presented in parentheses:
*66*F (:G( G: H + G: 4 8 ' G:G2 *856 G:GGGG2 ) G:GB #*+5 I
(14.64) (7.39) (8.02) (-3.39) (7.44) (2.33)
The BEER-based undervaluation (JKLM ) is then measured as the deviation of the RER from its equilibrium level, where the latter is the fitted value from equation (9) using (Hodrick-Prescott, HP) filtered long term values of fundamentals. That is:
JKLM ' H and N OP G
where is the equilibrium real effective exchange rate, is the current real effective exchange rate, N is the estimated matrix of parameters in equation (9) and OP is the (HP) filtered long
term value of fundamentals. Thus defined, a positive value of JKLM reveals an undervaluation and a negative value of this variable is associated with an overvaluation of the currency. The distribution of JKLM and some summary statistics are reported respectively in Figure A2 and Table A3. The correlation between the BEER-based undervaluation and the enhanced-PPP-based undervaluation index used previously is over 0.3, which is sufficiently low to be used as a relevant robustness check.
Table 4 replicates our main estimates in the previous sections using the BEER undervaluation index. As we can see, results are qualitatively similar. Column 4.1 reproduces the estimation of the direct effect of undervaluation on growth. A 1% increase in undervaluation boosts growth approximately by
18 0.038% according to the BEER-based undervaluation measure (versus 0.023% previously). Columns 4.2 and 4.3 separate the effect of real exchange rate undervaluation from that of overvaluation to ensure that the estimated joint effects on growth and TFP are not only driven by overvaluation observations. Column 4.4 explores the possibility of threshold effects in the undervaluation-TFP relationship. As before evidence of non linearity is found suggesting decreasing marginal social returns of investment in the tradable sector. Columns 4.5 and 4.6 investigate the sample heterogeneity issue by testing the robustness of our estimation according to countries’ level of development. We also find here that the estimated effect of undervaluation on TFP growth operates both in developed and developing countries. Finally, column 4.7 provides evidence that the undervaluation-induced TFP growth fosters growth significantly. A 1% increase in the TFP growth caused by undervaluation is associated with a 0.57% boost in growth.
Repeating the simple exercise performed in the previous section, we find here that the TFP growth channel accounts for about 70% (0.047*0.57/0.038) of the direct effect of undervaluation on growth, a larger magnitude than the one previously found. Adding this latter result to the estimation of the precedent section, we can conclude that the effect of undervaluation on growth passes primarily through an increase in the overall productivity level.
Conclusion
This paper aims at contributing to the current and intense debate among economists on whether undervaluation of the currency is growth-enhancing. It carries out the first empirical investigation on the TFP growth channel, which constitutes, along with the capital accumulation channel, one of the main possible transmission channels of the effect of undervaluation on growth. We raise more specifically three questions: Does undervaluation of the currency boost the overall productivity level in the economy? If so, does this “undervaluation-induced” productivity improvement significantly enhance growth? And finally, what is the magnitude of the TFP growth channel compared to the capital accumulation channel? We start out the investigation of these questions by shedding some light on the mechanisms through which currency undervaluation could improve productivity (section 2). We emphasize three channels: a “pure composition effect”, a “learning by doing effect” (LBD associated with capital or production) and a “learning by doing externality effect” (LBD primarily associated with labor). Section 3 takes the next step of the analysis by addressing the issue of undervaluation measurement. Rather than entering the perpetual debate on the appropriate measure of currency misalignment we compute both (an updated) “enhanced-PPP” undervaluation measure and a BEER-based undervaluation index. These are then used to conduct an empirical investigation on the TFP growth channel. The takeaway message of this assessment is twofold: (i) the validity of the TFP growth channel is empirically verified, (ii) this channel seems to convey the most important part of the growth-enhancing effect of undervaluation. Such a conclusion has proven to be robust to explicitly separating the effect of undervaluation from that of overvaluation, considering subsamples of developing and developed countries and using an alternative measure of exchange rate undervaluation. In light of these conclusions, two observations are in order. First, the latter results should be put in perspective with the debate on the fundamental driving forces of growth. Traditionally, economists (Marxian and neoclassical theories) considered total factor productivity gains as the motor of growth. This vision has been challenged afterwards by the New Growth Theory and the theory of capital and investment that place a greater weight on the increase in human and fixed capitals, resulting in a debate that has occupied the “growth accounting” literature over decades. Even though derived from a narrower question, our conclusions give some support to the total factor productivity growth view.
19 Table 4: Robustness tests: an alternative measure of undervaluation
Dependent variable Growth Growth TFP growth TFP growth TFP growth TFP growth Growth GMM 4.1 4.2 4.3 4.4 4.5 4.6 4.7 growth (-1) 0.169* 0.173** 0.179** (1.748) (2.176) (1.982) TFP growth (-1) 0.126* 0.687* 0.236* 0.813** (1.861) (1.778) (1.821) (2.190) 0.567*** (3.641) Underval 3.217** 4.729*** (1.983) (2.691) Overval -4.216* -4.216* (1.861) (-1.863) misbeer 3.782*** 4.261*** 5.211*** 3.861* (3.190) (2.175) (3.179) (1.829) misbeer2 -3.682** -4.298*** -2.021 (-1.998) (-2.762) (-1.233) Financial depth 1.003 0.539* 1.490 0.824** (0.763) (1.760) (0.992) (1.982) Human capital 0.115*** 0.161** 0.264* 0.159** 0.249** 0.158*** 0.104* (2.939) (1.768) (1.813) (2.328) (2.783) (3.713) (1.873) Trade openess 0.819 1.139 1.314 0.819 2.650** -0.970 0.741 (1.120) (1.056) (0.016) (1.493) (2.349) (-1.512) (1.119) Investment -1.318 -1.257** -1.067* 1.267 0.218 0.890 1.113 (-0.488) (-2.175) (-1.721) (1.543) (0.114) (1.291) (1.374) Institutions quality 0.102 0.651 0.194** 0.203*** 0.167** 0.136 0.271 (0.882) (1.307) (2.437) (3.549) (1.988) (0.978) (1.163) Terms of trade 0.946 1.178 1.152 (0.978) (0.581) (1.603) Public expenditures -2.196** -1.587 -1.729 (-2.065) (-0.976) (-1.617) Inflation -8.521** -2.076*** 2.113** (-2.424) (-3.651) (2.065) No of Obsv 309 310 275 311 106 148 302 AR(1) p-value 0.005 0.000 0.002 0.014 0.000 0.045 0.000 AR(2) p-value 0.653 0.687 0.287 0.547 0.981 0.101 0.546 Sargan p-value 0.119 0.761 0.675 0.345 0.749 0.345 0.632 Hansen p-value 0.631 0.287 0.548 0.156 0.542 0.658 0.376 Time fixed effects Yes Yes Yes Yes Yes Yes Yes No. of Countries 56 56 57 57 26 31 56 No. of Instruments 23 24 23 23 24 24 24 Note: *significant at 10% **significant at 5% ***significant at 1%. Robust t-statistics in parentheses.
20 Second, though important, these findings left the crucial question (and may be the more important one) of policy recommendations on the sidelines. A straightforward implication for policy would be the pursuing of an active undervaluation strategy to enhance productivity and growth. However, such a recommendation would implicitly take for granted the economic and political feasibility of a persistent undervaluation strategy. Nothing could be less sure. A rigorous analysis of this question would have to provide answers for the following interrogations. Is the real exchange rate a policy variable? To what extent can a country sustainably pursue an active undervaluation strategy? What are the costs of such a policy for the country concerned? What are the costs for the other countries? Do these costs outweigh the benefits? This seems to be the obvious direction for further research.
21
References
Acemoglu, D., Johnson, S. & Robinson, J. A., 2005. Institutions as the fundamental cause of long-run growth?. in (P. Aghion and S.N. Durlauf, eds.), Handbook of Economic Growth North Holland, Elsevier Academic Press, Vol. 1A, pp. 385‐472.
Alfaro, L., Kalemli-Ozcan, S. & Sayek, S., 2009. FDI, productivity, and financial development. The World Economy, 32(1), 111–135.
Aguirre, A., Calderon, C., 2005. Real Exchange Rate Misalignments and Economic Performance. Working Paper 315, Economic Research Division, Central Bank of Chile.
Aizenman, J., Lee, J., 2008. The real exchange rate, mercantilism and the learning by doing externality. NBER Working Paper 13853.
Arellano, M., Bond, S., 1991. Some tests of specification for panel data: Monte Carlo evidence and an application to employment equations. Review of Economic Studies, 58, 277-97.
Aschauer, D., A., 1989. Is Public Expenditure Productive?. Journal of Monetary Economics, 23 (2), 177-200.
Barro, R., Sala-i Martin, X., 1995. Economic Growth. Mc Graw-Hill.
Bénassy-Quéré A., Béreau S. & Mignon., V., 2010. On the complementarity of equilibrium exchange-rate approaches. Review of International Economics, 18 (4), 618-632.
Béreau, S., Lopez Villavicencio, A. & V. Mignon, 2012. Currency Misalignments and Growth: A New Look using Nonlinear Panel Data methods. Applied Economics, forthcoming.
Berg, A., Miao Y., 2010. The Real Exchange Rate and Growth Revisited : The Washington Consensus Strikes Back?. IMF working paper 10 / 58, International Monetary Fund.
Bhalla, S. S., 2007. Economic development and the role of currency undervaluation. The Cato Journal, 28(2).
Blundell, R., Bond, S., 1998. Initial conditions and moment restrictions in dynamic panel data models. Journal of Econometrics, 87, 11-143.
Bosworth, B., Collins, S., 2003. The Empirics of Growth: An Update. Brookings Papers on Economic Activity 2, 113–179.
Clark, P., MacDonald, R., 1998. Exchange Rates and Economic Fundamentals: A Methodological Comparison of BEERs and FEERs. IMF Working Papers 98/67, International Monetary Fund.
Cline, W., R., Williamson, J., 2008. Estimates of the Equilibrium Exchange Rate of the Renminbi: Is There a Consensus and If Not, Why Not? In Debating China’s Exchange Rate Policy eds. Morris Goldstein and Nicholas Lardy. Peterson Institute for International Economics.
Cottani, J. A., Cavallo, D. F. & Khan, M. S., 1990. Real Exchange Rate Behavior and Economic Performance in LDCs. Economic Development and Cultural Change, 39(1), 61–76.
Coudert, V., Couharde, C., 2005. Real Equilibrium Exchange Rates in China. CEPII Working Paper 2005-01.
Deaton, A., Heston, A., 2009. Understanding PPPs and PPP-based national accounts. NBER Working paper 14499, National Bureau of Economic Research.
Di Nino, V., Eichengreen, B. & Sbracia, M., 2011. Real Exchange Rates, Trade, and Growth: Italy 1861-2011. Economic History Working Papers 10, Bank of Italy, Economic Research Department. Dooley, P. M., Folkerts-Landau, D. & Garber, P., 2003. An essay on the revived Bretton Woods system. NBER Working Papers 9971.
Edwards, S., 1988. Exchange Rate Misalignment in Developing Countries. Baltimore, MD: Johns Hopkins University Press.
22 Edwards, S., 1998. Openness, Productivity, and Growth: What DoWe Really Know?. Economic Journal 108, 383-398.
Eichengreen, B., 2008. The Real Exchange Rate and Economic Growth. Commission on Growth and Development Working Paper 4, The World Bank.
Frankel, J., A., 2008. Comment on Cline and Williamson. In Debating China’s Exchange Rate Policy eds. Morris Goldstein and Nicholas Lardy. Peterson Institute for International Economics.
Froot, K. A., Rogoff, K., 1995. Perspectives on PPP and long-run real exchange rates. in: G. M. Grossman & K. Rogoff (ed.), Handbook of International Economics(1), 1647-1688.
Gala, P., 2007. Real exchange Rate Levels and Economic Development : Theoretical Analysis and Empirical Evidence. NBER Working Papers 6147.
Gala, P., Lucinda, C.R., 2006. Exchange Rate Misalignment and Growth: Old and New Econometric Evidence. Revista Economia, 165-87.
Ghura, D.,Grennes, T., 1993. The real exchange rate and macroeconomic performance in Sub-Saharan Africa, Journal of Development Economics 42, 155-74.
Guillaumont Jeanneney, S., Hua, P., 2011. How does real exchange rate influence labour productivity in China?. China Economic Review, 22, 628–645.
Harris, R., 2001. Is there a Case for Exchange Rate Induced Productivity Declines. In Schembri, L. (ed.) Re-Visiting the Case for Flexible Exchange Rates. Bank of Canada, 277-309.
Hausmann, R., Pritchett, L., Rodrik, D., 2005. Growth Accelerations, Journal of Economic Growth, 10, 303-329.
Heston, A., Summers, R. & Aten, B., 2011. Penn World Table Version 7.0. Center for International Comparisons of Production, Income and Prices at the University of Pennsylvania.
Johnson, S., Larson, W. & Papageorgiou, C., Subramanian, A., 2009. Is Newer Better? Penn World Table Revisions and Their Impact on Growth Estimates. NBER Working Paper 15455. National Bureau of Economic Research.
Kaldor, N., 1978. Causes of the slow rate of growth of the United Kingdom. In Further Essays on Economic Theory, Duckworth, London, 100-138.
Kao, C., Chiang, M., 2000. On the estimation and inference of a cointegrated regression in panel data, in Advances in Econometrics 15, Baltagi, B. and Kao, C., 179–222.
Korinek A., Servén, L., 2010. Undervaluation through Foreign Reserve Accumulation: Static Losses, Dynamic Growth. Policy Research Working Paper 5250, The World Bank.
Krueger, A., O., 1983. Exchange Rate Determination. Cambridge: Cambridge University Press. Krugman P., 1989. Surévaluation et accélération des productivités : un modèle spéculatif in Laussel D. and C. Montet (eds.), Commerce international et concurrence parfaite, Paris, Economica, 121-135. Loayza, N., Fajnzylber, P. & Calderón, C., 2004. Economic Growth in Latin America and The Caribbean: Stylized Facts, Explanations, and Forecasts. Working Papers Central Bank of Chile 265, Central Bank of Chile.
Levy Yeyati, E., Sturzenegger, F., 2007. Fear of Appreciation. World Bank Policy Research Working Paper 4387, The World Bank.
MacDonald, R., 1997. What Determines the Real Exchange Rate? The Long and the Short of It. IMF working paper 97/21.
McMillan, M. S., Rodrik D., 2011. Globalization, Structural Change and Productivity Growth. NBER Working Paper No. 17143.
Mankiw, G., Romer, D. & Weil, D., 1992. A Contribution to the Empirics of Economics Growth. The Quarterly Journal of Economics 107(2), 407–37.
23 Matsuyama, K., 1992. Agricultural productivity, comparative advantage and economic growth. Journal of Economic Theory, 58, 317-334.
McLoed, D., Mileva, E., 2011. Real Exchange Rates and Growth Surges. Fordham Economics Discussion Paper 2011-04.
Nelson, R., R., Phelps, E., S., 1966. Investment in Humans, Technological Diffusion and Economic Growth. American Economic Review Papers and Proceedings, 56, 69-75.
Nouira, R., Sekkat, K., 2012. Desperately seeking the positive impact of undervaluation on growth. Journal of Macroeconomics doi:10.1016/j.jmacro.2011.12.002.
Ohashi, H., 2005, Learning by Doing, Export Subsidies, and Industry Growth: Japanese Steel in the 1950s and 1960s. Journal of International Economics, 66(2), 297–323.
Pedroni, P., 2000. Fully modified OLS for heterogeneous cointegrated panel. In Advances in Econometrics 15, Baltagi, B. and Kao, C, 93–130.
Pesaran, M., Shin, Y. & Smith, R., P., 1999. Pooled Mean Group Estimation of Dynamic Heterogeneous Panels. Journal of the American Statistical Association, 94(446), 621–634.
Phillips, P., Hansen, B., 1990. Statistical inference in instrumental variables regression with I(1) processes, Review of Economic Studies 57, 99–125.
Polterovich, V., Popov, V., 2004. Accumulation of foreign exchange reserves and long term growth, in S. Tabata and A. Iwashita, eds, ‘Slavic Eurasia Integration into the World Economy’, Slavic Research Center, Hokkaido University, Sapporo.
Prasad, E., Rajan, R. G. & Subramanian, A., 2007. Foreign Capital and Economic Growth.”Brookings Papers on Economic Activity, 1.
Razin, O., Collins, M., 1997. Real Exchange Rate Misalignments and Growth. NBER Working Paper 6174.
Reisen, H., 2009. On the renminbi and economic convergence. Available at www.voxeu.org.
Rodrik, D., 2008. The Real Exchange Rate and Economic Growth. Brookings Papers on Economic Activity, 2, 365–412.
Rodrik, D., 2009. Growth after the Crisis. unpublished paper, Harvard Kennedy School.
Rodrik, D., 2010. Making a room for China in the world economy. American Economics Review: Paper and Proceedings, 100, 89-93.
Roodman, D., 2006. How to do xtabond2: An introduction to “Difference” and “System” GMM in Stata. Working Paper 103, The Center for Global Development.
Roodman, D., 2008. A note on the theme of too many instruments. Working Paper 125, The Center for Global Development.
Salto, M., Turrini, A., 2010. Comparing alternative methodologies for real exchange rate assessment. Economic Papers, 427, DG ECFIN, European Commission.
Stein, J., 1994. Estimating Equilibrium Exchange Rates: the Naturel Real Exchange Rate of the US dollar and Determinants of Capital Flows, in Estimating Equilibrium Exchange Rate. Williamson, J. Subramanian, A., 2010. New PPP-Based Estimates of Renminbi Undervaluation and Policy Implications. Policy Brief PB10-18, Peterson Institute for International Economics.
Williamson, J., 1985. The Exchange Rate System. MIT Press (2).
Williamson, J., 1990. What Washington Means by Policy Reform, in Latin American Adjustment: How Much Has Happened?, John Williamson, ed. Washington, Institute for International Economics. Woodford, M., 2009. Is an Undervalued Currency the Key to Economic Growth? Department of Economics Discussion Paper No. 0809-13, Columbia University.