EcoGRAFI
2ndInternational Conference on Bio-based Building Materials& 1st Conference on ECOlogicalvalorisation of GRAnular and FIbrous materials June 21th - 23th 2017
Clermont-Ferrand, France
ASSESSMENT OF HYGROTHERMAL BEHAVIOUR OF AN EXPERIMENTAL
TIMBER-FRAMED HOUSE
S. Guernouti*, J. Borderon, J. Gauvrit Cerema
* sihem.guernouti@cerema.fr
Abstract
The context of very high energy efficiency and the development of bio-materials bring new questions about heat and mass transfer and their impact on the actual energy performance, comfort, health and the risk of components degradation. This is particularly true for old buildings built before 1948 with very hygroscopic materials. If the humidity has an effect on the thermal performance of the building envelope, it influences also the interaction between the building and it constituent materials and the air indoor quality, and therefore, the effects on the comfort and occupant health (risk of mould growth). Indeed, the preservation of envelope components is based on a hygrothermal balance of parts that constitute it. Any intervention on buildings that shifts this balance can cause disorders. In particular, a thermal insulation of walls when it's poorly designed or badly implemented can generate condensation in walls or on their surfaces and cause structural pathologies. To provide some answers to these questions, an experimental timber-framed cell was constructed. It allows the study of both global and detailed hygrothermalbehavior at both wall and building scales. It is a timber-framed and cob cell with two zones (dry and wet) of about 16m² with two mechanical systems of ventilation (double-flow ventilation and Positive Input Ventilation). The aim of this paper is to present the hygrothermalbehavior of this cell without and with insulation under several boundaries condition. The experimental cell and its monitoring set-up are presented. Four configurations are studied: Case1: without both ventilation and insulation; Case2: with mechanical ventilation and without insulation; Case3: with both mechanical ventilation and internal thermal insulation; Case4: without ventilation and with internal thermal insulation. The indicators of hygrothermal comfort and of risks of pathologies related to humidity are calculated and compared for the studied configurations.
Keywords:
Old buildings, timber-framed, cob, monitoring, assessment, humidity pathologies, hygrothermal comfort
1 INTRODUCTION
The context of very high energy efficiency and the development of bio-materials bring new questions about heat and mass transfer and their impact on the actual energy performance, comfort, health and the risk of components degradation. This is particularly true for old buildings. Indeed, the building sector represents nearly 40% of global energetic consumption and the residential part composes 22% [IEA 2014]. In France, three main periods of construction characterize the whole building stock. The first part was built before 1948 [Cantin 2010]. These buildings are presented as old buildings. The industrialized buildings submitted to economic constraintscompose the second part of the housing stock (1948-1975). Thelast part represents the buildings which respect the thermal regulations since 1975.The annual growth of the building stock in France is around1% [INSEE 2014]. Therefore, retrofitting of existing stock is a major
lever tosave energy. The French old buildings represent 10 millions ofdwellings. It is a third part of the entire buildings stock. These buildings have very hygroscopic materials and are more permeable to water vapor transfer than in the new ones but the sensibility of these materials to the moisture depends on the constructive type and elements such as the presence of wood for example.
Excessive levels of moisture in buildings lead to pathologies[Berger 2015]. Moisture also has an impact on the indoor air quality, the hygrothermal comfort andthe health of the building's occupants (risk of mould growth).Indeed, the preservation of envelope components is based on a hygrothermal balance of parts that constitute it. Any intervention on buildings that shifts this balance can cause disorders.In particular, a thermal insulation of walls when it's poorly designed or badly implemented can generate condensation in walls or on their surfaces and cause structural pathologies.
Paradoxically, a lack of knowledge characterizes the existing buildings stock. The energy efficiency of existing buildings is regulated in France only since 2007. The models and retrofitting technical solutions are still to be developed, in particular for the old buildings([Guernouti 2011], [Stephan 2014]). To provide some answers to these questions, an experimental timber-framed cell was constructed. It allows the study of both global and detailed hygrothermal behavior at both wall and building scales. This cell also offers the possibility to test the effect of ventilation in the regulation of humidity, to study the capillary rising in the walls and to study singular points such as thermal bridges. In addition, these experiments will allow the evaluation of the effectiveness of models [Berger 2014].
The aim of this paper is to present the experimental setup and the first results of the hygrothermal behavior of this cell without and with insulation under several boundaries condition.
2 EXPERIMENTAL SETUP
The experimental cell HUMIBATex (Fig.14) is built in Angers (Geographical coordinates: 0 ° 32 '2.5' 'O; 47 ° 25' 51.9 '' N). The cell is a building with rectangular base of 4x 6.60 m rising at the ridge at 6.70m. The roof has two slopes of 40 °, oriented to the East and the West. The cell is composed of four volumes: a dry zone (ZS), a wet zone (ZH), a technical room and roof
spaces (
Fig.15). ZS is a volume whose vertical walls are
exposed to weather conditions in the east, south and west and artificial conditions in the north (inner wall between ZS and ZH). The vertical walls of the ZS are in timber-framed filled with cob. The base is inschist.
Fig.14: photo of the experimental cell
Equipments installed in the cell allow to control inside humidity, temperature and airflow. The cell has two mechanical ventilation systems: exhaust ventilation and supply ventilation. Electric heaters are installed in each zone.
The instrumentation set up makes it possible to monitor the progression of external weather conditions (temperature, relative humidity, wind speed, solar radiation, etc.), internal conditions (temperature, humidity, differential pressure in ZS, ZH, technical room and roof space), hygrothermal fields within walls and systems (humidifier, dehumidifier, heaters , etc.). To understand the hygrothermal behavior of the walls many sensors were installed on each wall in vertical and horizontal profiles in width direction of the wall and also the depth direction (Fig.16, Tab. 25: Sensors
characteristics)
The sensors used for temperature and humidity are presented in Tab. 25.An acquisition chain has been implemented to continuously acquire all the measurements with a frequency of 10 min.
Fig.15: Experimental cell- Top: horizontal cross-section; Bottom: vertical cross-section
Fig.16: Wall instrumentation Tab. 25: Sensors characteristics
Sensor Accuracy and range Location E+E Electronik E+E08/05 (T, RH) • +/- 0,4°C between -40°C et 80°C • +/- 2% RH between 0 et 90% RH and +/-3% between 90% et 100% RH In wood, cob, schist Vaisala HMP60 (T, RH) • +/-0,6°C between -40°C et 60°C • +/- 3% RH between 0 et 90% RH In insulation In zone for ambient T/RH Type T Thermocouple +/-1°C Wall surface temperature 3 STUDIED CONFIGURATIONS
Two configurations were defined for carrying out the tests (Fig.17). Thus, the physical behavior of the experimental cell is being studied without insulation and with insulation from the inside (insulation that combines glass wool and wood fiber with a density of 35kg/m3, a thermal conductivity of 0.036 W/m².K and a
water vapor diffusion resistance factor of 5).
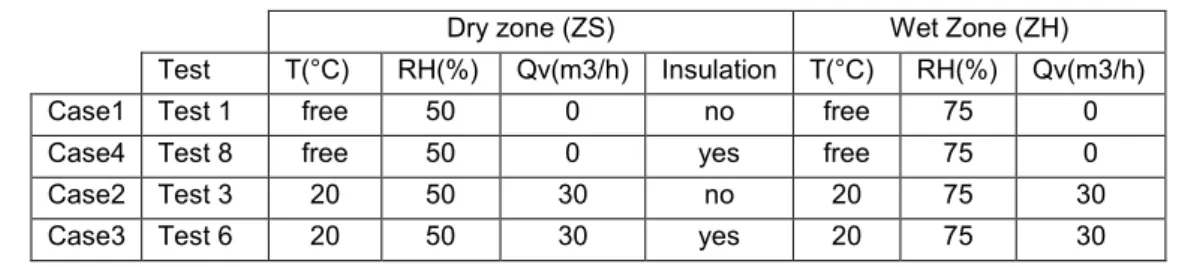
For each of these configurations, several tests were defined by combining the hygrothermal conditions in the cell (T, HR), the type of ventilation (without, exhaust ventilation, supply ventilation) and airflow rate.Moreover, other constraints are added for the
choice of tests: the temperature control in the zones is possible only in winter since no cooling system is installed (accuracy of +/- 1K), the moisture control in the dry zone (ZS) is ensured by a dehumidifier with an accuracy of +/- 10% of RH and the water vapor production in the wet zone (ZH) is “all or none” with a flow rate of 0.9 l / h. In the end, we carried out 10 tests. In this paper we present only 4 cases (Tab. 29:). The tests were carried out according to the schedule shown in table Tab. 26. The duration of each test was mainly guided by the stabilization of the hygrothermal conditions in the walls.
For tests with free temperature condition, heating is switched off. In controlled condition the temperature setpoint is set at 20°C in both zones. Three convectors with a power of 500W are installed (two in the dry zone and one in the wet zone). The setpoint temperature is set by means of a knob located on each electrical device graduated from 1 to 9. The temperature sensor is located inside the heater. Preliminary tests made it possible to define the graduation corresponding to 20°C.The air tightness of cell envelope (following EN 13829) was tested before insulation and instrumentation. The envelope cell air permeability under 4 Pa is about 0,64 m3/m².h.
All measurements done give relative humidity values.However, to understand the phenomena link to moisture, we have transformed this variable in absolute value to avoid the temperature impact. The air specific humidity (HA) has been chosen and calculated according to equations (1) and (2) [Hens 1996], where Psat is the saturated vapor pressure of water (Pa), T is the temperature (°C), RH is the relative humidity (value between 0-1) and HA is the specific humidity (kgv/kgas).
For the measurements through the wall, we assume that the sensor is in small air pocket. The latter is assumed continually in equilibrium with the investigated material. So, we use the specific humidity instead water content.
𝑃𝑠𝑎𝑡 = exp (23.5771 −𝑇 + 273.15 − 37.58)4042.9 (1) 𝐻𝐴 =101325 − 𝑃𝑠𝑎𝑡 ∗ 𝑅𝐻0.622 ∗ 𝑃𝑠𝑎𝑡 ∗ 𝑅𝐻 (2)
Fig.17 : Test configuration (left: without insulation; right: with insulation)
Test Date Duration test 1 18/09/2015-08/10/2015 19 days 16 hours 20 minutes test 3 06/11/2015-04/12/2015 29 days 6 hours 10 minutes test 6 04/03/2016-01/04/2016 27 days 16 hours 10 minutes test 8 29/04/2016-27/05/2016 28 days 1 hours 50 minutes
Since the tests were carried out at different outdoor climatic sequences, it is difficult to make comparisons between the tests; this would require fine analysis work by identifying similar climatic conditions. This work should be done. Nevertheless, it’s interesting to characterize the behavior for each test to at least ensure the coherence of the experimental data. In this paper we focus the assessment on the wall between the dry and wet zones (north wall) since hygrothermal conditions are controlled. In addition, we characterize the hydrothermal comfort in the two zones even though the conditions have been controlled in some tests. The criterion chosen to evaluate the comfort is based on the hygrothermal zones proposed by COSTIC [Hoffman, 1994]. These zones are defined from the conditions of the air temperature and specific humidity. The discomfort rate is calculated for each test as a relation of number of points of temperature and humidity outside the comfort zone in relation to the total number of measured points.Results
4 RESULTS AND DISCUSSION
4.1 Analysis of monitoring results on the experimental cell
The figure Fig.18 shows the weather conditions for the four studied cases. On average conditions of tests 1 and 8 are quite similar whereas test 3 is warmer and wetter than test 6.The figuresFig.31 and Fig.32 present the hygrothermal comfort in the two studied zones according to the COSTIC method cited in the previous section. The polygon in red represents the hygrothermal comfort area. The polygon in blue represents a suitable area to the development of bacteria and fungi. This area must be avoided.In the dry zone (ZS), all tests are comfortable. The points relating to tests 1 and 8 are more spread out since they are in free temperature. The weather conditions are quite similar for both tests (mean temperature and humidity about 14°C and 70% RH respectively). In these tests the ventilation is made by the envelop airtightness only.
The discomfort rate calculated is equal to 6% for test 1 and 1% for test 8 (Fig.33).
The points of both test 3 and 6 are more grouped around 20°C (setpoint temperature). In these tests airflow rate is for 30m3/h. The discomfort observed is
rather hydric (points below the red polygon). Despite the difference in the outside conditions, we have compared these testes. We observed that the hygrothermal comfort is depredated (Fig.33). This can be explained either by the mode of regulation of the relative humidity in the dry zone or by the insulation which reduces moisture transfers.
Fig. 19 presents the hygrothermal comfort in the wet zone. All the measurement points are in the blue area (risk of fungi and bacteria development). The results
were predictable since the relative humidity is maintained at 75%. Like for the dry zone, the rate of discomfort between test 1 and 8 doesn’t meaningful to conclude about the impact of insulation.
Fig.18: Outside climate conditions
4.2 Analysis of monitoring results on the north wall
In this section we present the first analysis on the monitoring data of the wall between wet and dry zone. To help the reader, the tables Tab. 28 and Tab. 29 show how to interpret the legend of the presented curves.
We consider for the north wall that the dry zone represents the inside boundary conditions and the wet zone the outside (Fig.16).
The figuresFig.19 to Fig.22 present the hourly variation of temperature and relative humidity in wood at different deeps. The same results are presented for cob in figures Fig.23 to Fig.26.
To understand the impact of insulation, we compare both test1 with test 8 and test 3 with test 6 since they have the same conditions. It seems more difficult to assess the influence of ventilation before and after insulation insofar the test conditions are different in the dry and wet zones.
Tab. 27 : Example of legend nomenclature
Location material variable Position test
N BOI T 10 1
North wall Wood (°C) Mid of wall
Test 1
Tab. 28: Legend matching
ZS_T_moy / ZH_T_moy Mean temperature in the dry zone/ wet zone ZS_H_moy / ZH_H_moy Mean relative humidity in
the dry zone/ wet zone
N North
T temperature
H Relative humidity
HA Specific humidity
TOR Cob
SCH Schist
ISO Insulation
00/05/10/15/20 Inside surface/0.25 of the wall/ mid of the wall/ 0.75 of the wall/ outside surface
Overall, we observe that before insulation, both wood and cob have the same thermal behavior. There’s temperature stratification in depth from the dry zone to the wet zone in case of free temperature.
After insulation, the temperature in the mid of wall for wood and cob are close to the wet zone condition. We notice also, that insulation contribute to fell the relative humidity levels in the middle of the wood for all tests. This reduction is about 21%. This observation is not verified for the cob. Indeed, the levels of relative humidity remain the same for most depth.
The figures Fig.27 to Fig.30 present the specific humidity calculated from measured temperature and relative humidity in the mid of each material constitute the north wall.We notice here that we have used 12cm of insulation for schist and 24 cm for both wood and cob. We observe that the humidity in wall is driving by temperature of the wet zone in the case of free temperature tests. The insulation of the wood reduced the level of the humidity on average by 18% in the free case without ventilation and by 27% in the case with ventilation. Whereas, the level of humidity for the cob remains the same for both configurations with and without insulation (tests 1 and 8).But, it decreases by 36% after insulation in configurations with mechanical ventilation. It can be explained by the hygroscopic characteristics of used materials in particularly the effect of regulation of the insulation used. For the moment, we haven’t yet all lab hygrothermal characterization of used materials.
Fig.19: Hourly temperature and humidity variation in a wood profile in zones- Test1
Fig.20: Hourly temperature and humidity variation in a wood profile in zones- Test8
Fig.21: Hourly temperature and humidity variation in a wood profile in zones- Test3
Fig.22: Hourly temperature and humidity variation in a wood profile in zones- Test6
Fig.23:Hourly temperature and humidity variation in a cob standard section and in zones- Test1
Fig.24: Hourly temperature and humidity variation in a cob standard section and in zones- Test8
Fig.25:Hourly temperature and humidity variation in a cob standard section and in zones- Test3
Fig.26: Hourly temperature and humidity variation in a cob standard section and in zones- Test6
Fig.27: Estimated specific humidity in the mid of the wall and in the zones- Test1
Fig.28:Estimated specific humidity in the mid of the wall and in the zones- Test1
Fig.29:Estimated specific humidity in the mid of the wall and in the zones- Test3
Fig.30: Estimated specific humidity in the mid of the wall and in the zones- Test6
Fig.31: Hygrothermal comfort in the dry zone
Fig.32:Hygrothermal comfort in the wet zone
Fig.33: Discomfort rate in the two studied zones
5 CONCLUSION
In this paper, we have presented the experimental setup developed and constructed in the context of Humibatex project. It is a timber-framed and cob cell with two zones (dry and wet) of about 16m² with two
mechanical systems of ventilation (exhaust only and supply only). This experimental cell allows the study of both global and detailed hygrothermal behavior at both wall and building scales. Four configurations were presented and analyzed:
Case1: without both ventilation and insulation.
Case2: with mechanical ventilation and without insulation.
Case3: with both mechanical ventilation and internal thermal insulation.
Case4: without ventilation and with internal thermal insulation.
The hygrothermal comfort in the cell was assessed. And the monitoring results of one wall were presented. These first analyzes allowed us to verify the behavior of the cell. The configurations studied here have not shown any accumulation of moisture in wall over time and hence of development of pathologies. Furthermore, the many data available can be processed more finely to understand the physical phenomena like the study of the behavior of the wall with rain and solar stresses. These data can be also used to calibrate models to predict moisture risk over simulation time of 10-15 years.
6 ACKNOWLEDGMENTS
The authors acknowledge the National Research Agency (ANR) for funding this work through its Sustainable Buildings and Cities program (HUMIBATex project no. ANR-11-BVD).
7 REFERENCES
[Berger 2014]Julien Berger, Marx Chhay, SihemGuernouti, Monika Woloszyn (2014): « Proper generalized decomposition for solving coupled heat and moisture transfer » Journal of Building
Performance Simulation,
DOI:10.1080/19401493.2014.932012.
[Berger 2015] Julien Berger, SihemGuernouti, Monika Woloszyn, Catherine Buhe (2015) « Factors governing the development of moisture disorders for integration into building performance simulation ». Journal of Building Engineering.doi:10.1016/j.jobe.2015.04.008. [Cantin2010]Cantin R, Burgholzer J, Guarracino G, Moujalled B, Tamelikecht S, Royet BG. Field assessment of thermal behavior of historical dwellings in France.BuildEnviron 2010; 45:473e84..
[Guernouti 2011]Tasca-Guernouti et Al., «Experimental method to determine thermal conductivity, and capacity values in traditional buildings», Climamed 2011, Madrid, Espagne, 3-4 juin 2011.
[Hens 1996] Hens H. Heat, air and moisture transfer in insulated envelope parts-task1: modeling.Final report IEA,EXCO ECBCS Annex24, ACCO, Leuven, Belgique. ISBN 90-75741-02-2.
[Hoffman 1994] Hofmann, J. B. Ambiances climatisées et confort thermique. COSTIC proceedings , 120 p ,1994.
[IEA2014]IEA.AEO2014 early release overview; 2014
[accessed on 24.02.14],
http://www.eia.gov/forecasts/aeo/er/pdf/0383er(2014).p df.
[INSEE 201] INSEE.TEF edition 2014; [accessed on 24.02.14], http://www.insee.fr/fr/
publications-et-services/default.asp?page¼collections-nationales.htm. 2014.
[Stephan 2014] E. Stéphan, R. Cantin,A. Caucheteux, S. Tasca-Guernouti, P. Michel (2014). « Experimental
assessment of thermal inertia in insulated and non-insulated old limestone buildings”.Building and Environment 80,241-248.
Tab. 29: studied tests
Dry zone (ZS) Wet Zone (ZH)
Test T(°C) RH(%) Qv(m3/h) Insulation T(°C) RH(%) Qv(m3/h)
Case1 Test 1 free 50 0 no free 75 0
Case4 Test 8 free 50 0 yes free 75 0
Case2 Test 3 20 50 30 no 20 75 30