HAL Id: hal-00297096
https://hal.archives-ouvertes.fr/hal-00297096
Submitted on 9 Apr 2008
HAL is a multi-disciplinary open access
archive for the deposit and dissemination of
sci-entific research documents, whether they are
pub-lished or not. The documents may come from
teaching and research institutions in France or
abroad, or from public or private research centers.
L’archive ouverte pluridisciplinaire HAL, est
destinée au dépôt et à la diffusion de documents
scientifiques de niveau recherche, publiés ou non,
émanant des établissements d’enseignement et de
recherche français ou étrangers, des laboratoires
publics ou privés.
The impact of an upper tropospheric teleconnection
pattern on precipitation extremes over Cyprus
M. Hatzaki, P. Lingis, H.A. Flocas, S. Michaelides, C. Oikonomou
To cite this version:
M. Hatzaki, P. Lingis, H.A. Flocas, S. Michaelides, C. Oikonomou. The impact of an upper
tro-pospheric teleconnection pattern on precipitation extremes over Cyprus. Advances in Geosciences,
European Geosciences Union, 2008, 16, pp.131-136. �hal-00297096�
www.adv-geosci.net/16/131/2008/
© Author(s) 2008. This work is distributed under the Creative Commons Attribution 3.0 License.
Geosciences
The impact of an upper tropospheric teleconnection pattern on
precipitation extremes over Cyprus
M. Hatzaki1, P. Lingis2,3, H.A. Flocas1, S. Michaelides2, and C. Oikonomou1
1Department of Environmental Physics and Meteorology, Faculty of Physics, University of Athens, Greece 2Meteorological Service of Cyprus, Cyprus
3Institute of Atmospheric Science, University of Edinburgh, UK
Received: 25 July 2007 – Revised: 21 January 2008 – Accepted: 9 February 2008 – Published: 9 April 2008
Abstract. The objective of this study is to estimate the duration, frequency and intensity of precipitation extreme episodes in Cyprus, in relation with the two phases of the Eastern Mediterranean teleconnection Pattern (EMP), during winter for the period 1958–2005. A standardised teleconnec-tion index was employed to determine the phases (positive and negative) and the strength of the EMP. The identification of the precipitation extremes was performed with the aid of four climatic indices. It was found that during the positive phase of the pattern, the length of dry periods reduces while that of wet periods increases, being followed by increase of frequency of extreme wet days and precipitation intensity. On the contrary, during the negative phase, the dry spells be-come longer in accordance with shortening of the wet spells, decrease of the number of extreme wet days and precipita-tion intensity.
1 Introduction
The Eastern Mediterranean teleconnection Pattern (hereafter will be referred to as EMP) is an upper tropospheric tele-connection pattern that was identified in the geopotential height field at 300 and 500 hPa, during winter between East-ern Mediterranean and NorthwestEast-ern Europe (Hatzaki et al., 2007). This pattern seems very weak in spring and summer, weakens at lower levels and does not exist at 1000 hPa.
As significant components of the natural climatic variabil-ity, teleconnection patterns, such as the North Atlantic Os-cillation, Mediterranean Oscillation and North-Caspian Sea patterns, they play an important role in the variability of the regional climate of Eastern Mediterranean, and especially in the occurrence of climatic extremes (e.g. Kutiel et al.,
Correspondence to: M. Hatzaki (marhat@phys.uoa.gr)
2002; Maheras et al., 1999a; Maheras et al., 1999b; T¨urkes and Erlat, 2005; Houssos and Bartzokas, 2006). Hatzaki et al. (2005) provided evidence that EMP has also certain im-plications on the temperature and precipitation regime of the Eastern Mediterranean. More specifically, it was found that during the positive phase of the pattern, an increase was ev-ident in the winter precipitation, while in the negative phase a significant overall increase was evident in the winter mini-mum temperature and a slight increase in the corresponding regime of maximum temperature at specific areas.
For Eastern Mediterranean, the research of precipitation extremes is more complicated as compared to other Mediter-ranean areas, due to the complex topographical features and to the sparse station data. Recent studies have shown an in-creasing tendency of the dry spell length during the last two decades in Greece (Anagnostopoulou et al., 2003) in accor-dance with a decrease of wet spell duration (Tolika and Ma-heras, 2005) as well as a tendency towards drier conditions in Turkey (T¨urkes, 2003).
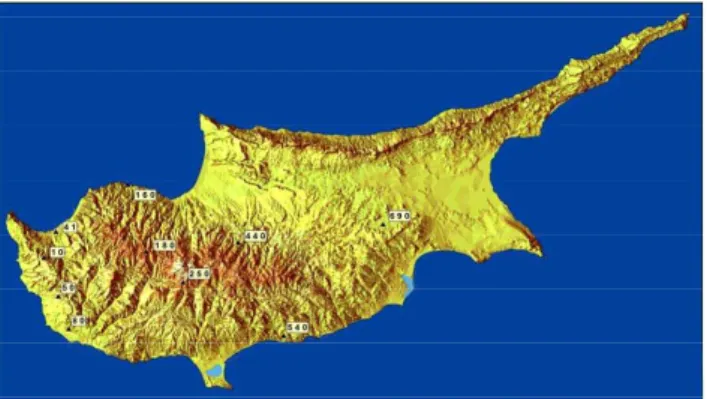
Cyprus, the third largest Mediterranean island is located in the northeastern most corner of the Mediterranean basin (longitude φ=35◦, latitude λ=33◦). Its climate is character-ized by cool-to-mild and wet winters and by warm-to-hot-and dry summers. The precipitation regime of Cyprus ex-hibits large temporal and spatial variability. In winter, the total mean precipitation corresponds to about 60% of the an-nual precipitation (Meteorological Service, 1986). This is associated with the fact that Cyprus is one of the main fre-quency centers of Mediterranean cyclones (Maheras et al., 2001; Maheras et al., 2002). Furthermore, the precipitation in Cyprus originates mainly from depressions moving from the west or northwest (Nicolaides et al., 2004). The mountain range of Troodos (see Fig. 1) plays an important role in the precipitation distribution, accounting for the higher values in the windward southwestern slopes (Meteorological Service, 1986).
132 M. Hatzaki et al.: The impact of an upper tropospheric teleconnection pattern
Table 1. The rain gauge stations used in this study.
Station name (number) Latitude (deg. N) Longitude (deg. E) Elevation (m)
Droushia (10) 34.96 32.40 647 Polis (41) 35.04 32.44 51 Agios Neophytos (50) 34.85 32.45 452 Anatoliko (80) 34.75 32.48 101 Kato Pyrgos (160) 35.19 32.68 29 Kykkos (180) 34.98 32.74 1178 Pano Platres (250) 34.89 32.86 1132 Panagia Bridge (440) 35.01 33.08 440 Moni (540) 34.73 33.20 73
Fig. 1. Locations of rain gauge stations of Cyprus used in this study.
2 Data and methodology
In this study, the following datasets are employed: a) datasets of daily geopotential height, obtained from the NCEP/NCAR Reanalysis Project for the isobaric level of 500 hPa. The datasets cover the period from 1958 to 2005 on a 2.5◦×2.5◦ latitude by longitude grid for the quarter-spherical window extended from 90◦W to 90◦E and 0◦to 90◦N. b) daily pre-cipitation data from a network of 10 rain gauge stations in Cyprus (see Fig. 1) for the period same period as above which are provided by the Meteorological Service of Cyprus; Table 1 displays the names, the location and the altitude of these stations.
Since EMP was mainly identified from December to February, the mean winter values for each of the above men-tioned time series were calculated. Following this standard definition of winter, winters were extracted for each year us-ing the December data of the previous year, resultus-ing to re-duce the datasets by one year.
In order to determine the strength of a teleconnection pat-tern and examine its time variations and implication to re-gional climate, a usual approach is the definition of a stan-dardized index (Brunetti et al., 2002; Quadrelli and Wallace, 2004). The EMP index (EMPI) is defined at 500 hPa
follow-ing the methodology described by Hatzaki et al. (2007), as follows:
EMPI=gpm(25◦W, 52.5◦N)−gpm(22.5◦E, 32.5◦N) (1) where, gpm is the mean winter geopotential height (in geopo-tential metres) at each of the grid points which form each pole in Eq. 1.
The index was calculated for the winter of each year and then was standardized, according to the mean value and stan-dard deviation, as follows:
zi =(EMPIi−EMPI)/σ (2)
where, the EMPI is the index value of the year i, and EMPI is its long-term average and σ the corresponding standard deviation for the period 1958–2005. The values derived are positive, negative or close to zero. Each value was classified in the positive and the negative phase of the pattern using the threshold value of |0.5|.
The precipitation extremes in Cyprus are investigated with the aid of climatic indices. The employment of climatic in-dices seems to be a useful and consistent approach, without requiring the meaningful employment of fixed threshold val-ues that are not applicable for all stations, while they are rel-evant in terms of impacts. Furthermore, this approach can be transferable across a range of different climatic regimes.
The indices were selected from the list of climate variabil-ity indices recommended by WMO (World Meteorological Organization) and the European research project STARDEX (STAtistical and Regional dynamical Downscaling of EX-tremes for European regions). More specifically, in this study, the following indices were employed: a) CDD (con-secutive dry days), representing the length of dry spells b) CWD (consecutive wet days), representing the length of wet spells, c) R90 (number of days above 90% percentile of all wet days during the period examined), representing the fre-quency of extreme wet episodes d) SDII (quotient of precipi-tation amount of wet days and the number of the wet days of the specified period), serving as a measure of rainfall inten-sity of extreme wet episodes.
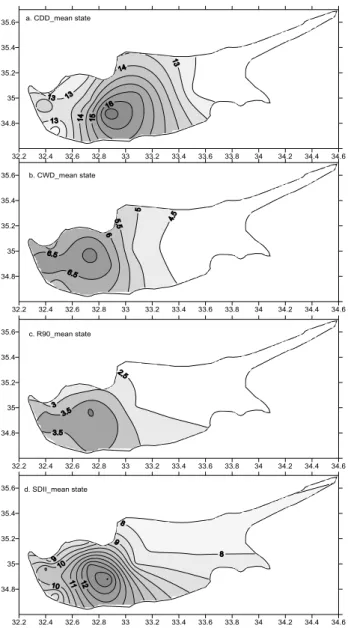
32.2 32.4 32.6 32.8 33 33.2 33.4 33.6 33.8 34 34.2 34.4 34.6 34.8 35 35.2 35.4 35.6 a. CDD_mean state 32.2 32.4 32.6 32.8 33 33.2 33.4 33.6 33.8 34 34.2 34.4 34.6 34.8 35 35.2 35.4 35.6 32.2 32.4 32.6 32.8 33 33.2 33.4 33.6 33.8 34 34.2 34.4 34.6 34.8 35 35.2 35.4 35.6 32.2 32.4 32.6 32.8 33 33.2 33.4 33.6 33.8 34 34.2 34.4 34.6 34.8 35 35.2 35.4 35.6 b. CWD_mean state c. R90_mean state d. SDII_mean state
Fig. 2. Spatial distribution of mean winter values of a) CDD (Fig. 2. Spatial distribution of mean winter values of (a) CDD
(days), (b) CWD (days), (c) R90 (days) and (d) SDII (mm/day) during the period 1958–2005. The contour interval is 0.5 days (for a, b and c) and 0.5 mm/day (for d).
As an attempt to examine the impact of the EMP on ex-treme wet episodes and prolonged dry and wet spells, the winter composite anomalies of all four indices were calcu-lated for each station during the positive or negative phase of EMP, by subtracting the long-term mean of the whole period examined 1958–2005 of each index from each phase. The statistical significance of the composite anomalies has been examined at the 0.05 level applying Student’s t-test.
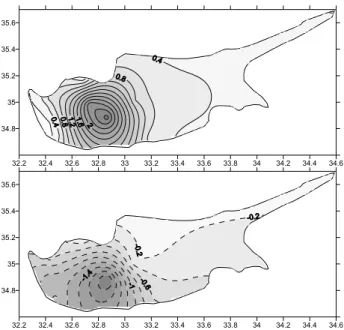
32.2 32.4 32.6 32.8 33 33.2 33.4 33.6 33.8 34 34.2 34.4 34.6 34.6 34.8 35 35.2 35.4 35.6 a. CDD positive phase 32.2 32.4 32.6 32.8 33 33.2 33.4 33.6 33.8 34 34.2 34.4 34.6 34.8 35 35.2 35.4 35.6 b. CDD negative phase
Fig. 3. Spatial distribution of composite anomalies of CDD during th
Fig. 3. Spatial distribution of composite anomalies of CDD duringthe (a) positive and (b) negative phase of EMP. Contours for nega-tive anomalies are presented with dashed lines. The contour interval is 0.2 days.
3 Discussion of results
Figure 2 shows the mean winter distribution over Cyprus of the four indices examined. Maximum length of dry spells (CDD), of 16 days, is observed in the southwestern slope of Troodos range (Fig. 2a).; this is a mountain range that extends from the northwestern to the southeastern part of the island (dark area of Fig. 1). The CDD decreases eastwards and westwards in the plain areas, reaching the value of 13 days, while remains almost constant along the northern and western coast.
The CWD exhibits relatively low values in winter (Fig. 2b), ranging between 4 and 7 days, although winter comprises the main rainy season in Cyprus (Jacovides et al., 2003). This is probably due to the fact that winter precipita-tion events in Cyprus, being mostly associated with a baro-clinic disturbance (Michaelides et al., 2001; Nicolaides et al., 2004) last for two or three consecutive days, until the passage of the next disturbance. Without significant spatial variations, the CWD peaks over the mountain, with high val-ues in its western side while decreases eastwards with a sig-nificant gradient. Generally, the CWD is higher inland and decreases towards the coast. Similar distribution is found for the mean winter R90 index, with values ranging between 2.4 and 4 days (Fig. 2c). A secondary peak is evident near the western coast, more likely accounting for the occurrence of locally enhanced precipitation. SDII also peaks (13 mm/day) over the mountain (Fig. 2d). The precipitation intensity in-dex decreases towards the coast, with lower values along the
134 M. Hatzaki et al.: The impact of an upper tropospheric teleconnection pattern 32.2 32.4 32.6 32.8 33 33.2 33.4 33.6 33.8 34 34.2 34.4 34.6 34.8 35 35.2 35.4 35.6 32.2 32.4 32.6 32.8 33 33.2 33.4 33.6 33.8 34 34.2 34.4 34.6 34.8 35 35.2 35.4 35.6 a. CWD_positive phase b. CWD_negative phase
Fig.4. As in Fig. 3, but for CWD. The contour interval is 0.2 days for the positiv
days for the negative phase.
Fig. 4. As in Fig. 3, but for CWD. The contour interval is 0.2 daysfor the positive and 0.1 days for the negative phase.
northern coast.
As can be seen in Fig. 3a, during the positive phase of EMP, a decrease of CDD is observed in the whole examined area. The decrease is more prominent in the western side of the island - which is characterized by the highest precipita-tion amounts during winter - reaching the value of 3 days near the western coast (Droushia). The decrease of CDD weakens eastwards, following the mean winter CDD reduc-tion (Fig. 2a), attaining the minimum anomaly of 1.4 days in Athienou. On the contrary, during the negative phase, the length of dry spells increases in almost the whole area (Fig. 3b), except in the eastern side of Troodos mountain (Panagia Bridge), where a small decrease was found which is statistically insignificant. The increase is absolutely smaller as compared to the positive phase, reaching 1.2 and 1.8 days in the northwestern coast and southern coast, respectively.
The length of wet periods (CWD) increases during the positive phase of EMP (Fig. 4a), consistent with the CDD reduction. However, the CWD anomalies are smaller as com-pared to the CDD, more likely due to the smaller CWD win-ter values. This increase peaks at Kykkos on the mountain (of 2 days) and then weakens towards the coast and eastwards. The lowest CWD increase is found for the four stations near the western coast and the station of the eastern slope of the mountain range (Panagia Bridge). During the negative phase, an overall reduction of the CWD forms (Fig. 4b), which is, however, lower compared to the corresponding increase dur-ing the positive phase. The maximum reduction of 1.20 days is found in the western side, while low (statistically insignifi-cant) values appear in the western mountain slope (Pano Pla-tres), in the plains on the southern coast (Moni) and the
east-32.2 32.4 32.6 32.8 33 33.2 33.4 33.6 33.8 34 34.2 34.4 34.6 34.8 35 35.2 35.4 35.6 32.2 32.4 32.6 32.8 33 33.2 33.4 33.6 33.8 34 34.2 34.4 34.6 34.8 35 35.2 35.4 35.6 a. R90_positive phase b. R90_negative phase
Fig. 5. As in Fig. 3, but for R90. The contour interval is 0.2 d
Fig. 5. As in Fig. 3, but for R90. The contour interval is 0.2 daysfor the positive and 0.1 days for the negative phase.
ern side (Athienou).
According to Fig. 5a, the R90 index exhibits an increase over the area examined, during the positive EMP phase, sim-ilarly to CWD (Fig. 4a). The maximum increase (2.4 days) is found at Kykkos, while the minimum value (0.5 days) at the northern coast (Kato Pyrgos). The negative phase is char-acterized by a smaller magnitude decrease of R90 (Fig. 5b), which peaks in the western side (at Droushia with 1.25 days decrease). The decrease weakens eastwards, taking a min-imum anomaly of 0.3 days in the eastern slope of Troodos (Panagia Bridge).
The intensity index SDII strengthens during the positive phase at all stations (Fig. 6a), reaching maximum anoma-lies on the mountain (of 2.6 mm/day at Pano Platres and 2.2 mm/day at Kykkos). The increase weakens towards the coast, with minimum anomalies of 0.4 mm/day along the western and northern coasts and in the eastern part (Athienou). During the negative phase (Fig. 6b), the inten-sity decreases everywhere, peaking again on the mountain (–1.8 mm/day at Pano Platres). The magnitude of decrease is lower in the eastern side, where the index is character-ized by low values (Fig. 2d), with minimum value 0.3 at Panagia Bridge and Athienou. The decrease changes along the north-western coast, from 0.4 mm/day at Kato Pyrgos to 1.1 mm/day at Anatoliko.
4 Conclusions
An attempt is made to estimate the impact of the Eastern Mediterranean teleconnection Pattern (EMP) on the length
32.2 32.4 32.6 32.8 33 33.2 33.4 33.6 33.8 34 34.2 34.4 34.6 34.8 35 35.2 35.4 35.6 32.2 32.4 32.6 32.8 33 33.2 33.4 33.6 33.8 34 34.2 34.4 34.6 34.8 35 35.2 35.4 35.6
Fig. 6. As in Fig. 3, but for SDII. The contour interval is 0.2 mm
Fig. 6. (a) SDIIpositivephase and (b) SDIInegative phase. As inFig. 3, but for SDII. The contour interval is 0.2 mm/day.
of prolonged dry and wet spells along with the frequency and intensity of extreme wet episodes during winter, when EMP is active. For this purpose, the behaviour of four extreme in-dices (CDD, CWD, R90 and SDII) is examined during the positive and negative phases of the EMP.
It was found that the positive phase of EMP is character-ized by a reduction of the number of consecutive dry days, which is followed by a smaller increase in the length of wet spells, mainly in the western part of the island. Further-more, the rainfall intensity increases, along with the number of extreme wet days, mainly at the stations along the western slopes of the mountain range. These results are consistent with the increased cyclonic circulation prevailing over East-ern Mediterranean during the positive phase of EMP, being accompanied by an intensification of the Atlantic anticyclone (Hatzaki et al., 2007).
The negative phase results in longer dry spells and, ac-cordingly, shorter wet spells. Furthermore, the number of heavy precipitation events reduces as well as the rainfall in-tensity. The observed composite anomalies during the nega-tive phase are lower for all indices as compared to the posi-tive phase. However, the negaposi-tive phase predominates during winter months over the positive phase (Hatzaki et al., 2007), and therefore, its impact is more regularly realised. The ob-served decrease of the frequency and intensity of extreme wet episodes is in accordance with the increased anticyclonic circulation over Eastern Mediterranean during the negative phase of EMP, being associated with the intense zonal circu-lation prevailing over Europe.
Acknowledgements. This work is funded by the State Scholarships Foundation of Greece through a scholarship of the Ph.D. student M. Hatzaki.
Edited by: S. C. Michaelides
Reviewed by: two anonymous referees
References
Anagnostopoulou, C., Maheras, P., Karacostas, T., and Vafiadis, M.: Spatial and temporal analysis of dry spells in Greece, Theor. Appl. Clim., 74, 77–91, 2003.
Brunetti, M., Maugeri, M., and Nanni, T.: Atmospheric circulation and precipitation in Italy for the last 50 years, Int. J. Climatol., 22, 1455–1471, 2002.
Hatzaki, M., Flocas, H. A., Giannakopoulos, C., Maheras, P., and Oikonomou C.: Investigation of the impact of an upper tro-posphere teleconnection pattern on the Mediterranean climate, Geophysical Research Abstracts, 7, 08229, European Geophysi-cal Union Conference, 2005.
Hatzaki, M., Flocas, H. A., Asimakopoulos, D. N., and Maheras, P.: The Eastern Mediterranean teleconnection pattern: Identification and definition, Int. J. Climatol., 27, 727–737, 2007.
Houssos, E. E., and Bartzokas, A.: Extreme precipitation events in NW Greece, Adv. Geosci., 7, 91–96, 2006,
http://www.adv-geosci.net/7/91/2006/.
Jacovides, C. P., Tymvios, F. S., Asimakopoulos, D. N., Theofilou, K. M., and Pashiardes, S.: Global photosynthetically active radi-ation and its relradi-ationship with global solar radiradi-ation in the East-ern Mediterranean basin, Theor. Appl. Climatol., 74, 227–233, 2003.
Kutiel, H., Maheras, P., T¨urkes, M., and Paz, S.: North Sea-Caspian Pattern–an upper level atmospheric teleconnection affecting the eastern Mediterranean – Implications on the regional climate, Theor. Appl. Climatol., 72, 173–192, 2002.
Maheras, P., Xoplaki, E., and Kutiel, H.: Wet and dry monthly anomalies across the Mediterranean basin and their relationship with circulation 1860–1990, Theor. Appl. Climatol., 64, 189– 199, 1999a.
Maheras, P., Xoplaki, E., Davies, T., Martin-Vide, J., Bariendos, M., and Alcoforado, M.: Warm and cold monthly anomalies across the Mediterranean basin and their relationship with circulation; 1860–1990, Int. J. Climatol., 19, 1697–1715, 1999b.
Maheras, P., Flocas, H. A., Patrikas, I., and Anagnostopoulou C.: A 40 year objective climatology of surface cyclones in the Mediter-ranean region: spatial and temporal distribution, Int. J. Climatol., 21, 109–130, 2001.
Maheras, P. Flocas, H. A., Anagnostopoulou, C., and Patrikas, I.: On the vertical structure of surface cyclones in the Mediterranean region, Theor. Appl. Climatol., 71, 199–217, 2002.
Meteorological Service: The climate of Cyprus, Nicosia, 25 p., 1986.
Michaelides, S., Pattichis, C. S., and Kleovoulou, G.: Classification of rainfall variability by using artificial neural networks, Int. J. Climtol., 21, 1401–1414, 2001.
Nicolaides, K., Michaelides, S., and Karacostas, T.: Spatial distri-bution of some dynamic parameters during the evolution of se-lected depressions over the area of Cyprus, Int. J. Climatol., 24, 1829–1844, 2004.
136 M. Hatzaki et al.: The impact of an upper tropospheric teleconnection pattern Quadrelli, R. and Wallace, J. M.: Varied expressions of the
hemi-spheric circulation observed in association with contrasting Po-larities of prescribed patterns of variability, J. Climate, 21, 4245– 4253, 2004.
Tolika, K. and Maheras, P.: Spatial and temporal characteristics of wet spells in Greece, Theor. Appl. Climatol., 21, 71–85, 2005.
T¨urkes, M.: Spatial and temporal variations in precipitation and aridity index series in Turkey. In: Mediterranean climate, Vari-ability and trends, edited by: Bolle, H.-J., Springer, 181–213, 2003.
T¨urkes, M. and Erlat, E.: Climatological responses of winter pre-cipitation in Turkey to variability of North Atlantic Oscillation during the period 1930–2001, Theor. Appl. Clim., 81, 45–69, 2005.